
Houses for sale & to rent in Lingfield, Darlington
House Prices in Lingfield
Properties in Lingfield have an average house price of £135k and had 176 Property Transactions within the last 3 years¹.
Lingfield is an area in Darlington, Darlington with 1,622 households², where the most expensive property was sold for £270k.
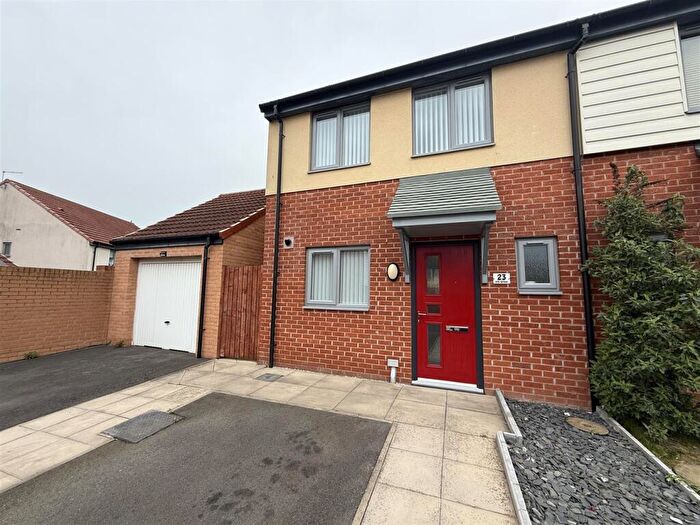
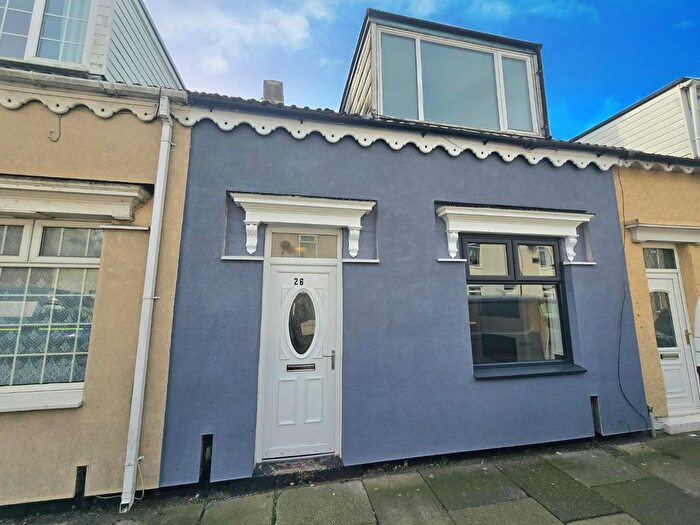
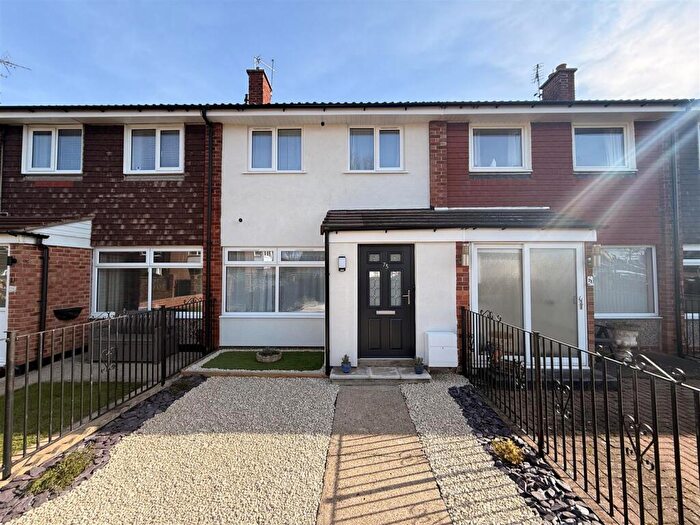
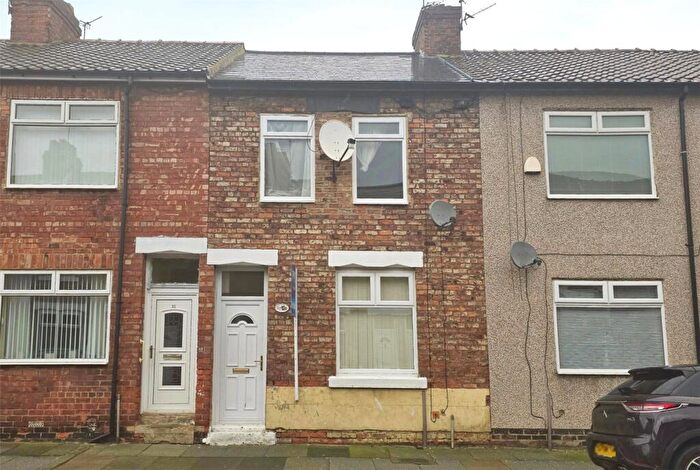
Properties for sale in Lingfield
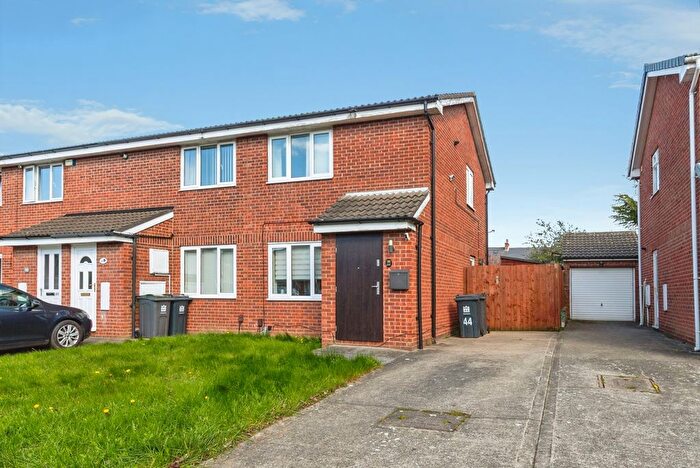
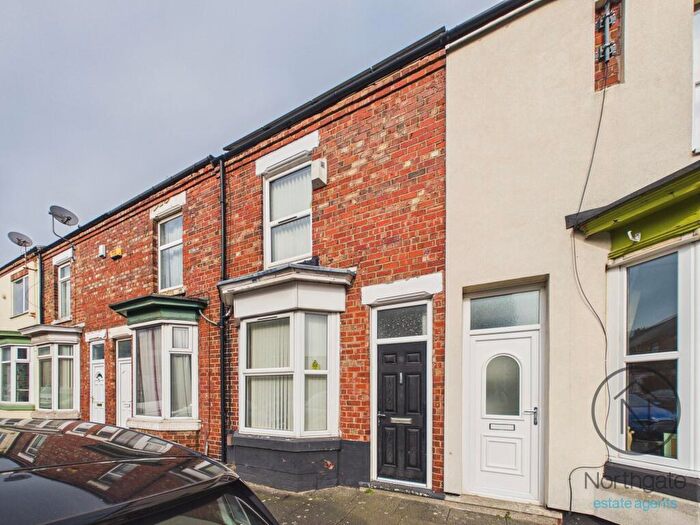
![]()
If you are looking to sell your house, let it out, or receive a property valuation, an expert can help you.
Click the button below to get started.
Roads and Postcodes in Lingfield
Navigate through our locations to find the location of your next house in Lingfield, Darlington for sale or to rent.
| Streets | Postcodes |
|---|---|
| Albatross Way | DL1 1DN |
| Arnold Road | DL1 1JG |
| Bourne Avenue | DL1 1LJ DL1 1LN |
| Bourne Court | DL1 1GT |
| Brunel Way | DL1 1DY |
| Byron Road | DL1 1JQ |
| Cyclamen Grove | DL1 1GS |
| Dinsdale Crescent | DL1 1EY DL1 1EZ |
| Dudley Road | DL1 4GG |
| Falcon Road | DL1 1DE |
| Flamingo Close | DL1 1DW |
| Haven Close | DL1 1PF |
| Haven Gardens | DL1 1PJ |
| Heron Drive | DL1 1DG DL1 1DL |
| Hundens Lane | DL1 1JB DL1 1JF DL1 1JJ DL1 1JL |
| John Dixon Lane | DL1 1HG |
| Kestrel Close | DL1 1BL |
| Larkspur Drive | DL1 1HX |
| Lingfield Green | DL1 1DD |
| Malim Road | DL1 1BG |
| Mallard Road | DL1 1BN |
| Marigold Court | DL1 1HZ |
| Mcmullen Road | DL1 1BW DL1 1DA |
| Morton Park Way | DL1 4WE |
| Paton Way | DL1 1LP |
| Pond View | DL1 1LD |
| Rennie Walk | DL1 1DU |
| Shearwater Avenue | DL1 1DH DL1 1DJ DL1 1DQ |
| Shelley Road | DL1 1JH |
| Speedwell Close | DL1 1JA |
| Teal Road | DL1 1BQ DL1 1DF |
| The Broadway | DL1 1EG DL1 1EJ DL1 1EL |
| The Broadway South | DL1 1DB |
| The Byway | DL1 1EH DL1 1EQ |
| The Causeway | DL1 1EN |
| The Crossway | DL1 1ER DL1 1EW |
| The Fairway | DL1 1ES |
| The Mead | DL1 1EU DL1 1EX |
| The Stray | DL1 1EP |
| Violet Grove | DL1 1GR |
| Widgeon Road | DL1 1BJ |
| Yarm Road | DL1 1BA DL1 1BD DL1 1BE DL1 1ED DL1 1EE DL1 1EF |
Transport near Lingfield

- FAQ
- Price Paid By Year
- Property Type Price
Frequently asked questions about Lingfield
What is the average price for a property for sale in Lingfield?
The average price for a property for sale in Lingfield is £134,723. This amount is 18% lower than the average price in Darlington. There are 836 property listings for sale in Lingfield.
What streets have the most expensive properties for sale in Lingfield?
The streets with the most expensive properties for sale in Lingfield are The Fairway at an average of £189,590, Pond View at an average of £170,000 and John Dixon Lane at an average of £168,625.
What streets have the most affordable properties for sale in Lingfield?
The streets with the most affordable properties for sale in Lingfield are Haven Gardens at an average of £69,833, Hundens Lane at an average of £79,681 and Dinsdale Crescent at an average of £82,499.
Which train stations are available in or near Lingfield?
Some of the train stations available in or near Lingfield are Darlington, North Road and Dinsdale.
Property Price Paid in Lingfield by Year
The average sold property price by year was:
| Year | Average Sold Price | Price Change |
Sold Properties
|
|---|---|---|---|
| 2026 | £103,000 | -31% |
1 Property |
| 2025 | £135,183 | 2% |
60 Properties |
| 2024 | £132,399 | -4% |
60 Properties |
| 2023 | £137,335 | 2% |
55 Properties |
| 2022 | £134,776 | 10% |
65 Properties |
| 2021 | £120,751 | 6% |
85 Properties |
| 2020 | £113,270 | -14% |
58 Properties |
| 2019 | £129,045 | -0,4% |
58 Properties |
| 2018 | £129,521 | 16% |
79 Properties |
| 2017 | £109,342 | 8% |
65 Properties |
| 2016 | £100,816 | -8% |
52 Properties |
| 2015 | £108,657 | -12% |
55 Properties |
| 2014 | £121,383 | 12% |
68 Properties |
| 2013 | £107,103 | 21% |
41 Properties |
| 2012 | £84,317 | -26% |
37 Properties |
| 2011 | £106,328 | 0,1% |
26 Properties |
| 2010 | £106,205 | 4% |
29 Properties |
| 2009 | £102,338 | -11% |
29 Properties |
| 2008 | £113,827 | 2% |
34 Properties |
| 2007 | £112,024 | 1% |
58 Properties |
| 2006 | £111,124 | 5% |
85 Properties |
| 2005 | £105,719 | 5% |
53 Properties |
| 2004 | £100,504 | 24% |
76 Properties |
| 2003 | £76,197 | 18% |
88 Properties |
| 2002 | £62,405 | 18% |
104 Properties |
| 2001 | £51,251 | 10% |
111 Properties |
| 2000 | £46,170 | 7% |
67 Properties |
| 1999 | £42,842 | -5% |
48 Properties |
| 1998 | £44,946 | -23% |
45 Properties |
| 1997 | £55,478 | 26% |
52 Properties |
| 1996 | £41,081 | -7% |
58 Properties |
| 1995 | £43,868 | - |
45 Properties |
Property Price per Property Type in Lingfield
Here you can find historic sold price data in order to help with your property search.
The average Property Paid Price for specific property types in the last three years are:
| Property Type | Average Sold Price | Sold Properties |
|---|---|---|
| Semi Detached House | £141,356.00 | 119 Semi Detached Houses |
| Detached House | £222,062.00 | 8 Detached Houses |
| Terraced House | £114,421.00 | 38 Terraced Houses |
| Flat | £69,590.00 | 11 Flats |