
Houses for sale & to rent in Blackwell, Alfreton
House Prices in Blackwell
Properties in Blackwell have an average house price of £180k and had 178 Property Transactions within the last 3 years¹.
Blackwell is an area in Alfreton, Derbyshire with 1,890 households², where the most expensive property was sold for £600k.
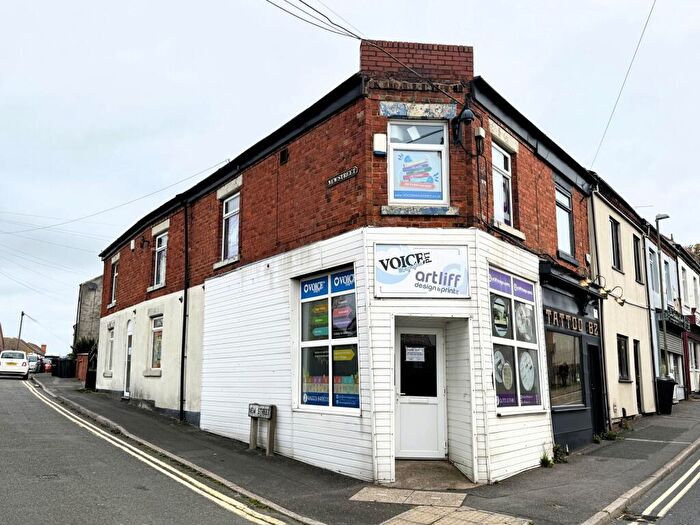
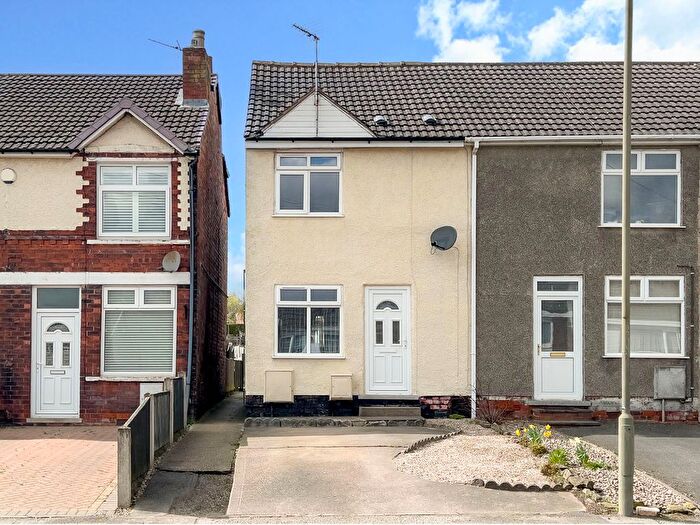
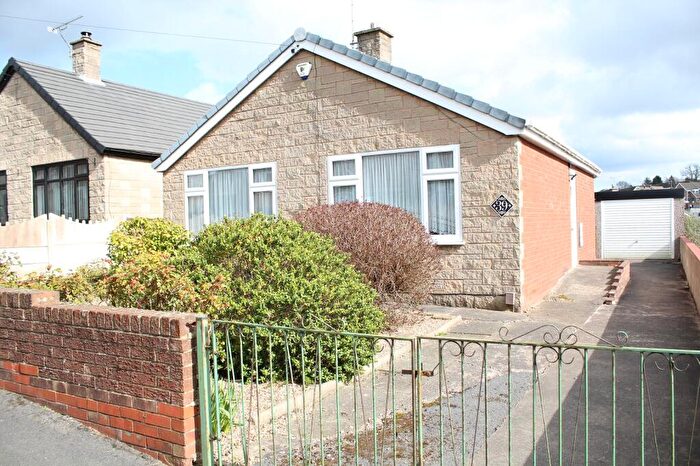
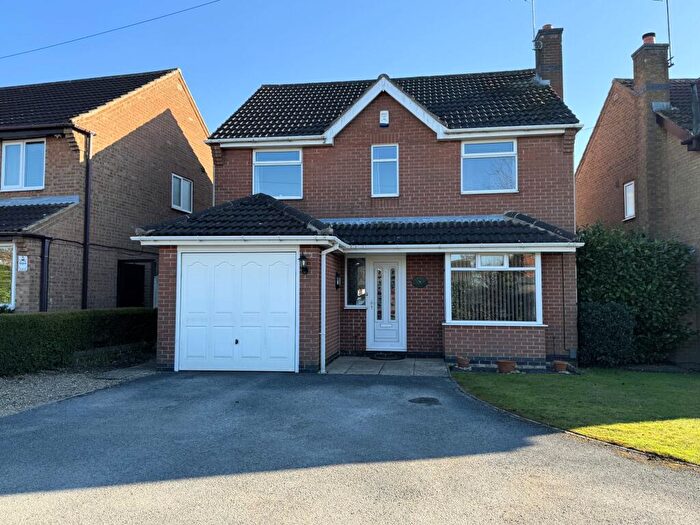
Properties for sale in Blackwell

![]()
If you are looking to sell your house, let it out, or receive a property valuation, an expert can help you.
Click the button below to get started.


Roads and Postcodes in Blackwell
Navigate through our locations to find the location of your next house in Blackwell, Alfreton for sale or to rent.
| Streets | Postcodes |
|---|---|
| Alfreton Road | DE55 5AG DE55 5AH DE55 5AJ DE55 5JH DE55 5JN DE55 5TP DE55 5TQ DE55 5TR |
| Alport Terrace | DE55 5AE |
| Ashover View | DE55 5AR |
| Bamford Street | DE55 5TG |
| Bolden Terrace | DE55 5AF |
| Cambridge Street | DE55 5JX |
| Central Drive | DE55 5JS |
| Chapel Close | DE55 5BL |
| Charnwood Crescent | DE55 5SB DE55 5SH |
| Church Close | DE55 5AQ |
| Church Hill | DE55 5HN |
| Church View | DE55 5LD |
| Cokefield Terrace | DE55 5HW |
| Cragg Lane | DE55 5HZ DE55 5TN |
| Crich View | DE55 5TF |
| Cromwell Avenue | DE55 5JW |
| Dale Avenue | DE55 5UA |
| Deamon Street | DE55 5JQ |
| Devonshire Drive | DE55 5UG |
| Dodgewell Close | DE55 5BH |
| Fairfield Avenue | DE55 5HL |
| Fen Close | DE55 5TD |
| Fern Bank Avenue | DE55 5HA |
| Fordbridge Lane | DE55 5JY |
| Gladstone Avenue | DE55 5JU |
| Glen Close | DE55 5TU |
| Glinton Avenue | DE55 5HD |
| Gloves Lane | DE55 5JJ |
| Hall Lane | DE55 5TL |
| Hallfield Road | DE55 5UB |
| Hardwick Close | DE55 5LL |
| Helpston Close | DE55 5AX |
| Hilcote Lane | DE55 5HR DE55 5HS DE55 5NS |
| Huthwaite Lane | DE55 5HY DE55 5HX |
| Littlemoor Lane | DE55 5TY |
| Main Street | DE55 5TE |
| Manor Close | DE55 5UQ DE55 5BB |
| Meadow Grove | DE55 5TW |
| Metro Avenue | DE55 5UF |
| Midland Terrace | DE55 5AB |
| Moor Farm Close | DE55 5SN |
| New Lane | DE55 5HT |
| New Street | DE55 5HU DE55 5TH |
| Newlands Crescent | DE55 5TX |
| North Street | DE55 5TS |
| Oak Tree Road | DE55 5HF |
| Oak View | DE55 5BE |
| Oxford Street | DE55 5JT |
| Park Mill Drive | DE55 5AL |
| Pasture Lane | DE55 5PE DE55 5HQ |
| Pendean Close | DE55 5HB |
| Pennine Close | DE55 5UD |
| Pettifor Terrace | DE55 5AD |
| Primrose Business Park | DE55 5GZ |
| Primrose Hill | DE55 5JE DE55 5JF DE55 5JG |
| Primrose Terrace | DE55 5JZ |
| Priory Way | DE55 5TB |
| Recreation Close | DE55 5LW |
| Red Barn Close | DE55 5SJ |
| Red Barn Lane | DE55 5SD |
| Sandwood Close | DE55 5UE |
| School Close | DE55 5AT DE55 5SL |
| Sherwood Street | DE55 5SE |
| Sidings Way | DE55 5AS |
| South Street | DE55 5TT |
| St Werburgh's View | DE55 5UL |
| Strutt Close | DE55 5UN |
| The Green | DE55 5TJ |
| The Paddock | DE55 5HJ |
| The Ridge | DE55 5JR |
| Thurgaton Way | DE55 5TA |
| Tibshelf Road | DE55 5AA |
| Tomlinson Close | DE55 5AW |
| Victoria Drive | DE55 5JL |
| Waterloo Close | DE55 5HG |
| Weavers Court | DE55 5UH |
| Westfield Drive | DE55 5LP |
| Whites Lane | DE55 5GX DE55 5GY |
| Wilson Avenue | DE55 5JP |
| Wire Lane | DE55 5SA |
| Woburn Close | DE55 5HE DE55 5HH |
| DE55 5SG |
Transport near Blackwell

- FAQ
- Price Paid By Year
- Property Type Price
Frequently asked questions about Blackwell
What is the average price for a property for sale in Blackwell?
The average price for a property for sale in Blackwell is £179,603. This amount is 10% lower than the average price in Alfreton. There are 1,688 property listings for sale in Blackwell.
What streets have the most expensive properties for sale in Blackwell?
The streets with the most expensive properties for sale in Blackwell are Church Hill at an average of £600,000, Priory Way at an average of £375,000 and Cragg Lane at an average of £350,000.
What streets have the most affordable properties for sale in Blackwell?
The streets with the most affordable properties for sale in Blackwell are Bamford Street at an average of £92,500, Alport Terrace at an average of £100,666 and Sandwood Close at an average of £105,943.
Which train stations are available in or near Blackwell?
Some of the train stations available in or near Blackwell are Alfreton, Kirkby in Ashfield and Sutton Parkway.
Property Price Paid in Blackwell by Year
The average sold property price by year was:
| Year | Average Sold Price | Price Change |
Sold Properties
|
|---|---|---|---|
| 2026 | £233,000 | 18% |
1 Property |
| 2025 | £191,222 | 4% |
63 Properties |
| 2024 | £182,697 | 14% |
68 Properties |
| 2023 | £157,957 | -9% |
46 Properties |
| 2022 | £172,234 | 10% |
69 Properties |
| 2021 | £155,263 | 3% |
76 Properties |
| 2020 | £150,905 | 1% |
65 Properties |
| 2019 | £149,783 | -6% |
69 Properties |
| 2018 | £158,795 | 8% |
59 Properties |
| 2017 | £146,167 | 7% |
80 Properties |
| 2016 | £135,541 | -10% |
92 Properties |
| 2015 | £149,376 | 9% |
67 Properties |
| 2014 | £136,358 | 23% |
101 Properties |
| 2013 | £105,414 | 4% |
57 Properties |
| 2012 | £100,945 | 2% |
39 Properties |
| 2011 | £99,374 | -26% |
36 Properties |
| 2010 | £125,407 | -18% |
34 Properties |
| 2009 | £148,360 | -6% |
43 Properties |
| 2008 | £157,144 | 19% |
62 Properties |
| 2007 | £127,720 | 7% |
84 Properties |
| 2006 | £118,486 | 13% |
75 Properties |
| 2005 | £102,967 | 3% |
71 Properties |
| 2004 | £100,297 | 29% |
78 Properties |
| 2003 | £71,678 | 27% |
88 Properties |
| 2002 | £52,455 | 6% |
96 Properties |
| 2001 | £49,179 | 3% |
115 Properties |
| 2000 | £47,874 | 8% |
67 Properties |
| 1999 | £43,945 | 10% |
56 Properties |
| 1998 | £39,577 | 9% |
83 Properties |
| 1997 | £36,001 | -1% |
63 Properties |
| 1996 | £36,268 | 8% |
66 Properties |
| 1995 | £33,242 | - |
53 Properties |
Property Price per Property Type in Blackwell
Here you can find historic sold price data in order to help with your property search.
The average Property Paid Price for specific property types in the last three years are:
| Property Type | Average Sold Price | Sold Properties |
|---|---|---|
| Semi Detached House | £157,567.00 | 84 Semi Detached Houses |
| Detached House | £260,329.00 | 50 Detached Houses |
| Terraced House | £130,402.00 | 43 Terraced Houses |
| Flat | £110,000.00 | 1 Flat |