Houses for sale & to rent in South Normanton East, Alfreton
House Prices in South Normanton East
Properties in South Normanton East have an average house price of £182,159.00 and had 270 Property Transactions within the last 3 years¹.
South Normanton East is an area in Alfreton, Derbyshire with 1,940 households², where the most expensive property was sold for £385,000.00.
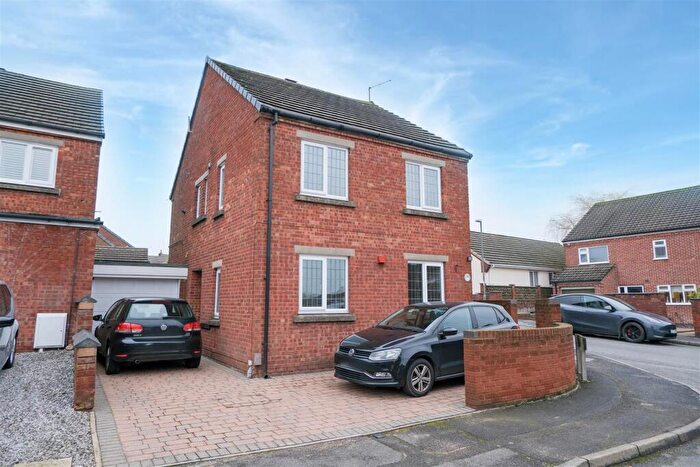
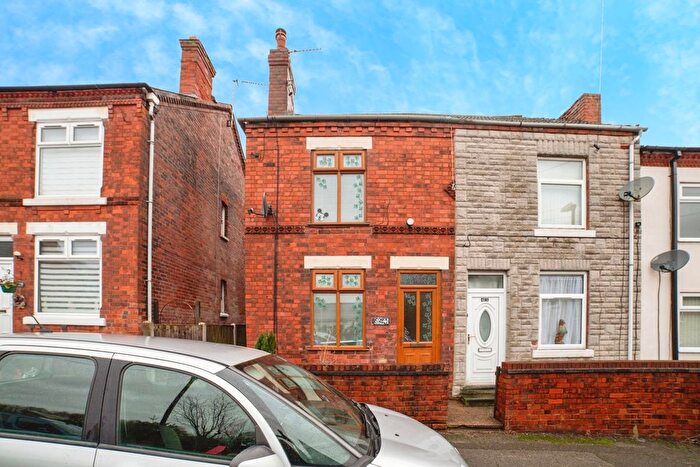
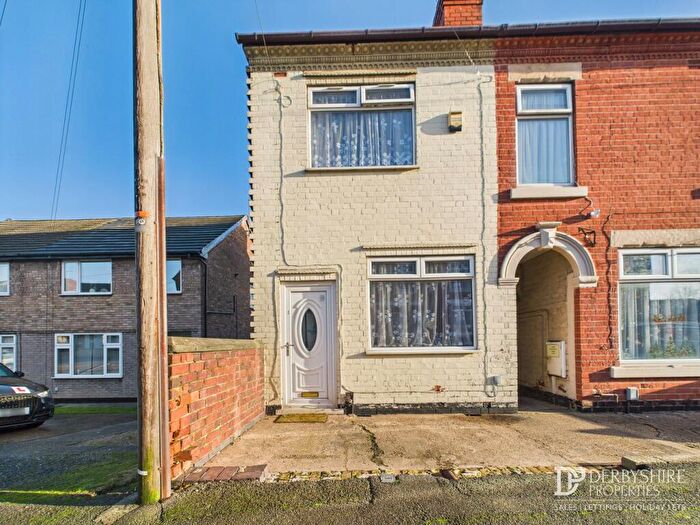
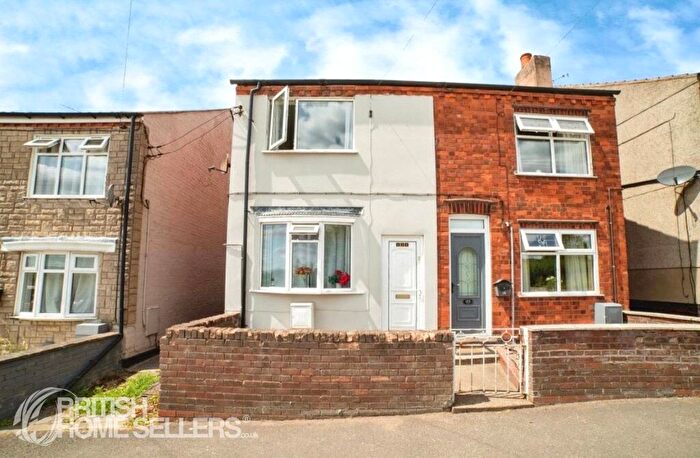
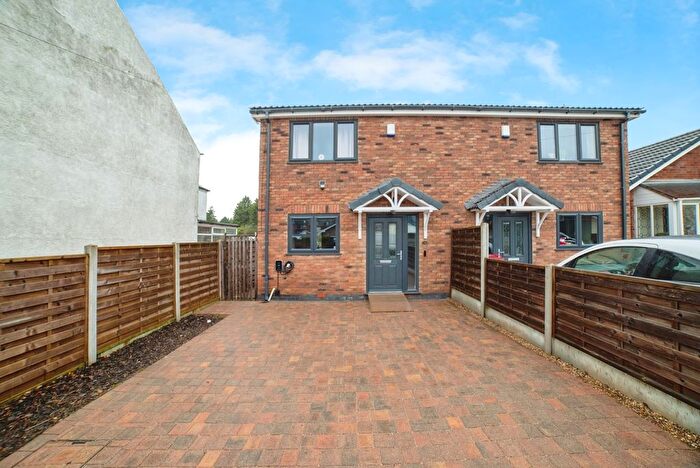
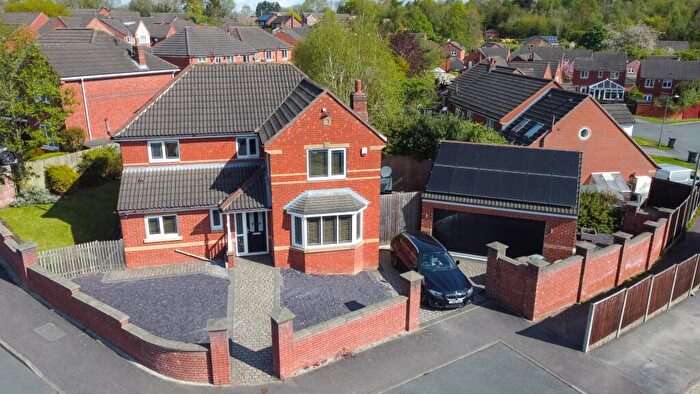
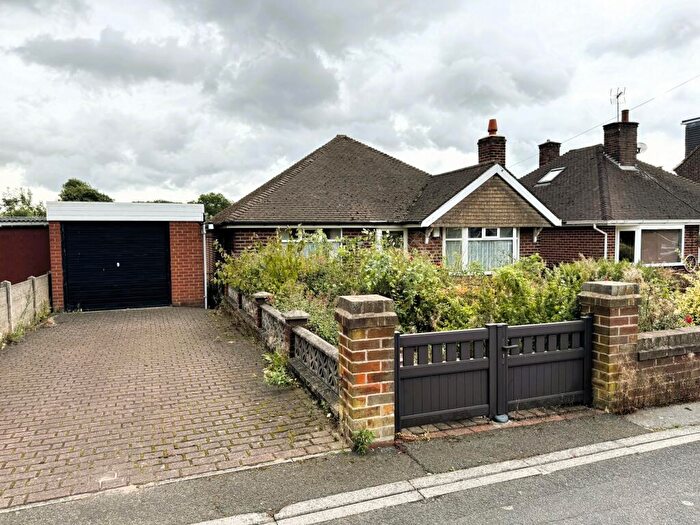
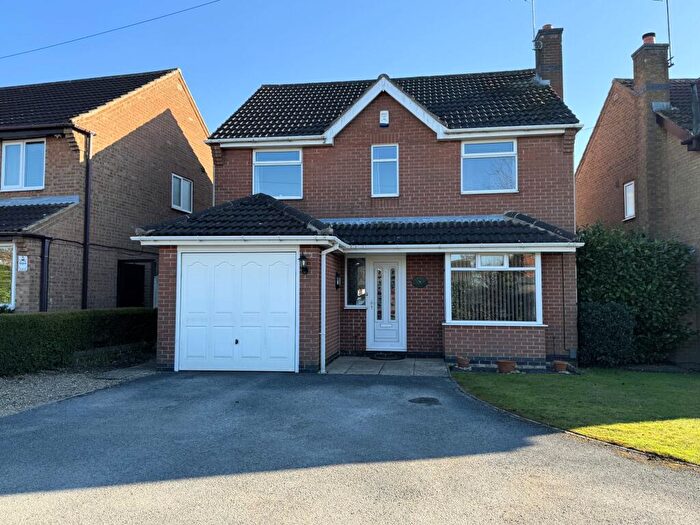
Properties for sale in South Normanton East
Roads and Postcodes in South Normanton East
Navigate through our locations to find the location of your next house in South Normanton East, Alfreton for sale or to rent.
| Streets | Postcodes |
|---|---|
| Albert Street | DE55 2DB |
| Ball Hill | DE55 2EB DE55 2ED |
| Beech Grove | DE55 2HY |
| Berristow Lane | DE55 2EG DE55 2FH DE55 2GF DE55 2JJ DE55 2JL |
| Berristow Place | DE55 2EA |
| Bramble Close | DE55 2LJ |
| Carr Close | DE55 2DQ |
| Carr Lane | DE55 2DN |
| Carter Lane East | DE55 2DY DE55 2DZ DE55 2EH DE55 2GB |
| Central Avenue | DE55 2HT |
| Cherry Close | DE55 2EU |
| Church Street | DE55 2BT |
| Collins Avenue | DE55 2DL |
| Corn Close | DE55 2JD DE55 2JE |
| Coronation Drive | DE55 2HR DE55 2HS DE55 2JF |
| Dahlia Avenue | DE55 2JH |
| Downing Street | DE55 2HE |
| Duke Street | DE55 2DD |
| Eastfield Drive | DE55 2HG DE55 2HN |
| Edale Drive | DE55 2LF |
| Erica Drive | DE55 2ET |
| Filigree Close | DE55 2GD |
| Fordbridge Lane | DE55 2DP |
| Gladstone Street | DE55 2DF |
| Green Acres Drive | DE55 2LA |
| Hardwick Court | DE55 2FQ |
| Hazel Grove | DE55 2JG |
| High View Road | DE55 2DT |
| Highfield Drive | DE55 2HW |
| Hollyhouse Drive | DE55 2LB |
| Honeysuckle Drive | DE55 2FR |
| Jacques Orchard | DE55 2FU |
| Kennack Close | DE55 2FE |
| Knitters Road | DE55 2FL DE55 2FT |
| Kynance Close | DE55 2FD |
| Laburnum Close | DE55 2EW |
| Lansbury Drive | DE55 2BZ DE55 2HD |
| Leamington Drive | DE55 2HX |
| Main Street | DE55 2DH |
| Maisies Way | DE55 2DS |
| Mansfield Road | DE55 2EF |
| Millers Dale Drive | DE55 2LG |
| Newlyn Drive | DE55 2FJ |
| Normanton Brook Road | DE55 2FW |
| Peach Avenue | DE55 2EZ |
| Peel Street | DE55 2DE |
| Pendine Close | DE55 2FF |
| Penryn Close | DE55 2FN |
| Poplar Road | DE55 2EQ |
| Primrose Close | DE55 2EY |
| Princess Avenue | DE55 2HP |
| Revell Close | DE55 2HU |
| Rosewood Close | DE55 2EX |
| Sough Road | DE55 2LD DE55 2LE |
| South Street | DE55 2DA |
| Spinners Close | DE55 2GA |
| Sporton Close | DE55 2HH |
| Sporton Lane | DE55 2DJ |
| St Michaels Drive | DE55 2HL |
| The Croft | DE55 2BU DE55 2BW |
| Thornhill Drive | DE55 2FS |
| Turnley Road | DE55 2FB |
| Victoria Street | DE55 2BX DE55 2BY |
| Water Lane | DE55 2DG DE55 2EE DE55 2GE |
| Weavers Way | DE55 2FZ |
| Wincobank Way | DE55 2FX |
Transport near South Normanton East
- FAQ
- Price Paid By Year
- Property Type Price
Frequently asked questions about South Normanton East
What is the average price for a property for sale in South Normanton East?
The average price for a property for sale in South Normanton East is £182,159. This amount is 9% lower than the average price in Alfreton. There are 863 property listings for sale in South Normanton East.
What streets have the most expensive properties for sale in South Normanton East?
The streets with the most expensive properties for sale in South Normanton East are Penryn Close at an average of £335,000, Kynance Close at an average of £290,000 and Edale Drive at an average of £290,000.
What streets have the most affordable properties for sale in South Normanton East?
The streets with the most affordable properties for sale in South Normanton East are Albert Street at an average of £113,250, Water Lane at an average of £115,661 and Beech Grove at an average of £116,375.
Which train stations are available in or near South Normanton East?
Some of the train stations available in or near South Normanton East are Alfreton, Kirkby in Ashfield and Sutton Parkway.
Property Price Paid in South Normanton East by Year
The average sold property price by year was:
| Year | Average Sold Price | Price Change |
Sold Properties
|
|---|---|---|---|
| 2025 | £206,045 | 9% |
47 Properties |
| 2024 | £187,401 | 7% |
66 Properties |
| 2023 | £173,525 | 1% |
75 Properties |
| 2022 | £172,145 | -1% |
82 Properties |
| 2021 | £173,111 | 8% |
102 Properties |
| 2020 | £158,978 | 9% |
88 Properties |
| 2019 | £144,461 | 9% |
94 Properties |
| 2018 | £131,148 | -2% |
85 Properties |
| 2017 | £133,839 | 9% |
68 Properties |
| 2016 | £122,022 | -16% |
93 Properties |
| 2015 | £141,109 | 11% |
111 Properties |
| 2014 | £125,896 | -4% |
123 Properties |
| 2013 | £130,797 | 17% |
88 Properties |
| 2012 | £108,044 | 7% |
44 Properties |
| 2011 | £100,847 | -4% |
47 Properties |
| 2010 | £104,839 | -4% |
52 Properties |
| 2009 | £109,480 | -2% |
46 Properties |
| 2008 | £111,640 | -3% |
64 Properties |
| 2007 | £115,043 | -12% |
119 Properties |
| 2006 | £128,969 | 9% |
117 Properties |
| 2005 | £117,372 | 16% |
129 Properties |
| 2004 | £98,033 | 17% |
120 Properties |
| 2003 | £81,608 | 22% |
145 Properties |
| 2002 | £63,838 | 17% |
165 Properties |
| 2001 | £53,105 | -8% |
123 Properties |
| 2000 | £57,205 | 10% |
106 Properties |
| 1999 | £51,378 | -2% |
107 Properties |
| 1998 | £52,172 | 6% |
77 Properties |
| 1997 | £49,056 | 12% |
89 Properties |
| 1996 | £43,271 | -3% |
91 Properties |
| 1995 | £44,412 | - |
98 Properties |
Property Price per Property Type in South Normanton East
Here you can find historic sold price data in order to help with your property search.
The average Property Paid Price for specific property types in the last three years are:
| Property Type | Average Sold Price | Sold Properties |
|---|---|---|
| Semi Detached House | £159,866.00 | 120 Semi Detached Houses |
| Detached House | £258,111.00 | 84 Detached Houses |
| Terraced House | £129,736.00 | 62 Terraced Houses |
| Flat | £68,500.00 | 4 Flats |

