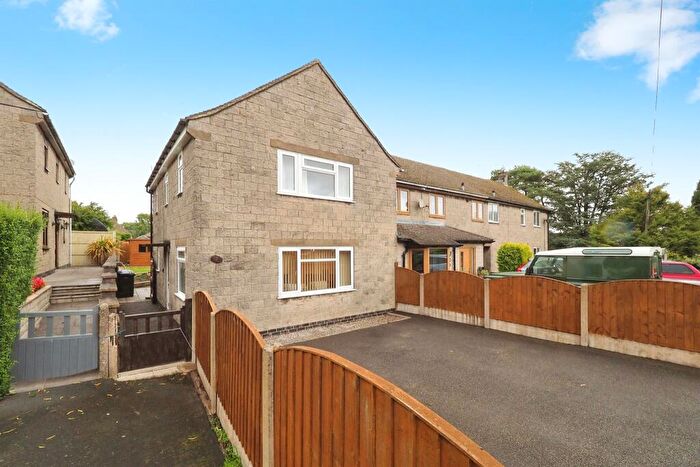
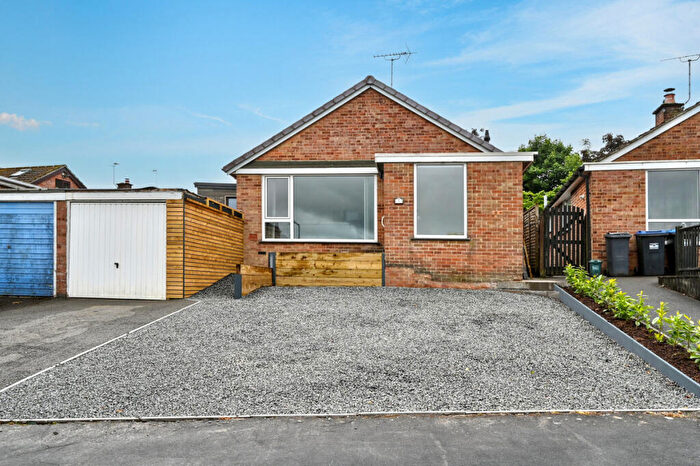
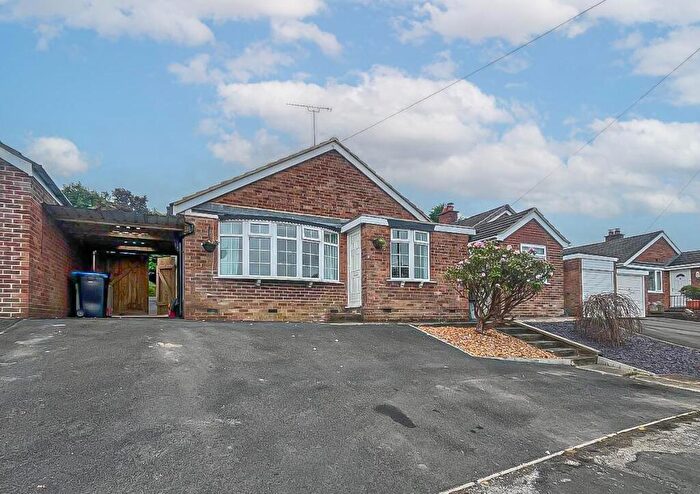
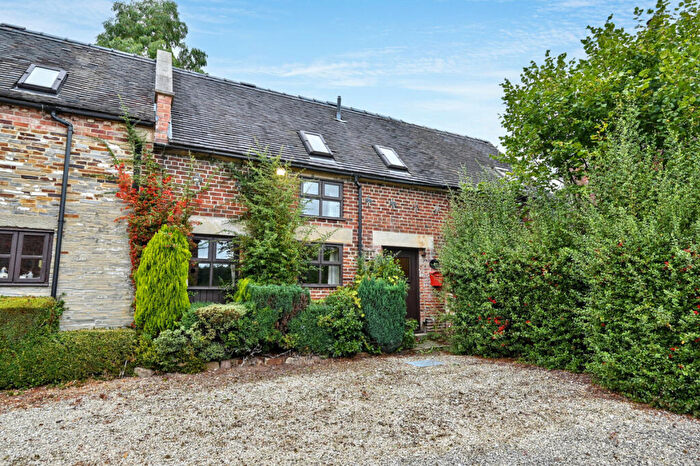
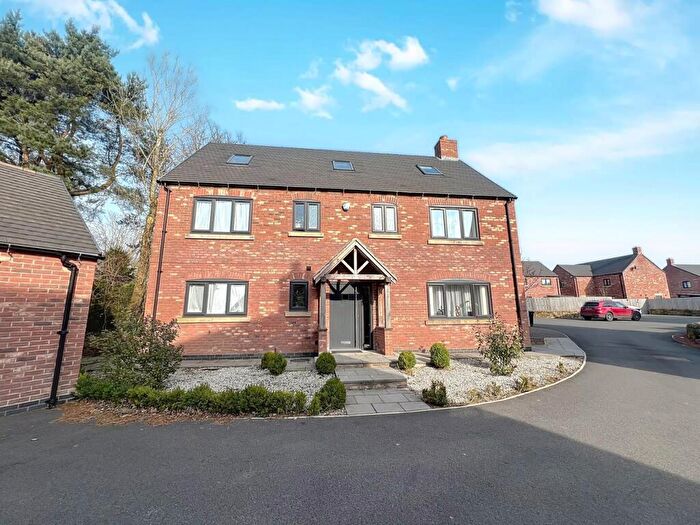
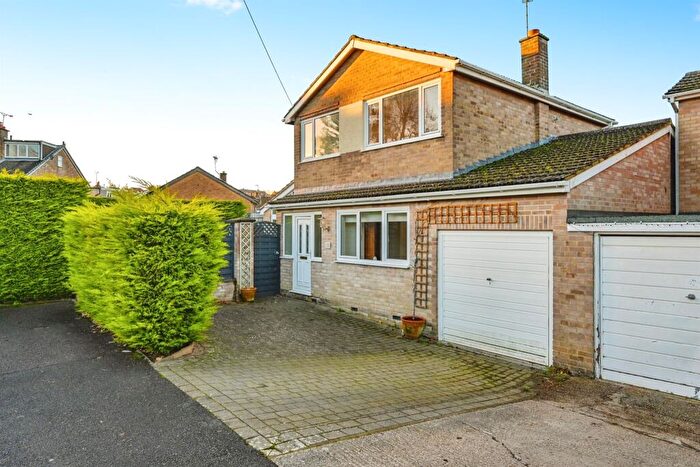
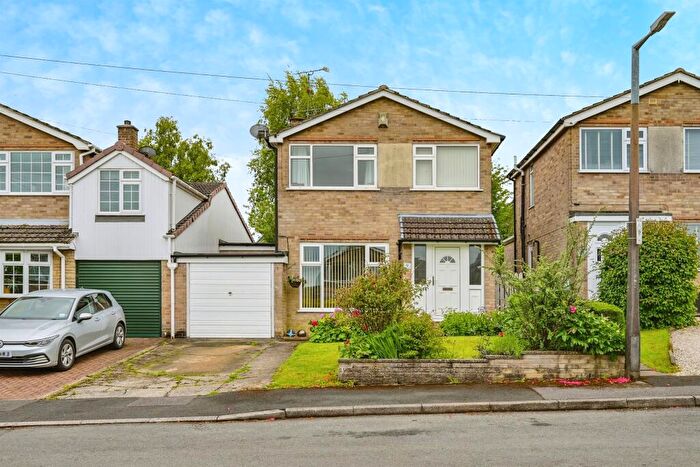
Houses for sale & to rent in Hulland, Ashbourne
House Prices in Hulland
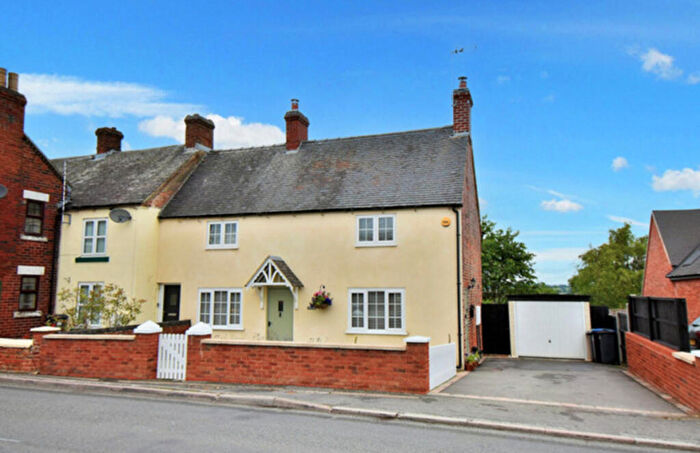
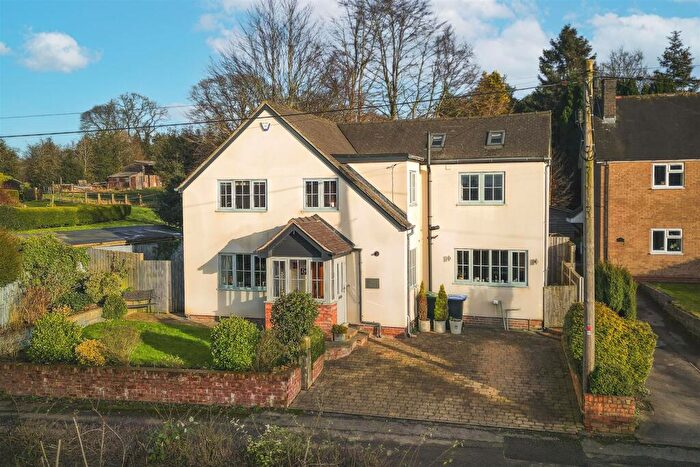
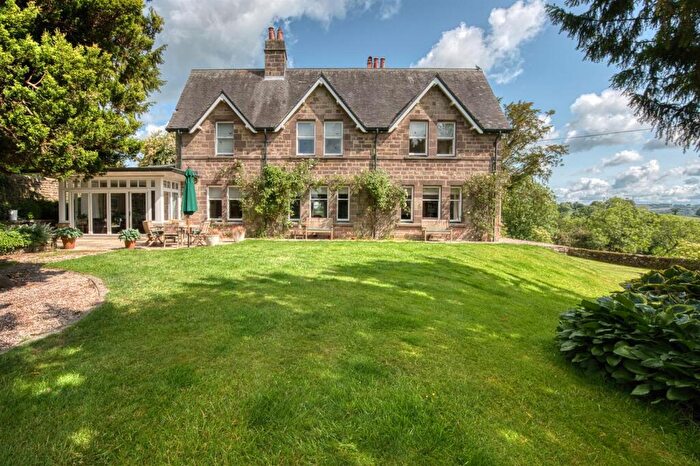
Properties in Hulland have an average house price of £377,974.00 and had 62 Property Transactions within the last 3 years¹.
Hulland is an area in Ashbourne, Derbyshire with 697 households², where the most expensive property was sold for £850,000.00.
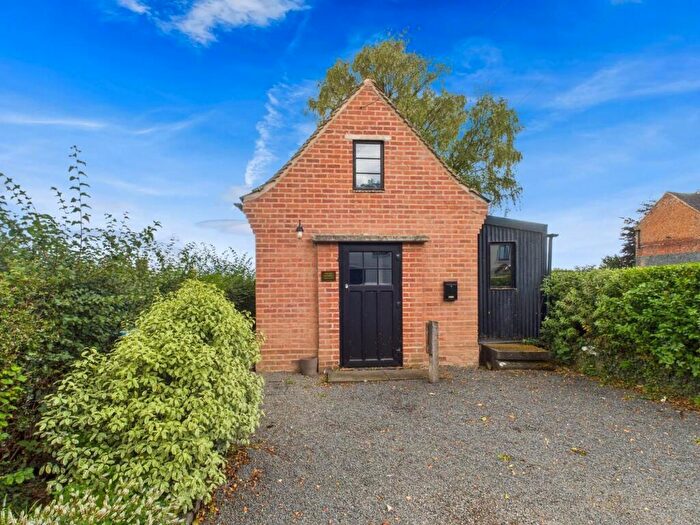
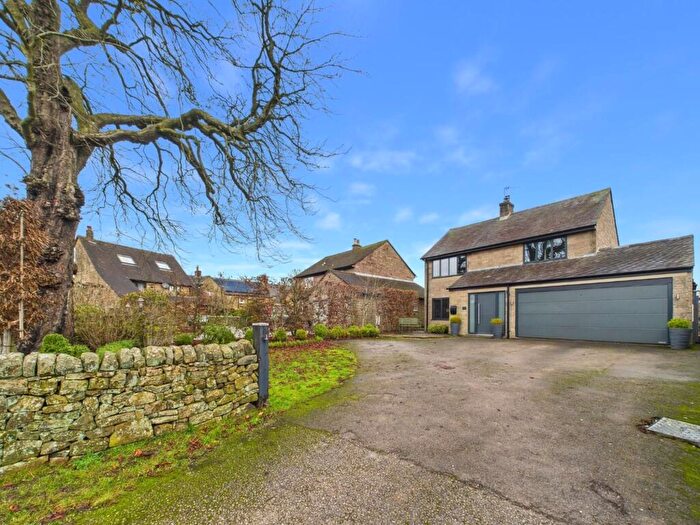
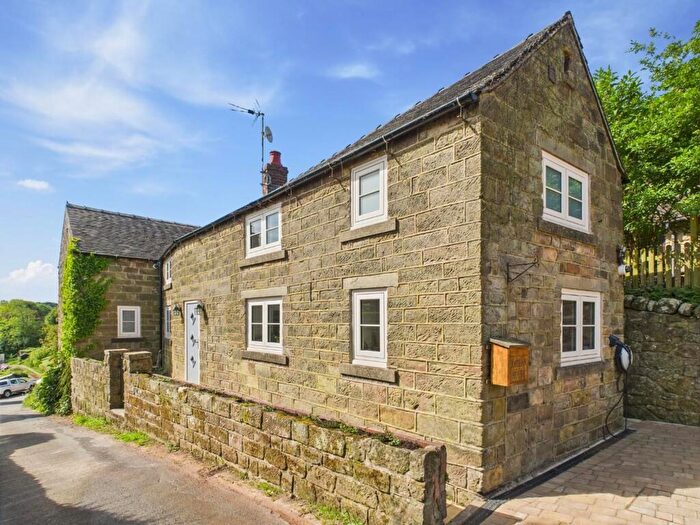
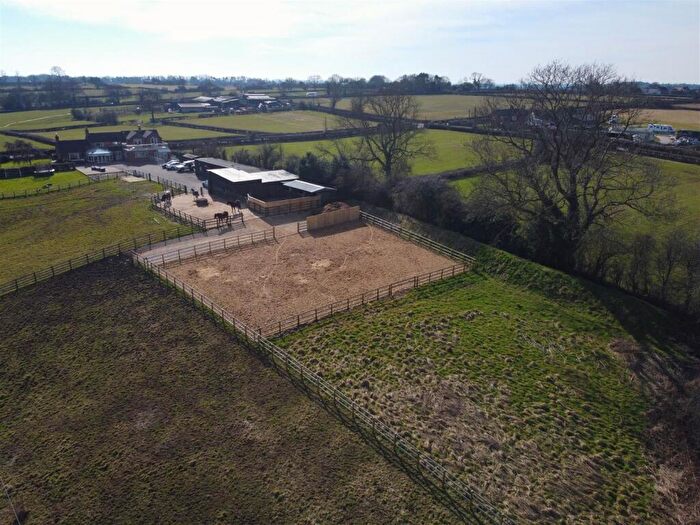
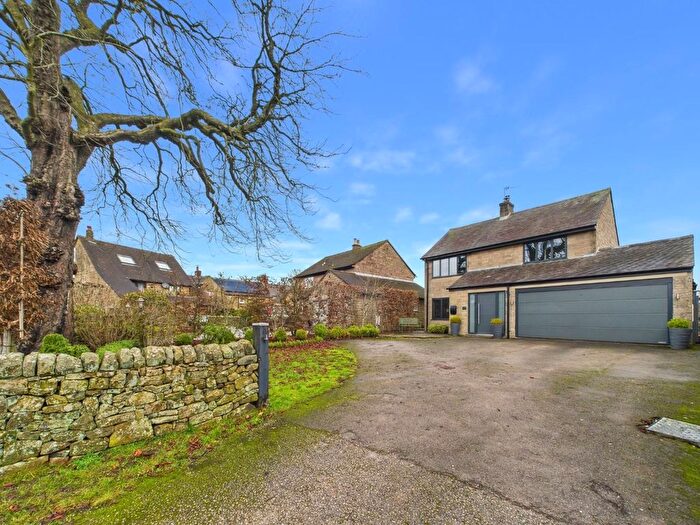
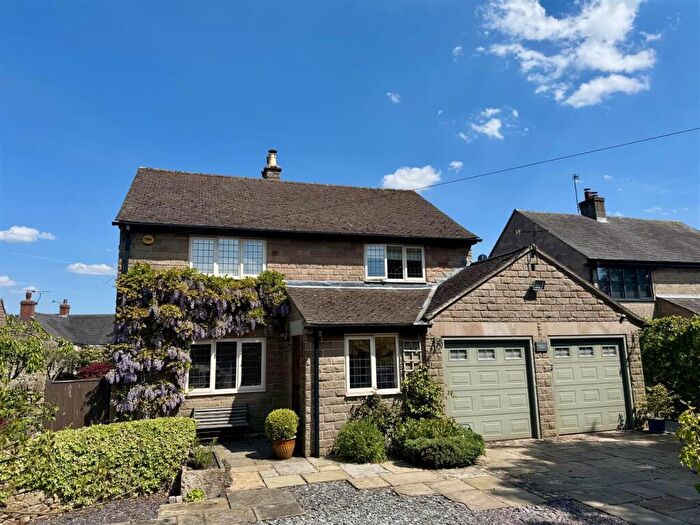
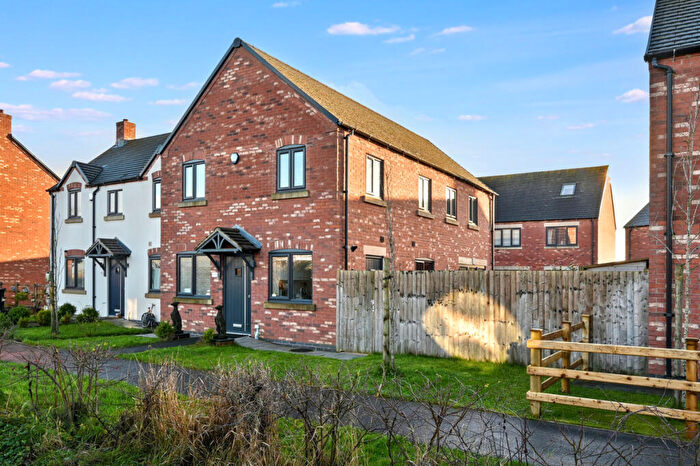
Properties for sale in Hulland
Previously listed properties in Hulland
Roads and Postcodes in Hulland
Navigate through our locations to find the location of your next house in Hulland, Ashbourne for sale or to rent.
| Streets | Postcodes |
|---|---|
| Alport Close | DE6 3FR |
| Ashes Avenue | DE6 3FT |
| Beech Avenue | DE6 3FF |
| Biggin View | DE6 3GF |
| Blind Lane | DE6 3HE |
| Broadway | DE6 3LJ |
| Callow Lane | DE4 4NW |
| Cedar Court | DE6 3EU |
| Charles Walker Close | DE6 3DW |
| Dark Lane | DE4 4BR |
| Darne Mews | DE6 3GQ |
| Dog Lane | DE6 3EH |
| Eaton Close | DE6 3EX |
| Elms View | DE6 3GZ |
| Field Lane | DE6 3LN |
| Firs Avenue | DE6 3FS |
| Fullwood Grange | DE6 3EZ |
| Gibfield Lane | DE6 3LL |
| Grange Avenue | DE6 3FX |
| Greenway | DE6 3FE |
| Hardings Close | DE6 3JJ |
| Hays Lane | DE6 3LB |
| Highfield Road | DE6 3FD |
| Hillcrest Avenue | DE6 3FW |
| Hob Lane | DE6 3LG |
| Hulland Village | DE6 3EP DE6 3EQ |
| Lumber Lane | DE6 3FQ |
| Magfields Cottages | DE6 3EE |
| Main Road | DE6 3EF |
| Main Street | DE6 3JP DE6 3LD |
| Melville Close | DE6 3FY |
| Millfield Lane | DE6 3JL |
| Millington Green | DE6 3FL |
| Moor Lane | DE6 3JZ |
| Moss Lane | DE6 3FB |
| Peats Close | DE6 3LH |
| Rectory Lane | DE6 3LE |
| Russell Square | DE6 3EA |
| Scout Lane | DE6 3ER |
| Smith Hall Lane | DE6 3ES |
| The Willows | DE6 3EW |
| Townend Cottage | DE6 3JQ |
| Viewdales Close | DE6 3EB |
| Well Close | DE6 3EY |
| Wheeldon Way | DE6 3FZ |
| DE6 3ED DE6 3EG DE6 3FH DE6 3FJ DE6 3FN DE6 3JR DE6 3JU DE6 3JW DE6 3JX DE6 3JY DE6 3ET DE6 3FP DE6 3JS DE6 3JT DE6 3LA |
Transport near Hulland
-
Belper Station
-
Whatstandwell Station
-
Ambergate Station
-
Duffield Station
-
Cromford Station
-
Matlock Bath Station
-
Matlock Station
- FAQ
- Price Paid By Year
- Property Type Price
Frequently asked questions about Hulland
What is the average price for a property for sale in Hulland?
The average price for a property for sale in Hulland is £377,974. This amount is 3% lower than the average price in Ashbourne. There are 240 property listings for sale in Hulland.
What streets have the most expensive properties for sale in Hulland?
The streets with the most expensive properties for sale in Hulland are Main Road at an average of £572,857, Hulland Village at an average of £464,166 and Darne Mews at an average of £425,493.
What streets have the most affordable properties for sale in Hulland?
The streets with the most affordable properties for sale in Hulland are Charles Walker Close at an average of £146,250, Well Close at an average of £225,000 and Eaton Close at an average of £230,000.
Which train stations are available in or near Hulland?
Some of the train stations available in or near Hulland are Belper, Whatstandwell and Ambergate.
Property Price Paid in Hulland by Year
The average sold property price by year was:
| Year | Average Sold Price | Price Change |
Sold Properties
|
|---|---|---|---|
| 2025 | £384,680 | 2% |
18 Properties |
| 2024 | £377,303 | 1% |
22 Properties |
| 2023 | £373,159 | -17% |
22 Properties |
| 2022 | £435,420 | 27% |
25 Properties |
| 2021 | £319,352 | -6% |
44 Properties |
| 2020 | £338,548 | 22% |
36 Properties |
| 2019 | £264,674 | -20% |
36 Properties |
| 2018 | £317,495 | -0,2% |
22 Properties |
| 2017 | £318,249 | 19% |
33 Properties |
| 2016 | £257,891 | -26% |
23 Properties |
| 2015 | £325,558 | 23% |
23 Properties |
| 2014 | £251,190 | -26% |
21 Properties |
| 2013 | £315,384 | 23% |
26 Properties |
| 2012 | £242,164 | -24% |
25 Properties |
| 2011 | £301,414 | 17% |
25 Properties |
| 2010 | £250,768 | -15% |
21 Properties |
| 2009 | £289,053 | 17% |
26 Properties |
| 2008 | £239,929 | -21% |
16 Properties |
| 2007 | £291,326 | 19% |
23 Properties |
| 2006 | £235,658 | 5% |
28 Properties |
| 2005 | £224,539 | -23% |
24 Properties |
| 2004 | £276,746 | 28% |
32 Properties |
| 2003 | £200,025 | -2% |
18 Properties |
| 2002 | £204,248 | 23% |
36 Properties |
| 2001 | £156,643 | 31% |
15 Properties |
| 2000 | £108,015 | -24% |
23 Properties |
| 1999 | £134,013 | 35% |
30 Properties |
| 1998 | £87,576 | -7% |
23 Properties |
| 1997 | £94,006 | 11% |
32 Properties |
| 1996 | £83,500 | 0,1% |
21 Properties |
| 1995 | £83,437 | - |
24 Properties |
Property Price per Property Type in Hulland
Here you can find historic sold price data in order to help with your property search.
The average Property Paid Price for specific property types in the last three years are:
| Property Type | Average Sold Price | Sold Properties |
|---|---|---|
| Semi Detached House | £333,678.00 | 14 Semi Detached Houses |
| Detached House | £398,184.00 | 43 Detached Houses |
| Terraced House | £328,200.00 | 5 Terraced Houses |

