
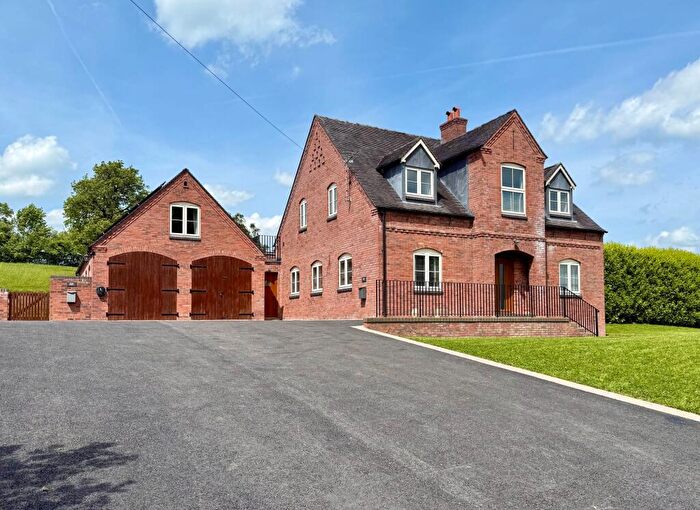
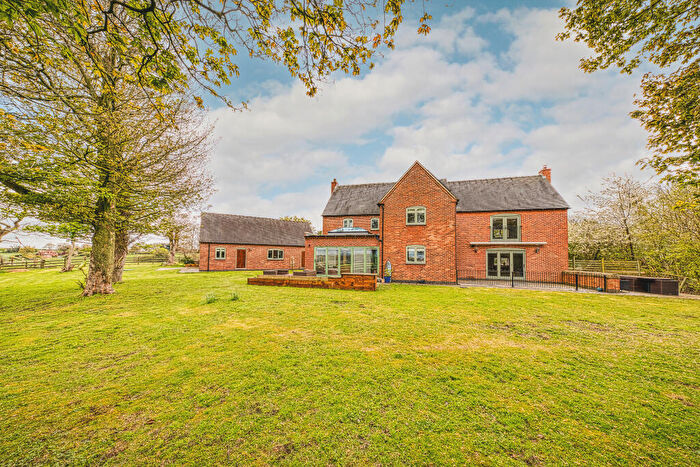
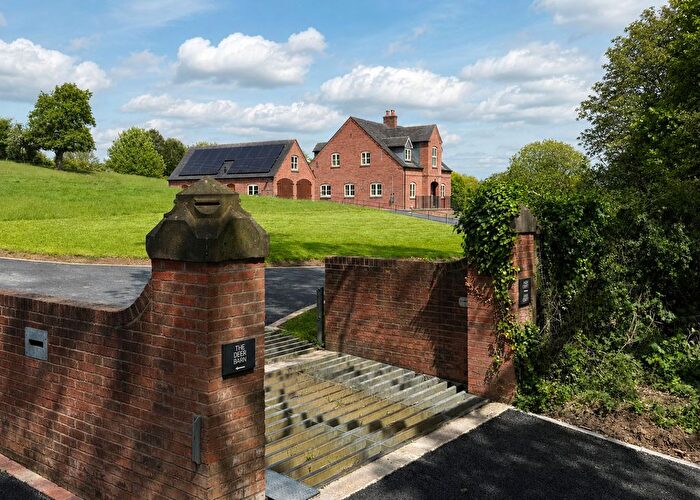
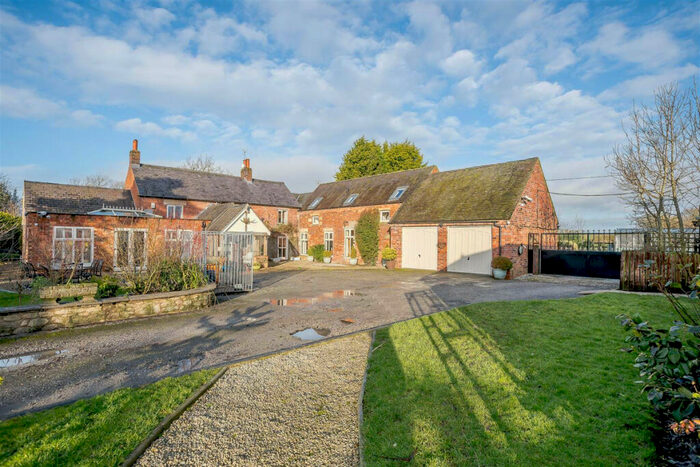
Houses for sale in Hulland, Belper
House Prices in Hulland
Properties in Hulland have an average house price of £327k and had 3 Property Transactions within the last 3 years¹.
Hulland is an area in Belper, Derbyshire with 40 households², where the most expensive property was sold for £612k.
Properties for sale in Hulland
Previously listed properties in Hulland
Roads and Postcodes in Hulland
Navigate through our locations to find the location of your next house in Hulland, Belper for sale or to rent.
| Streets | Postcodes |
|---|---|
| Ashbourne Road | DE56 2LL |
| Bullhill Lane | DE56 2NS |
| Cross O The Hands | DE56 2LT |
| Intakes Lane | DE56 2LU |
| Waterlagg Lane | DE56 2LW |
Property price trends in Hulland
According to the latest Land Registry data, the average home in Hulland sold for £120,000 in 2024. That figure comes from 25 sales logged over the past 29 years.
Prices have fallen back over the last three years. Compared with 2020, when the typical sale came in around £596,500, that's a fall of roughly 79.9%.
Looking back five years, average prices are down about 80.5% since 2018, a drop of around £495,000 in cash terms.
Zoom out to the past decade for the fuller picture. Back in 2014, homes here averaged £250,000, so the typical sold price has fallen about 52% since then, around 7.1% a year lower. Stretch the view to fifteen years and that annual pace edges up closer to -1.4%.
Frequently asked questions about Hulland
What is the average price for a property for sale in Hulland?
The average price for a property for sale in Hulland is £327,166. This amount is 7% higher than the average price in Belper. There are 5 property listings for sale in Hulland.
Which train stations are available in or near Hulland?
Some of the train stations available in or near Hulland are Belper, Duffield and Ambergate.
Property Price Paid in Hulland by Year
The average sold property price by year was:
| Year | Average Sold Price | Price Change |
Sold Properties
|
|---|---|---|---|
| 2024 | £120,000 | -259% |
1 Property |
| 2023 | £430,750 | -20% |
2 Properties |
| 2022 | £517,500 | -15% |
2 Properties |
| 2020 | £596,500 | -3% |
2 Properties |
| 2018 | £615,000 | 30% |
2 Properties |
| 2017 | £430,000 | 42% |
1 Property |
| 2014 | £250,000 | -20% |
1 Property |
| 2013 | £300,000 | 50% |
1 Property |
| 2008 | £150,000 | -319% |
1 Property |
| 2006 | £628,000 | 38% |
1 Property |
Property Price per Property Type in Hulland
Here you can find historic sold price data in order to help with your property search.
The average Property Paid Price for specific property types in the last three years are:
| Property Type | Average Sold Price | Sold Properties |
|---|---|---|
| Terraced House | £185,000.00 | 2 Terraced Houses |
| Detached House | £611,500.00 | 1 Detached House |
