Houses for sale & to rent in Hasland, Chesterfield
House Prices in Hasland
Properties in Hasland have an average house price of £191,415.00 and had 247 Property Transactions within the last 3 years¹.
Hasland is an area in Chesterfield, Derbyshire with 2,858 households², where the most expensive property was sold for £560,000.00.
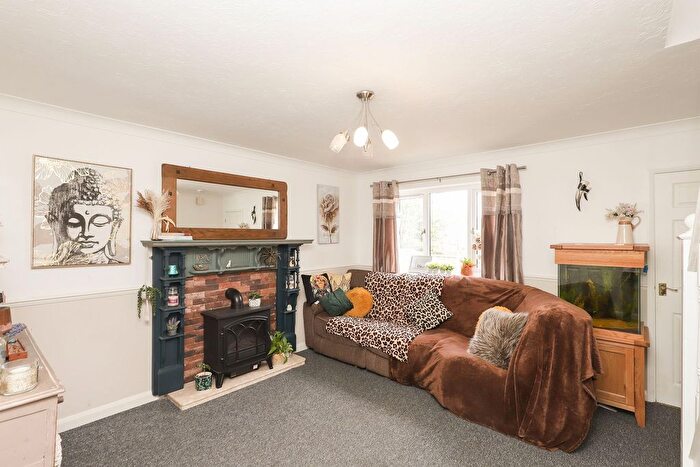
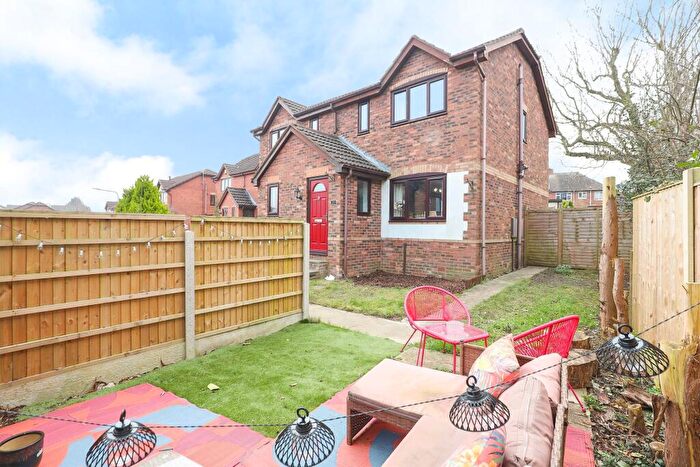
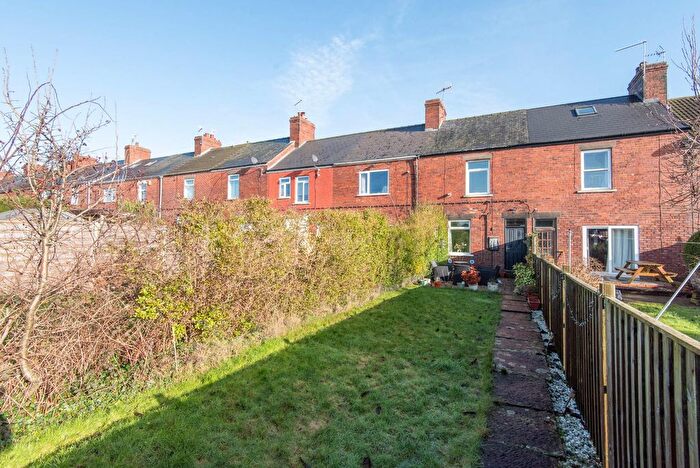
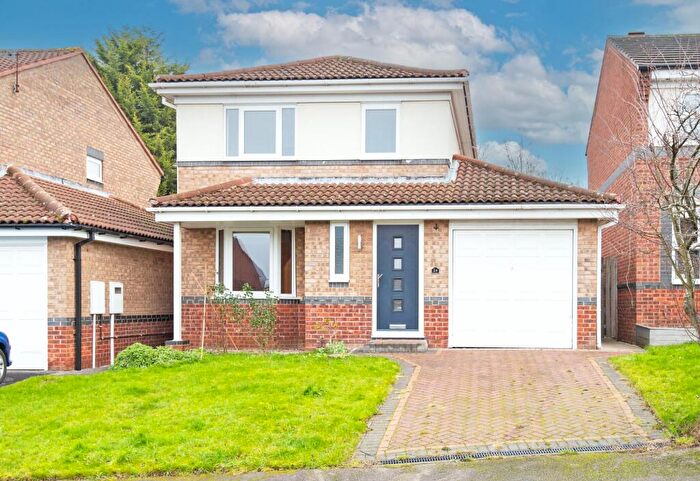
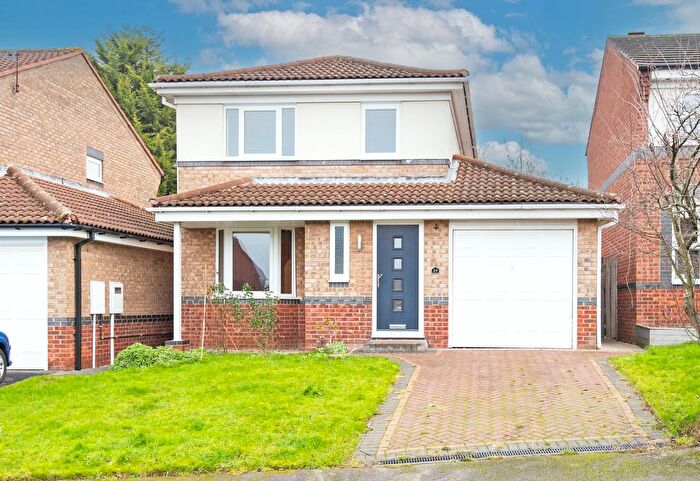
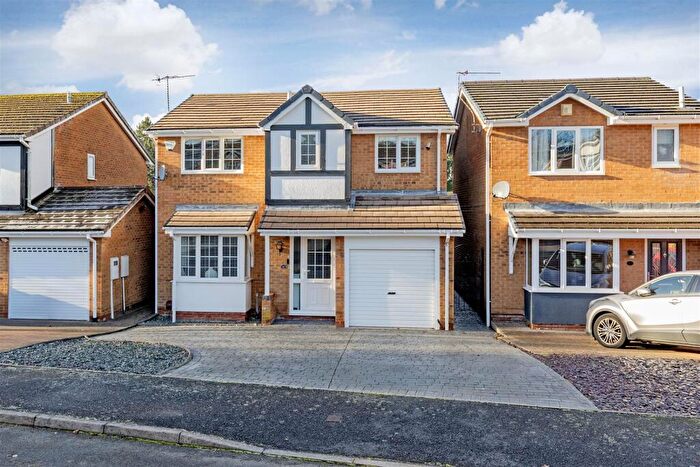
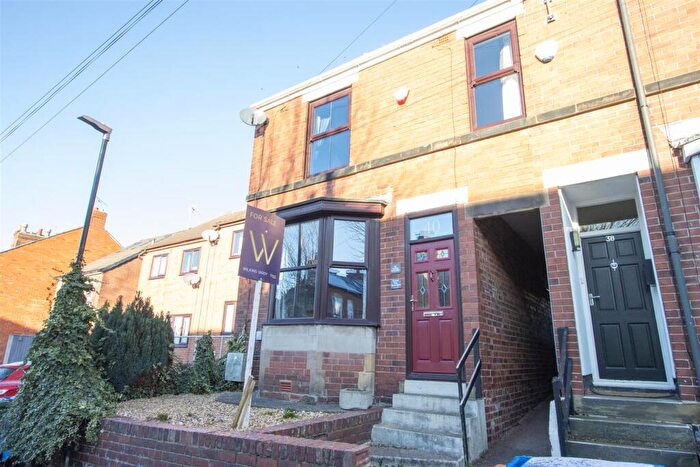
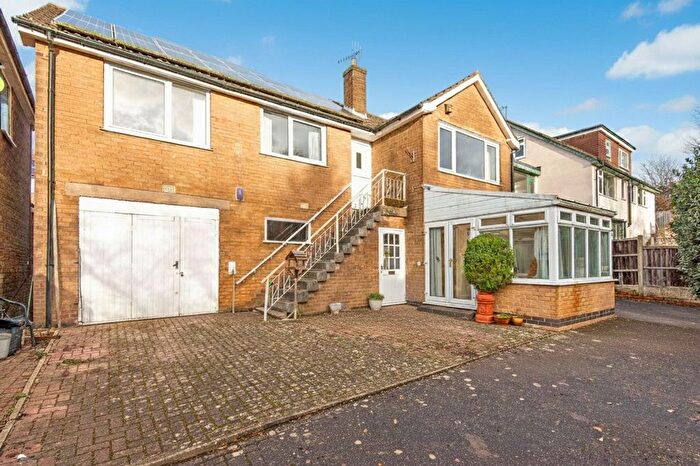
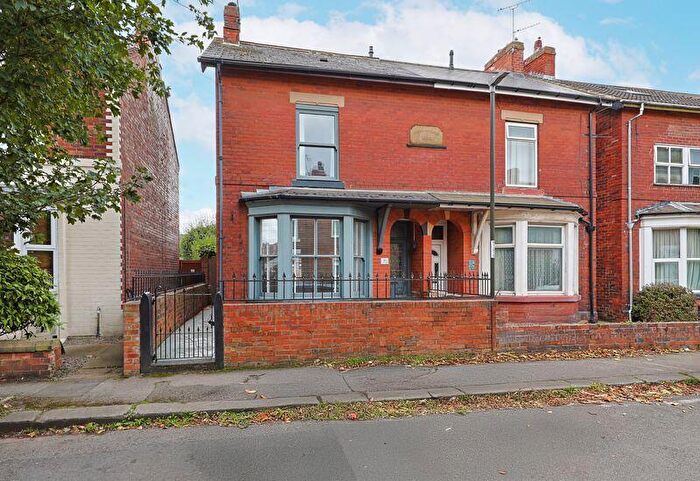
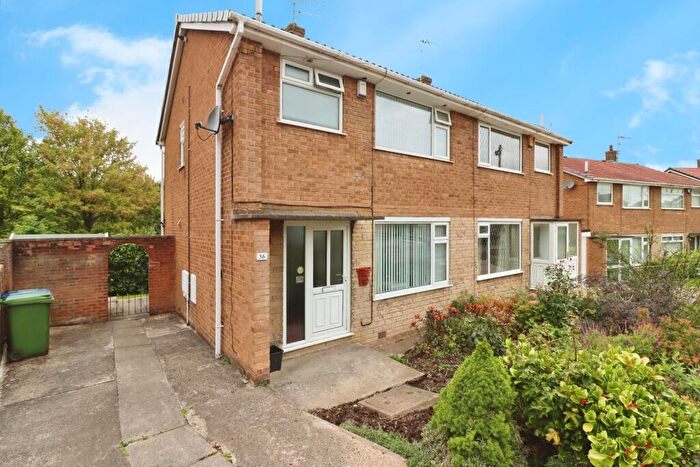
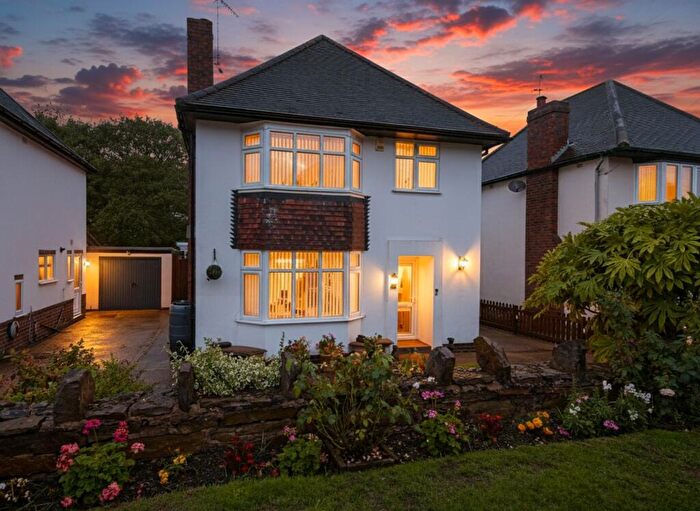
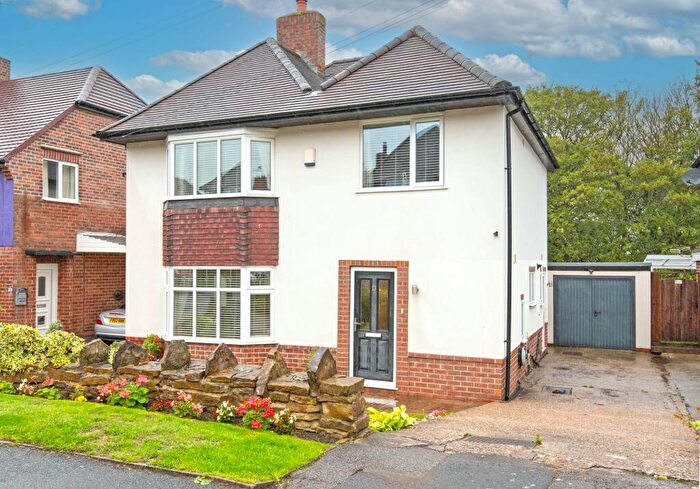
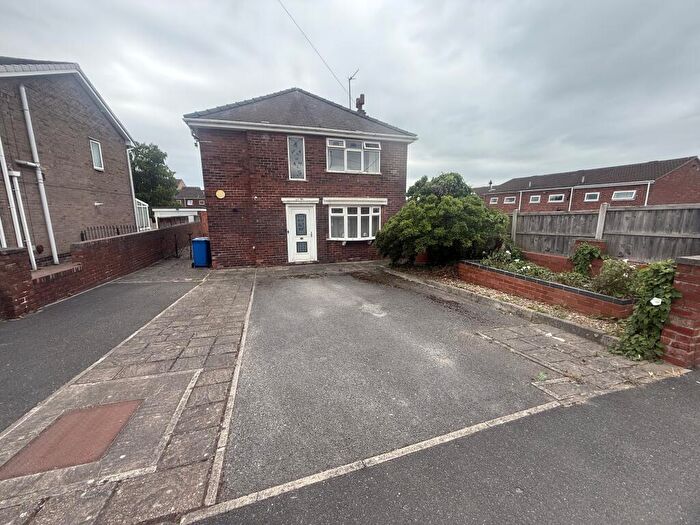
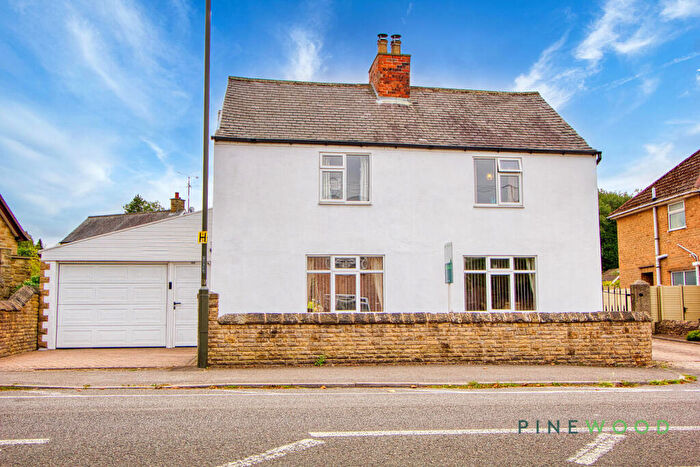
Properties for sale in Hasland
Roads and Postcodes in Hasland
Navigate through our locations to find the location of your next house in Hasland, Chesterfield for sale or to rent.
| Streets | Postcodes |
|---|---|
| Mansfield Road | S41 0AH S41 0JA S41 0JB S41 0JE S41 0JF S41 0JQ |
| Alum Chine Close | S41 0PU |
| Annesley Close | S41 0RQ |
| Arbour Close | S41 0LG |
| Ashfield Road | S41 0AZ |
| Beacon Hill Way | S41 0AF |
| Blackthorn Close | S41 0DY |
| Bradgate Croft | S41 0XZ |
| Branksome Chine Avenue | S41 0PX |
| Britannia Road | S40 2UZ |
| Broomfield Avenue | S41 0LU S41 0LY S41 0ND S41 0NE S41 0NF S41 0LP |
| Burgess Close | S41 0NP |
| Burley Close | S40 2UB |
| Calow Brook Drive | S41 0DR |
| Calow Lane | S41 0AL S41 0AP S41 0AX S41 0BA |
| Chadwell Close | S41 0QB |
| Challands Close | S41 0ET |
| Challands Way | S41 0ER |
| Chapel Lane East | S41 0AJ |
| Collishaw Close | S41 0ES |
| Coppice Close | S41 0LZ S41 0NA |
| Cropston Close | S41 0YD |
| Derby Road | S40 2EP S40 2ER S40 2ET S40 2EX |
| Devonshire Avenue East | S41 0AE |
| Devonshire Road East | S41 0AD |
| Durley Chine Drive | S41 0PT |
| Eastleigh Court | S41 0BH |
| Eastwood Close | S41 0BE |
| Eastwood Park Drive | S41 0BD |
| Eyre Street East | S41 0PE S41 0PF S41 0PG S41 0PQ |
| Farnsworth Court | S41 0NX |
| Farnsworth Street | S41 0PD |
| Fernwood Close | S41 0LF |
| Foxwood Close | S41 0LQ |
| Gorse Valley Road | S41 0LL S41 0JP |
| Gorse Valley Way | S41 0JY |
| Granville Close | S41 0DP |
| Grove Street | S41 0PA |
| Hall Farm Close | S41 0LR |
| Hampton Street | S41 0LH |
| Handby Street | S41 0AT |
| Harcourt Close | S41 0XB |
| Hartfield Close | S41 0NU |
| Hartfield Court | S41 0QE |
| Hasland Road | S41 0AA S41 0AB S41 0AG S41 0AQ S41 0AY S41 0SJ |
| Heathcote Drive | S41 0BB |
| Heather Gardens | S41 0HX |
| Heather Vale Close | S41 0HY |
| Heather Vale Road | S41 0HZ |
| Hillcrest Road | S41 0NB S41 0NR |
| Hollythorpe Close | S41 0DN |
| Hoole Street | S41 0AR |
| Ingleton Road | S41 0NT |
| Jepson Road | S41 0NZ |
| Kent Street | S41 0PJ S41 0PL |
| Kibworth Close | S41 0XA |
| King Street South | S40 2TR |
| Kirby Close | S41 0UY |
| Knighton Close | S41 0XL |
| Lincoln Street | S40 2TW |
| Linden Drive | S41 0NQ |
| Mcgregors Way | S40 2WB |
| Meadow Hill Road | S41 0BG |
| Meakin Street | S41 0AU |
| Mellor Way | S40 2UA |
| Midland Court | S41 0UA |
| Midland Terrace | S41 0PH |
| Nicholas Street | S41 0AS |
| North Terrace | S41 0RD |
| Norwood Avenue | S41 0NH S41 0NJ S41 0NN S41 0NW |
| Norwood Close | S41 0NL |
| Oadby Drive | S41 0YF |
| Park View | S41 0JD S41 0NY |
| Penmore Street | S41 0PB |
| Prestwold Way | S41 0YA |
| Railway Terrace | S41 0RF |
| Ratcliffe Close | S41 0XN |
| Rempstone Drive | S41 0XQ S41 0YB |
| Rothervale Road | S40 2TP |
| Saxton Close | S41 0SL |
| Seagrave Drive | S41 0YE |
| Smithfield Avenue | S41 0PR S41 0PS |
| Southfield Avenue | S41 0LX |
| St Pauls Avenue | S41 0NG |
| Stanier Court | S41 0QG |
| Storforth Lane | S40 2TS S41 0PP S41 0PW S41 0PZ S40 2TU |
| Swithland Close | S41 0XY |
| Talbot Crescent | S41 0AW |
| Talbot Street | S41 0AN |
| The Green | S41 0JT S41 0JU S41 0LJ S41 0LN S41 0LW |
| The Green Mews | S41 0FA |
| Traffic Terrace | S41 0RE |
| Turnoaks Lane | S40 2HA |
| Valley View Close | S41 0LE |
| Vanguard Trading Estate | S40 2TZ |
| Waltham Croft | S41 0UZ |
| Warwick Street Industrial Estate | S40 2TT |
| Whippet Way | S41 0UR |
| Windsor Walk | S41 0BQ |
| Wiston Way | S41 0XJ |
| Woodstock Rise | S41 0HT |
| York Street | S41 0PN |
Transport near Hasland
-
Chesterfield Station
-
Dronfield Station
-
Matlock Station
-
Langwith Station
-
Alfreton Station
-
Dore and Totley Station
-
Creswell (Derbys) Station
-
Shirebrook (Derbys) Station
-
Matlock Bath Station
-
Cromford Station
- FAQ
- Price Paid By Year
- Property Type Price
Frequently asked questions about Hasland
What is the average price for a property for sale in Hasland?
The average price for a property for sale in Hasland is £191,415. This amount is 10% lower than the average price in Chesterfield. There are 530 property listings for sale in Hasland.
What streets have the most expensive properties for sale in Hasland?
The streets with the most expensive properties for sale in Hasland are Whippet Way at an average of £376,663, Seagrave Drive at an average of £363,750 and Saxton Close at an average of £360,000.
What streets have the most affordable properties for sale in Hasland?
The streets with the most affordable properties for sale in Hasland are Handby Street at an average of £100,666, Derby Road at an average of £106,332 and Meakin Street at an average of £107,714.
Which train stations are available in or near Hasland?
Some of the train stations available in or near Hasland are Chesterfield, Dronfield and Matlock.
Property Price Paid in Hasland by Year
The average sold property price by year was:
| Year | Average Sold Price | Price Change |
Sold Properties
|
|---|---|---|---|
| 2025 | £172,534 | -16% |
72 Properties |
| 2024 | £200,342 | 1% |
81 Properties |
| 2023 | £198,184 | -12% |
94 Properties |
| 2022 | £221,275 | 11% |
105 Properties |
| 2021 | £197,022 | 12% |
126 Properties |
| 2020 | £172,696 | 2% |
106 Properties |
| 2019 | £168,626 | 3% |
116 Properties |
| 2018 | £163,495 | -3% |
106 Properties |
| 2017 | £168,523 | 8% |
103 Properties |
| 2016 | £154,527 | 6% |
99 Properties |
| 2015 | £145,751 | 6% |
90 Properties |
| 2014 | £136,531 | -13% |
104 Properties |
| 2013 | £153,972 | 14% |
83 Properties |
| 2012 | £132,251 | 5% |
76 Properties |
| 2011 | £126,117 | -7% |
77 Properties |
| 2010 | £135,514 | 3% |
93 Properties |
| 2009 | £131,954 | -1% |
73 Properties |
| 2008 | £133,477 | -9% |
64 Properties |
| 2007 | £145,785 | -4% |
166 Properties |
| 2006 | £151,407 | 14% |
194 Properties |
| 2005 | £129,685 | 1% |
113 Properties |
| 2004 | £128,648 | 26% |
193 Properties |
| 2003 | £94,920 | 17% |
155 Properties |
| 2002 | £78,670 | 8% |
173 Properties |
| 2001 | £72,009 | 20% |
198 Properties |
| 2000 | £57,507 | 19% |
136 Properties |
| 1999 | £46,502 | -6% |
113 Properties |
| 1998 | £49,514 | 15% |
102 Properties |
| 1997 | £41,858 | 1% |
88 Properties |
| 1996 | £41,620 | 1% |
118 Properties |
| 1995 | £41,078 | - |
89 Properties |
Property Price per Property Type in Hasland
Here you can find historic sold price data in order to help with your property search.
The average Property Paid Price for specific property types in the last three years are:
| Property Type | Average Sold Price | Sold Properties |
|---|---|---|
| Semi Detached House | £185,920.00 | 96 Semi Detached Houses |
| Detached House | £302,760.00 | 54 Detached Houses |
| Terraced House | £134,127.00 | 91 Terraced Houses |
| Flat | £146,083.00 | 6 Flats |

