
Houses for sale in Chesterfield, Derbyshire
House Prices in Chesterfield
Properties in Chesterfield have an average house price of £213k and had 7,818 Property Transactions within the last 3 years.¹
Chesterfield is an area in Derbyshire with 78,414 households², where the most expensive property was sold for £1.75M.
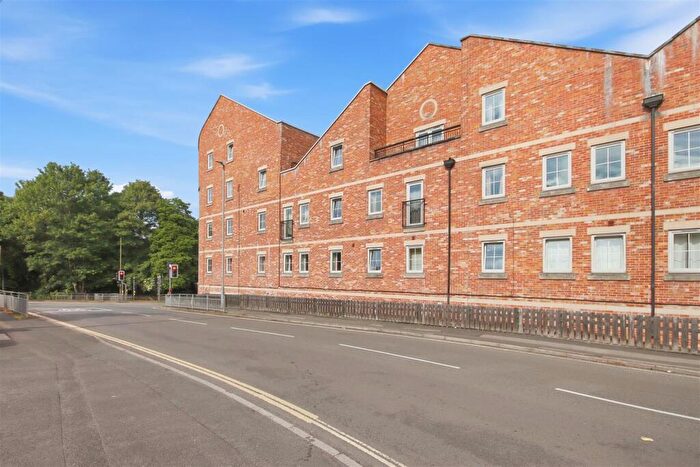
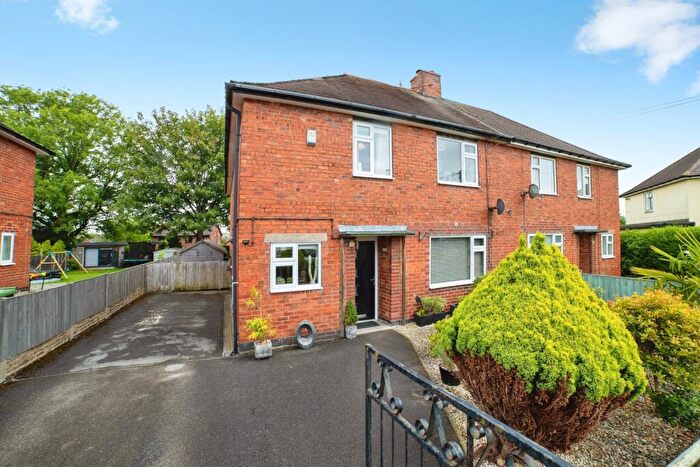
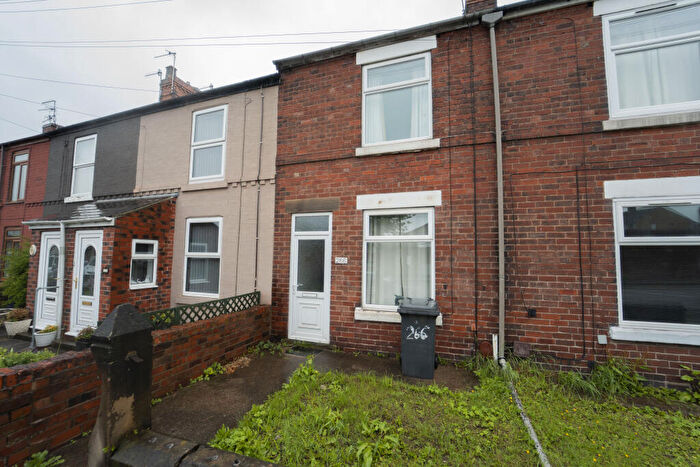
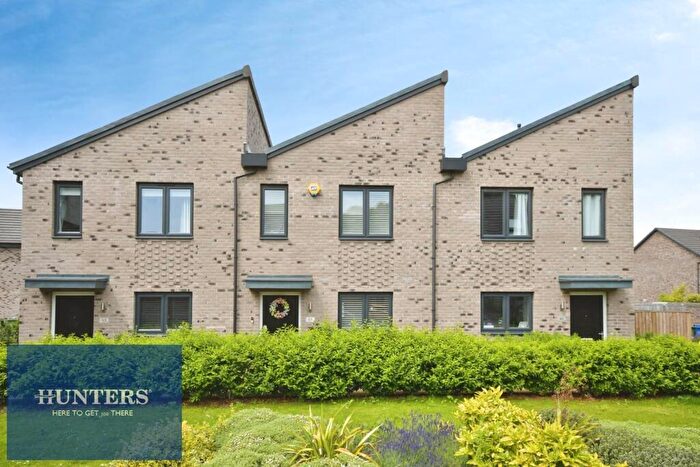
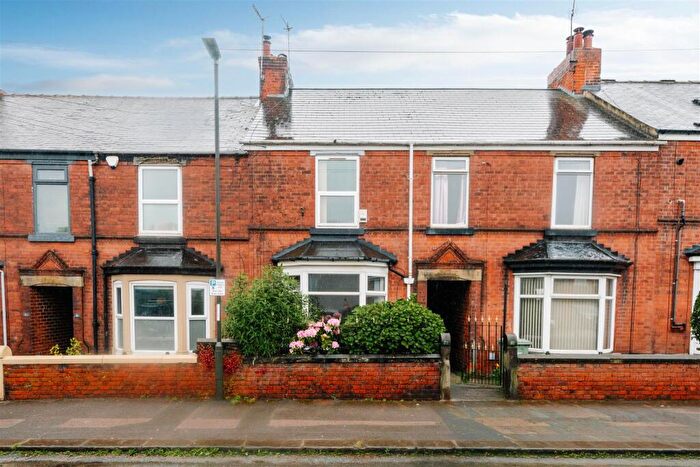
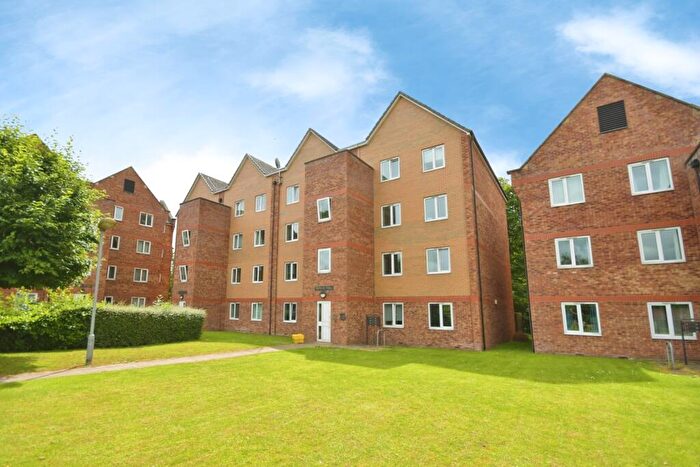
Properties for sale in Chesterfield
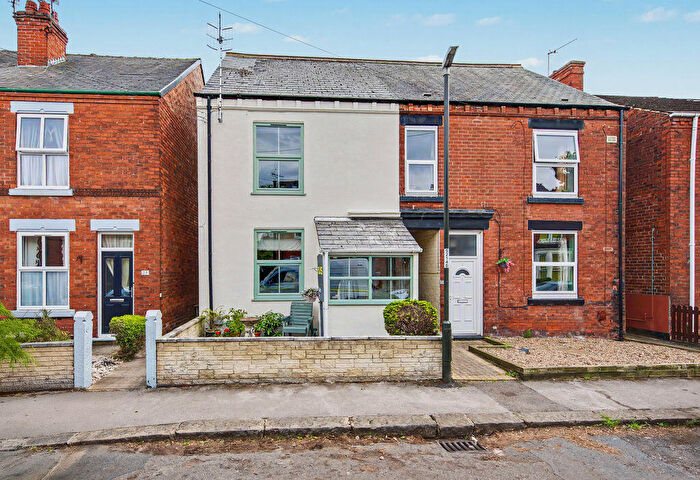
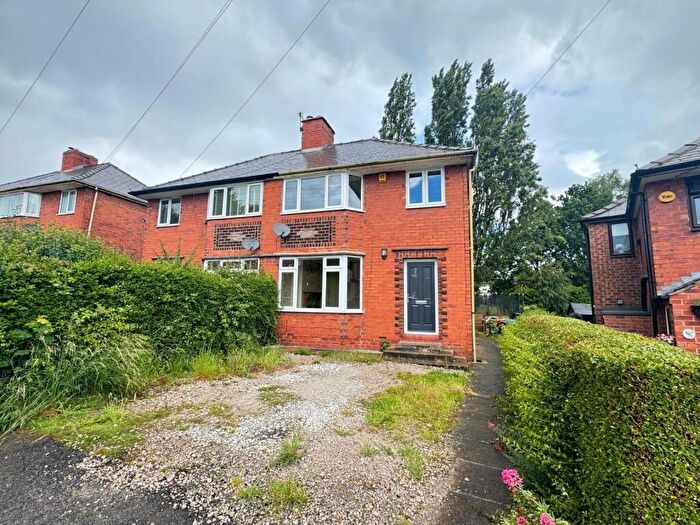
![]()
If you are looking to sell your house, let it out, or receive a property valuation, an expert can help you.
Click the button below to get started.


Neighbourhoods in Chesterfield
Navigate through our locations to find the location of your next house in Chesterfield, Derbyshire for sale or to rent.
- Ashover
- Barlborough
- Barrow Hill And New Whittington
- Bolsover North West
- Bolsover South
- Bolsover West
- Brampton And Walton
- Brimington North
- Brimington South
- Brockwell
- Chatsworth
- Clay Cross North
- Clay Cross South
- Clowne North
- Clowne South
- Dunston
- Eckington South
- Grassmoor
- Hasland
- Hollingwood And Inkersall
- Holmebrook
- Holmewood And Heath
- Linacre
- Loundsley Green
- Lowgates And Woodthorpe
- Middlecroft And Poolsbrook
- Moor
- North Wingfield Central
- Old Whittington
- Pilsley And Morton
- Pleasley
- Rother
- Scarcliffe
- St Helens
- St Leonards
- Sutton
- Tibshelf
- Tupton
- Walton
- West
- Wingerworth
- Holmewood & Heath
- Brampton & Walton
- Clowne East
- Clowne West
- Ault Hucknall
- Bolsover North & Shuttlewood
- Bolsover East
- Pilsley & Morton
- Spire
- Brampton East & Boythorpe
- Brampton West & Loundsley Green
- Whittington Moor
- Whittington
- Staveley North
- Staveley Central
- Staveley South
Property price trends in Chesterfield
According to the latest Land Registry data, the average home in Chesterfield sold for £202,956 in 2026. That figure comes from a substantial record of 86,970 sales logged over the past 31 years.
Prices have softened over the last three years. Compared with 2023, when the typical sale came in around £210,531, that's a fall of roughly 3.6%.
Looking back five years, average prices are down about 2.7% since 2021, a drop of around £5,547 in cash terms.
Zoom out to the past decade for the fuller picture. Back in 2016, homes here averaged £159,840, so the typical sold price has climbed about 27% since then, roughly 2.4% a year. Stretch the view to fifteen years and that annual pace edges up closer to 2.6%.
Frequently asked questions about Chesterfield
What is the average price for a property for sale in Chesterfield?
The average price for a property for sale in Chesterfield is £212,916. This amount is 16% lower than the average price in Derbyshire. There are more than 10,000 property listings for sale in Chesterfield.
What locations have the most expensive properties for sale in Chesterfield?
The locations with the most expensive properties for sale in Chesterfield are Ashover at an average of £546,572, Brampton & Walton at an average of £488,534 and Brampton And Walton at an average of £445,634.
What locations have the most affordable properties for sale in Chesterfield?
The locations with the most affordable properties for sale in Chesterfield are Clowne North at an average of £142,921, Brimington North at an average of £145,662 and Bolsover North West at an average of £146,317.
Which train stations are available in or near Chesterfield?
Some of the train stations available in or near Chesterfield are Chesterfield, Dronfield and Langwith.
Property Price Paid in Chesterfield by Year
The average sold property price by year was:
| Year | Average Sold Price | Price Change |
Sold Properties
|
|---|---|---|---|
| 2026 | £202,956 | -7% |
199 Properties |
| 2025 | £217,194 | 2% |
2,517 Properties |
| 2024 | £211,822 | 1% |
2,620 Properties |
| 2023 | £210,531 | -3% |
2,482 Properties |
| 2022 | £215,848 | 3% |
2,956 Properties |
| 2021 | £208,503 | 7% |
3,759 Properties |
| 2020 | £194,432 | 7% |
2,874 Properties |
| 2019 | £180,464 | 2% |
3,191 Properties |
| 2018 | £176,413 | 3% |
3,088 Properties |
| 2017 | £170,764 | 6% |
3,074 Properties |
Property Price per Property Type in Chesterfield
Here you can find historic sold price data in order to help with your property search.
The average Property Paid Price for specific property types in the last three years are:
| Property Type | Average Sold Price | Sold Properties |
|---|---|---|
| Semi Detached House | £185,476.00 | 3,321 Semi Detached Houses |
| Terraced House | £138,210.00 | 1,928 Terraced Houses |
| Detached House | £331,257.00 | 2,244 Detached Houses |
| Flat | £119,382.00 | 325 Flats |
Transport in Chesterfield
Please see below transportation links in this area:
