
Houses for sale & to rent in Hollingwood And Inkersall, Chesterfield
House Prices in Hollingwood And Inkersall
Properties in Hollingwood And Inkersall have an average house price of £179,714.00 and had 347 Property Transactions within the last 3 years¹.
Hollingwood And Inkersall is an area in Chesterfield, Derbyshire with 3,155 households², where the most expensive property was sold for £370,000.00.
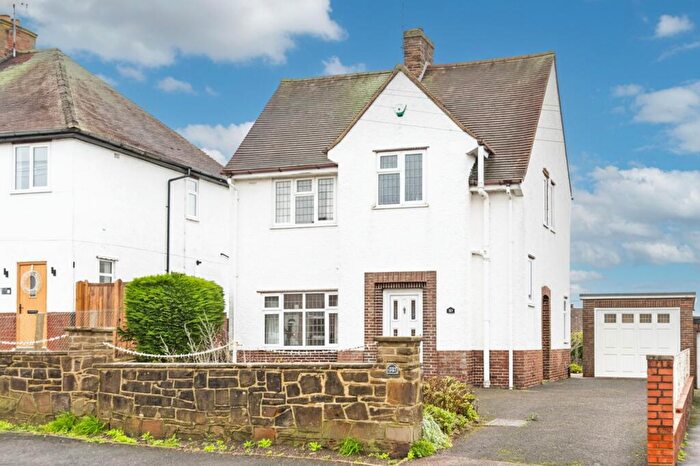
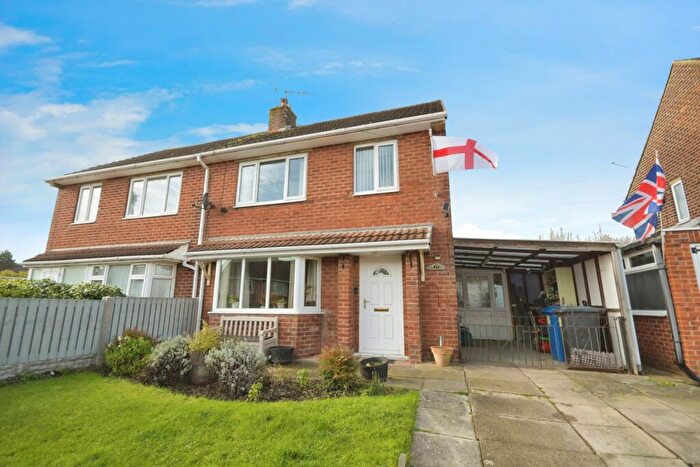
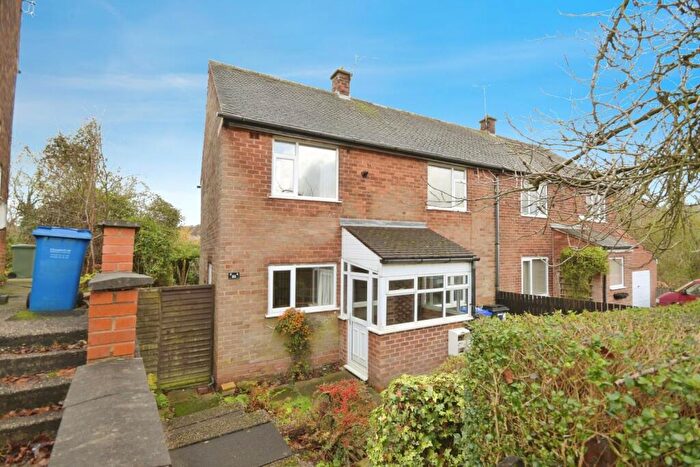
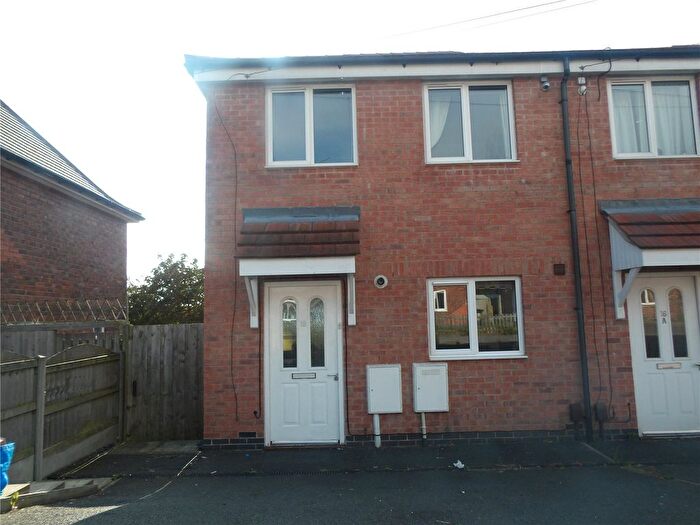
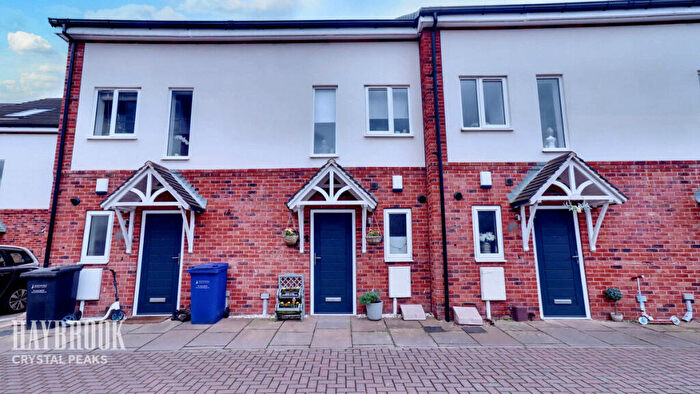
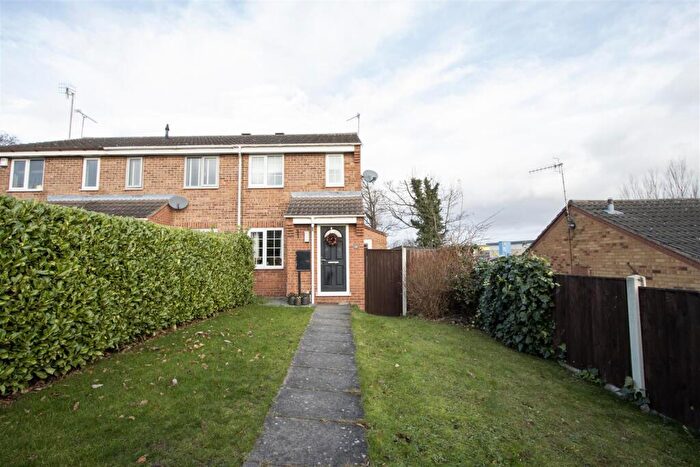
Properties for sale in Hollingwood And Inkersall
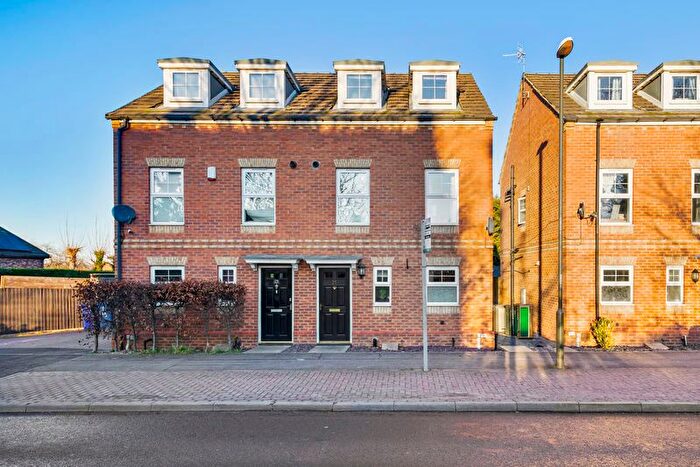


![]()
If you are looking to sell your house, let it out, or receive a property valuation, an expert can help you.
Click the button below to get started.

Roads and Postcodes in Hollingwood And Inkersall
Navigate through our locations to find the location of your next house in Hollingwood And Inkersall, Chesterfield for sale or to rent.
| Streets | Postcodes |
|---|---|
| Acacia Avenue | S43 2JE |
| Alder Gardens | S43 2JU |
| Alpine Grove | S43 2JD |
| Amber Croft | S43 3RS |
| Ashover Road | S43 3EG |
| Attlee Road | S43 3ST |
| Avondale Road | S43 3EQ |
| Bakewell Road | S43 3EE |
| Bamford Road | S43 3DE S43 3DS |
| Bate Wood Avenue | S43 3GD |
| Beech Street | S43 2HN |
| Beeley Close | S43 3EB |
| Beeley Way | S43 3ED |
| Bevan Drive | S43 3HE S43 3HF |
| Birch Lane | S43 2JZ |
| Blue Bell Close | S43 3GE |
| Blue Lodge Close | S43 3GF |
| Blueberry Close | S43 3GG |
| Bondfield Road | S43 3SF |
| Booker Close | S43 3WA |
| Bradshaw Road | S43 3HJ |
| Bradwell Place | S43 3DG |
| Bramley Close | S43 3GH |
| Castleton Grove | S43 3HU |
| Cedar Street | S43 2LE S43 2LR S43 2LF S43 2NA |
| Chestnut Drive | S43 2LZ |
| Clarendon Road | S43 3EH |
| Clumber Place | S43 3EL |
| Crich Road | S43 3SG S43 3SN |
| Croft View | S43 3EA |
| Curbar Curve | S43 3HP S43 3HX S43 3HZ |
| Dade Avenue | S43 3SQ S43 3SH |
| Damson Croft | S43 2HY |
| Denby Road | S43 3RR |
| Dobson Place | S43 3HW |
| Dovedale Avenue | S43 3HT |
| Duckmanton Road | S44 5EB S44 5ED S44 5HG |
| East Crescent | S44 5ES S44 5ET |
| Elliott Drive | S43 3DP S43 3DR S43 3DZ |
| Elm Street | S43 2HJ S43 2LH S43 2LQ S43 2LW |
| Enterprise Way | S44 5FD |
| Erin Road | S44 5HQ |
| Fir Street | S43 2JQ |
| Froggatt Close | S43 3EP |
| Glenmore Close | S43 3GN |
| Greaves Close | S44 5FB |
| Green Close | S43 3DX |
| Harper Way | S44 5JX |
| Hillman Drive | S43 3SJ S43 3SW |
| Holbrook Place | S43 3RP |
| Hollingwood Crescent | S43 2HD S43 2HE S43 2HF S43 2JR |
| Hornbeam Close | S43 2HU |
| Hucklow Avenue | S43 3EX |
| Ilam Close | S43 3EW |
| Inkersall Green Road | S43 3SE S43 3US |
| Inkersall Road | S43 3YJ S43 3YH |
| Ivywood Gardens | S44 5HJ |
| Jervis Place | S43 3HG |
| Juniper Close | S43 2HX |
| Kinder Road | S43 3HR |
| Laburnum Street | S43 2JJ S43 2JL |
| Lathkill Avenue | S43 3JA |
| Laurel Crescent | S43 2LA S43 2LJ S43 2LS S43 2LT |
| Lilac Street | S43 2JB S43 2JG |
| Lodge Place | S43 3DU |
| Lodge Walk | S43 3DY |
| Madin Drive | S43 3HH |
| Maple Street | S43 2JH |
| Markham Court | S44 5HH |
| Markham Lane | S44 5HN S44 5HS S44 5HY |
| Markham Road | S44 5EP S44 5ER S44 5HP |
| Matlock Drive | S43 3EF |
| Mcmahon Avenue | S43 3HL S43 3HN |
| Middleton Drive | S43 3HS |
| Milford Road | S43 3ET |
| Monsal Crescent | S43 3HY |
| Mulberry Croft | S43 2LY |
| Myrtle Grove | S43 2LL S43 2LN |
| Norfolk Gardens | S43 3WD |
| North Crescent | S44 5EX S44 5EY S44 5EZ |
| North Grove | S44 5HA |
| Oak Street | S43 2HL |
| Peak Place | S43 3JB |
| Pear Tree Close | S43 2LU |
| Pindale Avenue | S43 3EY |
| Pine Street | S43 2LG |
| Poolsbrook Road | S44 5EJ S44 5EL S44 5EN S44 5EW S44 5HB |
| Private Drive | S43 2JF S43 2LB |
| Ravensdale Close | S43 3ES |
| Rectory Road | S44 5EF S44 5EE |
| Redwood Close | S43 2JS |
| Riber Close | S43 3EU |
| Ringwood Road | S43 1DQ |
| Shinwell Avenue | S43 3SX |
| Smith Avenue | S43 3SL |
| South Crescent | S44 5EG S44 5EH S44 5EQ |
| Springwell Park Drive | S43 3GJ |
| Stanley Avenue | S43 3SU S43 3SY |
| Station Road | S43 2HP S43 2HR S43 2HS S43 2HW |
| Steele Avenue | S43 3HQ |
| Summerskill Green | S43 3SR |
| Sutton Crescent | S43 3SP S43 3SS |
| Sycamore Lane | S43 2LD |
| Sycamore Road | S43 2HG S43 2HH S43 2HQ S43 2LP |
| Tansley Way | S43 3DT |
| Thoresby Place | S43 3EJ |
| Tom Lane | S44 5HF |
| Troughbrook Road | S43 2JN S43 2JP S43 2JW |
| Turner Drive | S43 3HD |
| Welbeck Close | S43 3EN |
| West Crescent | S44 5HD S44 5HE |
| West Croft Court | S43 3GB |
| West Croft Drive | S43 3GA |
| Westwood Close | S43 3JE |
| Westwood Drive | S43 3DF |
| Westwood Drive Gardens | S43 3DD |
| Whisperwood Close | S44 5HL |
| Wigley Road | S43 3ER |
| Wilkinson Drive | S43 3SZ |
| Winnat Place | S43 3EZ |
Transport near Hollingwood And Inkersall
-
 Chesterfield Station
 -
Dronfield Station
-
Creswell (Derbys) Station
-
Langwith Station
-
Whitwell (Derbys) Station
-
Kiveton Bridge Station
-
Shirebrook (Derbys) Station
-
Woodhouse Station
-
Kiveton Park Station
-
Dore and Totley Station
- FAQ
- Price Paid By Year
- Property Type Price
Frequently asked questions about Hollingwood And Inkersall
What is the average price for a property for sale in Hollingwood And Inkersall?
The average price for a property for sale in Hollingwood And Inkersall is £179,714. This amount is 16% lower than the average price in Chesterfield. There are 1,169 property listings for sale in Hollingwood And Inkersall.
What streets have the most expensive properties for sale in Hollingwood And Inkersall?
The streets with the most expensive properties for sale in Hollingwood And Inkersall are Rectory Road at an average of £370,000, West Croft Court at an average of £293,750 and Damson Croft at an average of £291,000.
What streets have the most affordable properties for sale in Hollingwood And Inkersall?
The streets with the most affordable properties for sale in Hollingwood And Inkersall are West Crescent at an average of £120,000, Attlee Road at an average of £130,000 and Dobson Place at an average of £135,000.
Which train stations are available in or near Hollingwood And Inkersall?
Some of the train stations available in or near Hollingwood And Inkersall are Chesterfield, Dronfield and Creswell (Derbys).
Property Price Paid in Hollingwood And Inkersall by Year
The average sold property price by year was:
| Year | Average Sold Price | Price Change |
Sold Properties
|
|---|---|---|---|
| 2025 | £179,194 | 2% |
59 Properties |
| 2024 | £174,911 | -4% |
102 Properties |
| 2023 | £181,906 | -1% |
86 Properties |
| 2022 | £183,035 | 9% |
100 Properties |
| 2021 | £166,259 | 6% |
120 Properties |
| 2020 | £157,000 | 14% |
103 Properties |
| 2019 | £135,772 | -6% |
101 Properties |
| 2018 | £143,766 | 4% |
108 Properties |
| 2017 | £137,362 | 7% |
114 Properties |
| 2016 | £128,131 | 5% |
133 Properties |
| 2015 | £122,022 | -2% |
111 Properties |
| 2014 | £124,798 | 3% |
102 Properties |
| 2013 | £121,668 | 16% |
80 Properties |
| 2012 | £102,653 | -10% |
65 Properties |
| 2011 | £112,437 | -6% |
101 Properties |
| 2010 | £119,216 | 7% |
72 Properties |
| 2009 | £111,445 | -15% |
83 Properties |
| 2008 | £127,644 | 0,3% |
84 Properties |
| 2007 | £127,254 | 4% |
144 Properties |
| 2006 | £121,832 | 5% |
171 Properties |
| 2005 | £115,888 | 7% |
131 Properties |
| 2004 | £107,421 | 20% |
150 Properties |
| 2003 | £85,597 | 25% |
184 Properties |
| 2002 | £64,213 | -2% |
138 Properties |
| 2001 | £65,506 | 11% |
154 Properties |
| 2000 | £58,138 | 13% |
129 Properties |
| 1999 | £50,864 | 13% |
164 Properties |
| 1998 | £44,206 | 16% |
112 Properties |
| 1997 | £37,323 | 8% |
71 Properties |
| 1996 | £34,500 | -6% |
63 Properties |
| 1995 | £36,736 | - |
52 Properties |
Property Price per Property Type in Hollingwood And Inkersall
Here you can find historic sold price data in order to help with your property search.
The average Property Paid Price for specific property types in the last three years are:
| Property Type | Average Sold Price | Sold Properties |
|---|---|---|
| Flat | £175,000.00 | 1 Flat |
| Semi Detached House | £169,360.00 | 214 Semi Detached Houses |
| Detached House | £247,474.00 | 59 Detached Houses |
| Terraced House | £155,369.00 | 73 Terraced Houses |