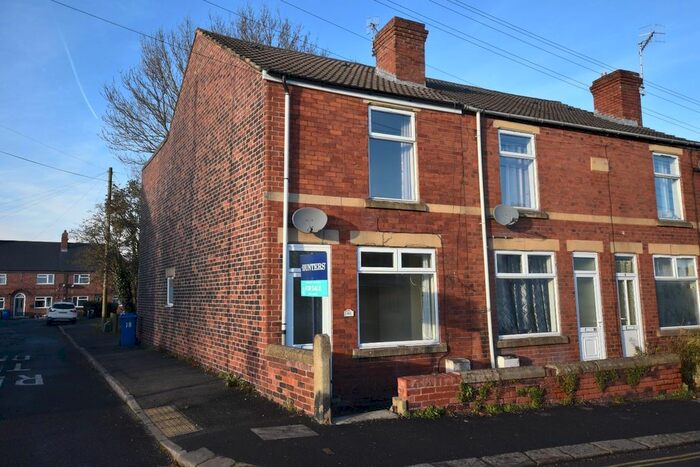
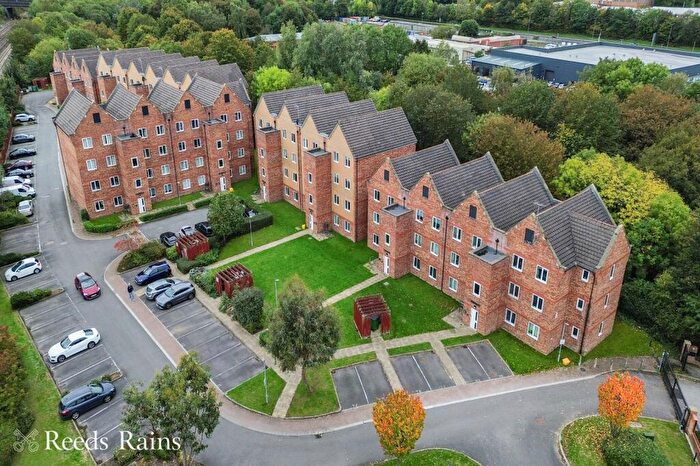
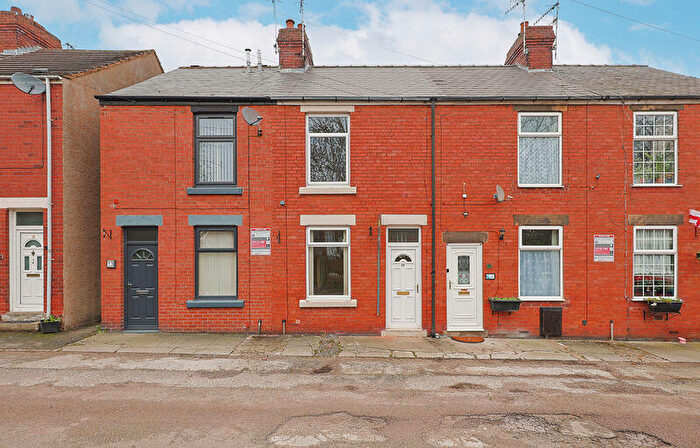
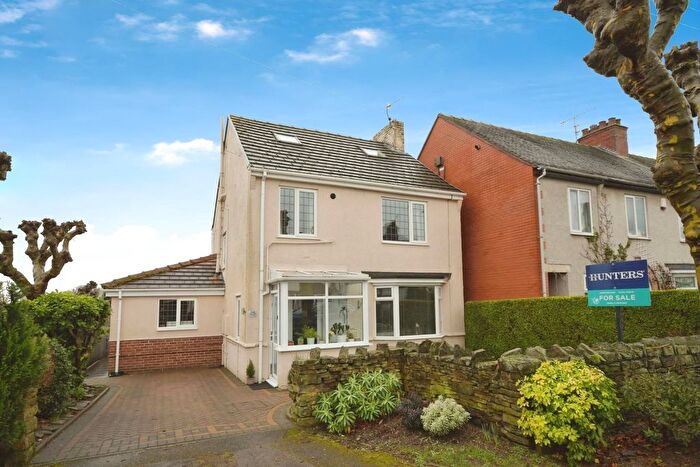
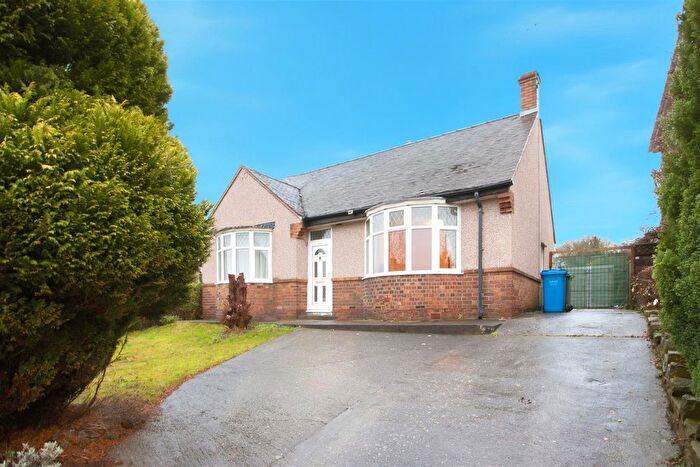
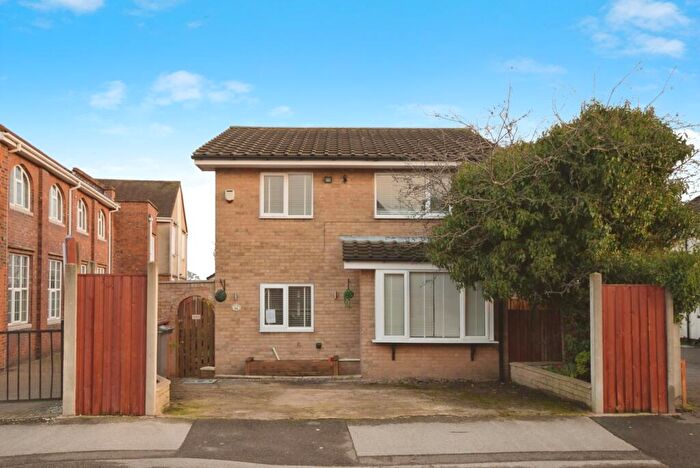
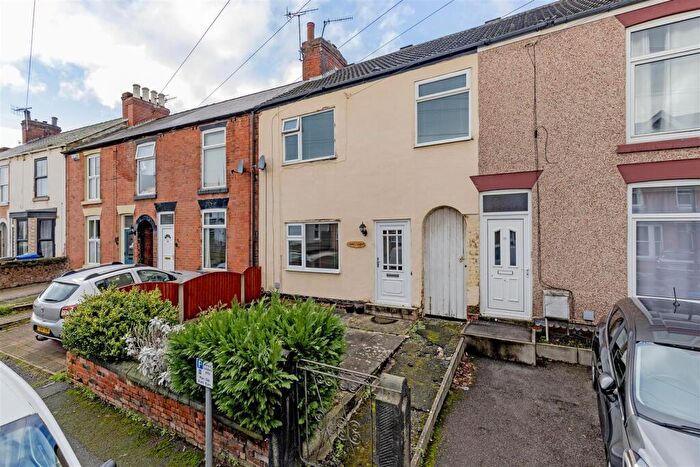
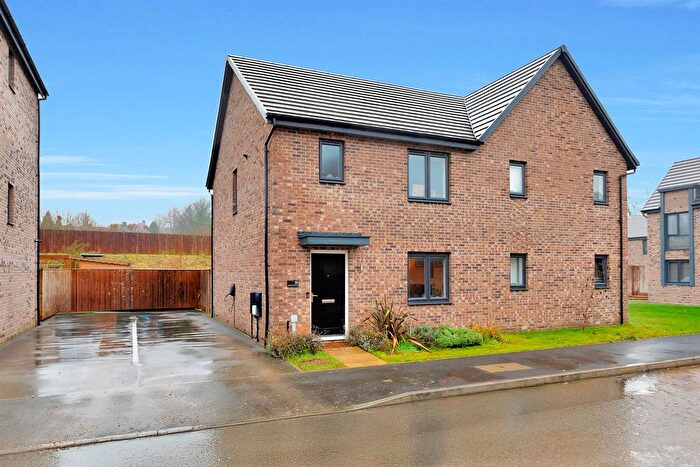
Houses for sale & to rent in Moor, Chesterfield
House Prices in Moor
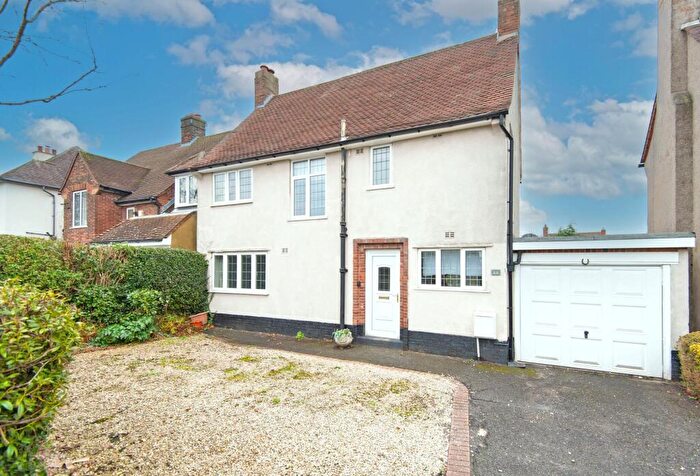
Properties in Moor have an average house price of £167,973.00 and had 203 Property Transactions within the last 3 years¹.
Moor is an area in Chesterfield, Derbyshire with 2,126 households², where the most expensive property was sold for £450,000.00.
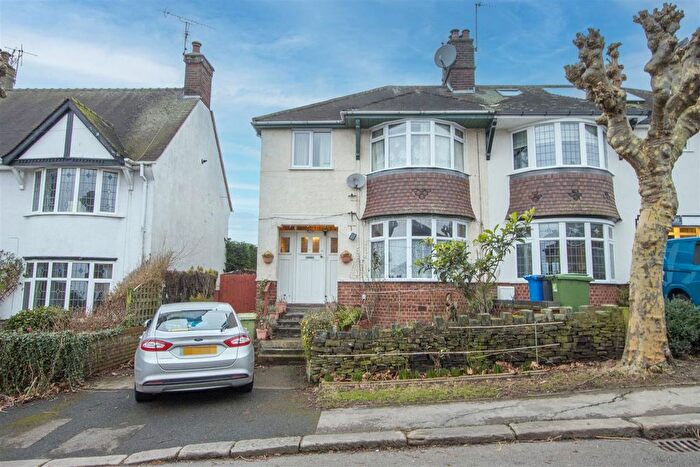
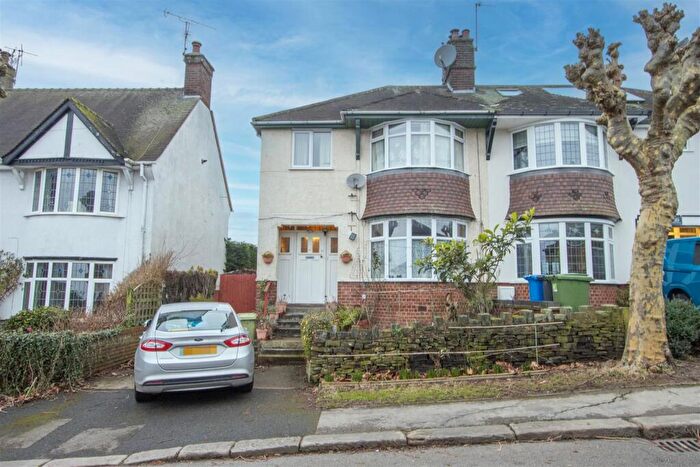
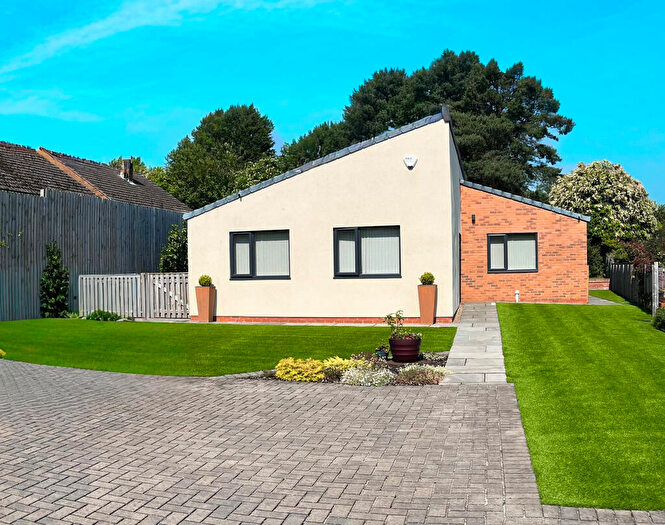
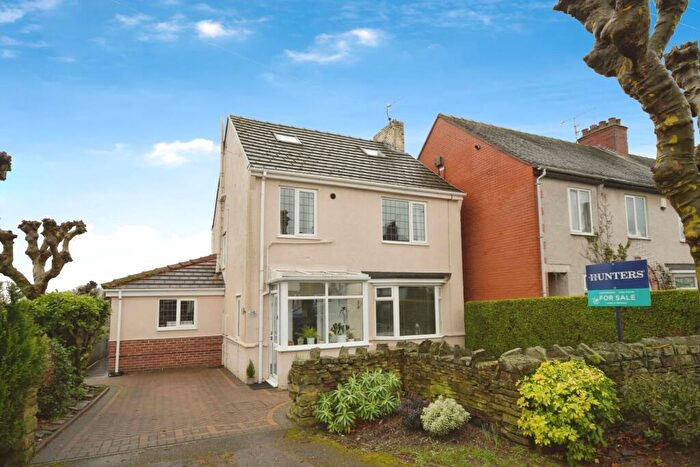
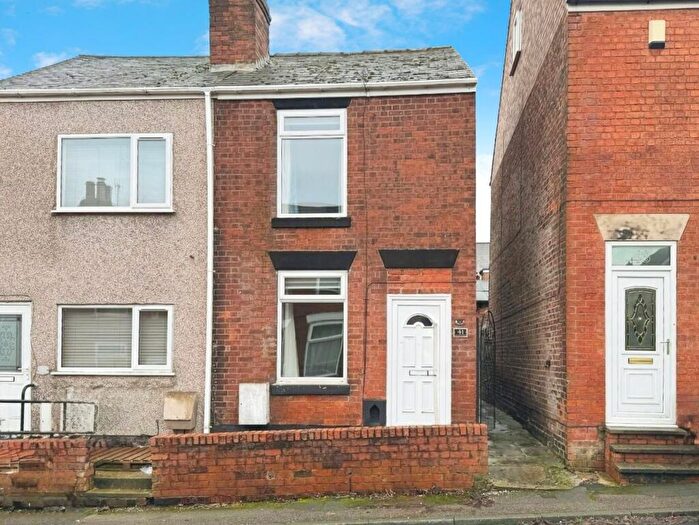
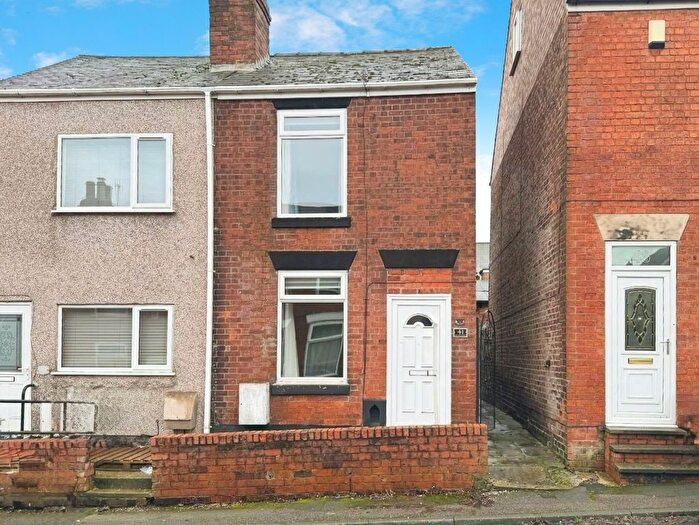
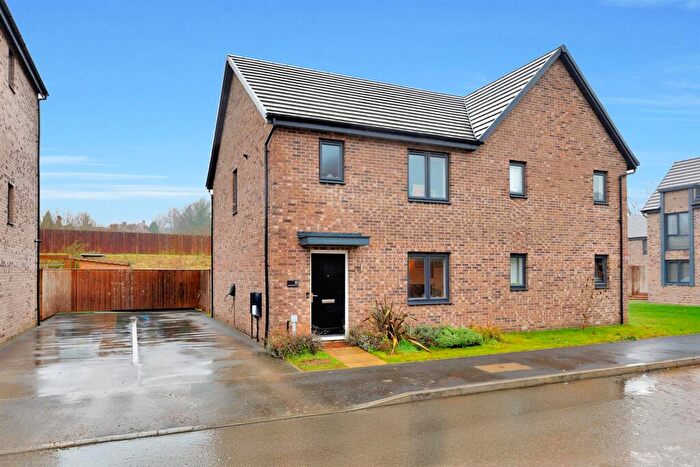
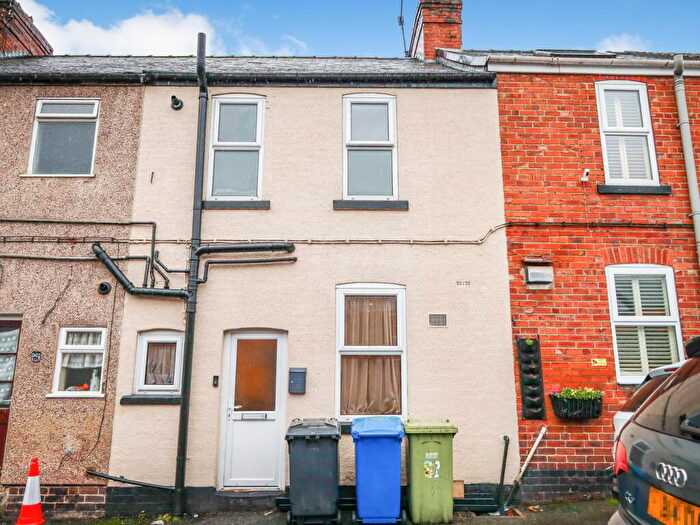
Properties for sale in Moor
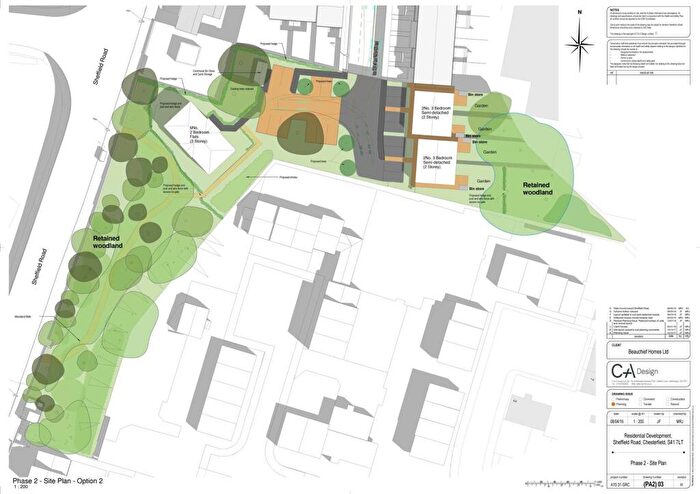
Roads and Postcodes in Moor
Navigate through our locations to find the location of your next house in Moor, Chesterfield for sale or to rent.
| Streets | Postcodes |
|---|---|
| Acres View Close | S41 8BH |
| Allsops Place | S41 8SN |
| Amesbury Close | S41 8PJ |
| Blandford Drive | S41 8QT |
| Chantrey Avenue | S41 7DJ S41 7DN |
| Cranborne Road | S41 8PF S41 8PG |
| Dukes Drive | S41 8QB S41 8QE S41 8QG |
| Elm Close | S41 8SL |
| Elm Lodge Farm Close | S41 8SY |
| Flamsteed Crescent | S41 7DX S41 7EA S41 7DS S41 7DY S41 7DZ S41 7EB |
| Foundry Street | S41 9AU S41 9AX |
| Glenfield Crescent | S41 8SF |
| Greenside Avenue | S41 8RZ S41 8SD |
| Grove Road | S41 8LN |
| Highfield Lane | S41 8AU S41 8AY S41 8BA |
| Holme Road | S41 7JF |
| James Street | S41 7JE |
| King Street North | S41 9BA |
| Lansdowne Avenue | S41 8PL S41 8QD |
| Littlemoor | S41 8QP |
| Littlemoor Centre | S41 8QW |
| Lockoford Lane | S41 7JA S41 7HY S41 7HZ S41 7JB S41 7JJ S41 7JL |
| Lockoford Road | S41 7EW |
| Ludham Close | S41 8SB |
| Ludham Gardens | S41 8SP |
| Nelson Street | S41 8RP S41 8RT |
| Newbold Village | S41 8RJ |
| Occupation Road | S41 8TH |
| Old Brick Works Lane | S41 7JD |
| Ormsby Road | S41 8SA |
| Park Lane | S41 8SQ |
| Park Side | S41 8SR |
| Pevensey Avenue | S41 8QF |
| Peveril Road | S41 8RW S41 8RX S41 8RY S41 8SG S41 8SH |
| Pottery Lane West | S41 9BN |
| Racecourse Road | S41 8TN |
| Ringwood Avenue | S41 8QR S41 8QS S41 8QZ S41 8RA S41 8RB |
| Salisbury Avenue | S41 8PH S41 8PN S41 8PQ S41 8PR |
| Salisbury Crescent | S41 8PP S41 8PW |
| Sanforth Street | S41 8RS S41 8RU |
| School Road | S41 8LJ |
| Shaw Street | S41 9AY |
| Sheffield Road | S41 7JQ S41 8LE S41 8LL S41 8LP S41 8LQ S41 8LS S41 8LW S41 8JZ S41 8LF S41 8NZ |
| St Chads Way | S41 8RN |
| St Johns Road | S41 8PD S41 8PE S41 8PU S41 8NX S41 8PA S41 8PB |
| Stand Park | S41 8JT |
| Stand Road | S41 8ST S41 8SW S41 8SJ |
| Sub Station Lane | S41 8LG |
| Tapton Lock Hill | S41 7GD S41 7GE S41 7GF S41 7GG S41 7GH S41 7NJ |
| Thorndene Close | S41 8SE |
| Whitworth Road | S41 7DL |
| William Street | S41 7JG |
| Wimborne Crescent | S41 8PS S41 8PT |
| Winchester Road | S41 8QU S41 8QX S41 8QY |
Transport near Moor
-
Chesterfield Station
-
Dronfield Station
-
Dore and Totley Station
-
Woodhouse Station
-
Sheffield Station
-
Grindleford Station
-
Creswell (Derbys) Station
-
Darnall Station
-
Kiveton Bridge Station
-
Langwith Station
- FAQ
- Price Paid By Year
- Property Type Price
Frequently asked questions about Moor
What is the average price for a property for sale in Moor?
The average price for a property for sale in Moor is £167,973. This amount is 21% lower than the average price in Chesterfield. There are 855 property listings for sale in Moor.
What streets have the most expensive properties for sale in Moor?
The streets with the most expensive properties for sale in Moor are St Chads Way at an average of £311,666, Dukes Drive at an average of £304,636 and Lansdowne Avenue at an average of £276,000.
What streets have the most affordable properties for sale in Moor?
The streets with the most affordable properties for sale in Moor are Occupation Road at an average of £70,250, Sheffield Road at an average of £98,800 and Nelson Street at an average of £107,616.
Which train stations are available in or near Moor?
Some of the train stations available in or near Moor are Chesterfield, Dronfield and Dore and Totley.
Property Price Paid in Moor by Year
The average sold property price by year was:
| Year | Average Sold Price | Price Change |
Sold Properties
|
|---|---|---|---|
| 2025 | £156,888 | -14% |
58 Properties |
| 2024 | £178,225 | 7% |
77 Properties |
| 2023 | £165,817 | -0,1% |
68 Properties |
| 2022 | £165,943 | -1% |
61 Properties |
| 2021 | £167,245 | 9% |
81 Properties |
| 2020 | £152,668 | 0,5% |
59 Properties |
| 2019 | £151,950 | 16% |
76 Properties |
| 2018 | £127,136 | -9% |
65 Properties |
| 2017 | £138,273 | 3% |
65 Properties |
| 2016 | £134,160 | 8% |
67 Properties |
| 2015 | £122,986 | 8% |
66 Properties |
| 2014 | £112,713 | -3% |
74 Properties |
| 2013 | £116,632 | 8% |
63 Properties |
| 2012 | £107,378 | 4% |
46 Properties |
| 2011 | £103,593 | -9% |
43 Properties |
| 2010 | £112,947 | 8% |
36 Properties |
| 2009 | £103,751 | -10% |
38 Properties |
| 2008 | £113,720 | -17% |
29 Properties |
| 2007 | £132,519 | 10% |
87 Properties |
| 2006 | £119,052 | -12% |
90 Properties |
| 2005 | £132,915 | 14% |
164 Properties |
| 2004 | £113,818 | 32% |
95 Properties |
| 2003 | £77,480 | 28% |
98 Properties |
| 2002 | £55,895 | 16% |
83 Properties |
| 2001 | £47,076 | 13% |
71 Properties |
| 2000 | £40,827 | -6% |
69 Properties |
| 1999 | £43,326 | 10% |
77 Properties |
| 1998 | £39,207 | 2% |
64 Properties |
| 1997 | £38,228 | 1% |
61 Properties |
| 1996 | £37,959 | 12% |
57 Properties |
| 1995 | £33,269 | - |
51 Properties |
Property Price per Property Type in Moor
Here you can find historic sold price data in order to help with your property search.
The average Property Paid Price for specific property types in the last three years are:
| Property Type | Average Sold Price | Sold Properties |
|---|---|---|
| Semi Detached House | £194,238.00 | 92 Semi Detached Houses |
| Detached House | £274,738.00 | 21 Detached Houses |
| Terraced House | £116,876.00 | 66 Terraced Houses |
| Flat | £114,385.00 | 24 Flats |

