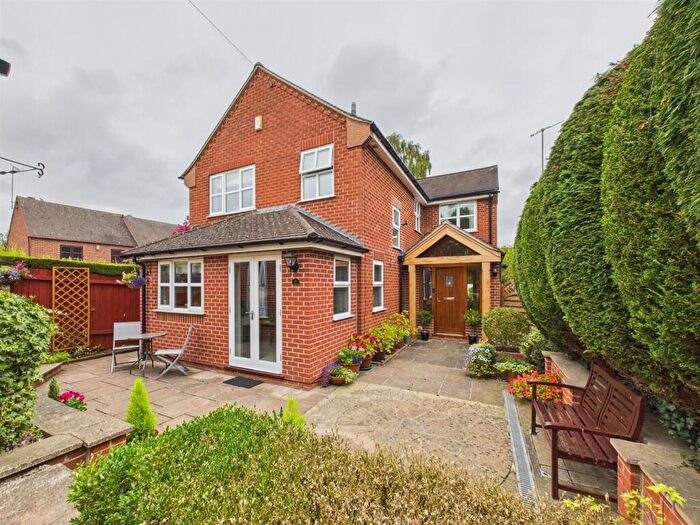
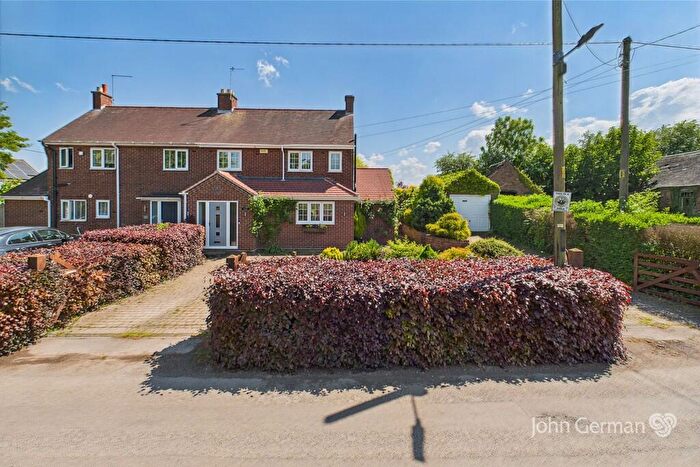
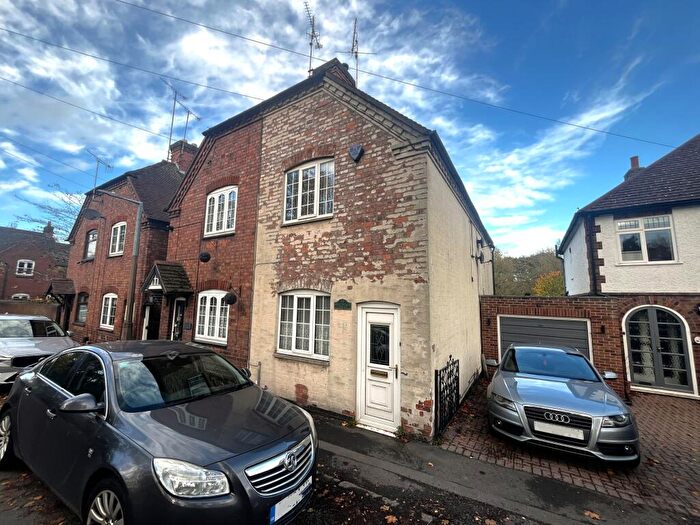
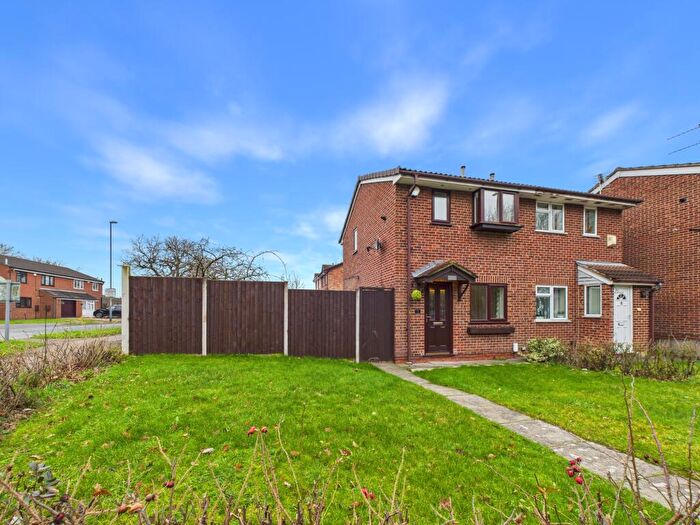
Houses for sale & to rent in Repton, Derby
House Prices in Repton
Properties in Repton have an average house price of £456,533.00 and had 118 Property Transactions within the last 3 years¹.
Repton is an area in Derby, Derbyshire with 1,386 households², where the most expensive property was sold for £1,650,000.00.
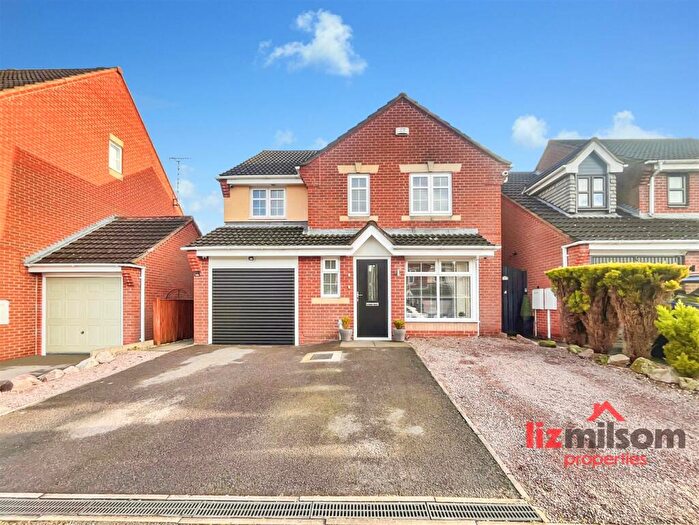
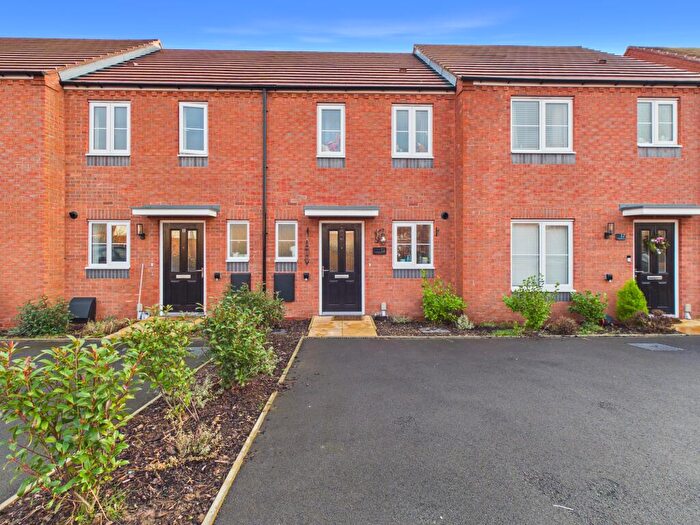
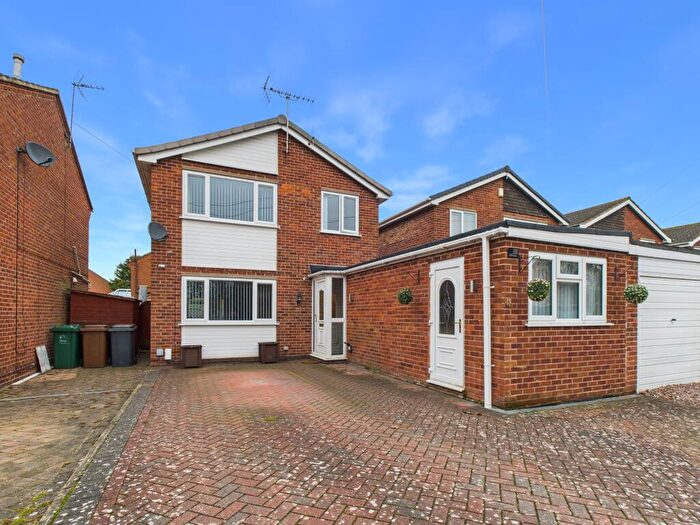
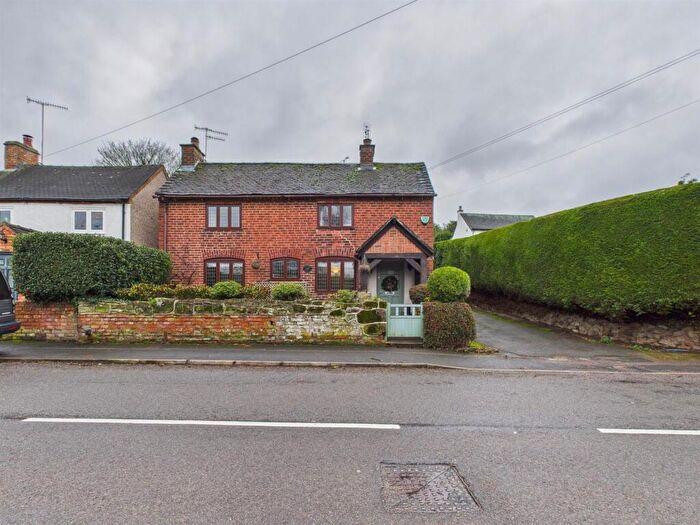
Properties for sale in Repton
Roads and Postcodes in Repton
Navigate through our locations to find the location of your next house in Repton, Derby for sale or to rent.
| Streets | Postcodes |
|---|---|
| Ashby Road | DE73 7JJ |
| Askew Grove | DE65 6GJ DE65 6GR DE65 6SH |
| Bantons Lane | DE73 7NZ |
| Bendalls Cottages | DE65 6EG |
| Boot Hill | DE65 6FT |
| Box Lane | DE73 7JN |
| Broadstone Lane | DE73 7LD |
| Brook End | DE65 6FW |
| Brook House Mews | DE65 6PB |
| Brook Side Close | DE65 6FG |
| Brookdale | DE65 6RP |
| Broomhills Lane | DE65 6FS |
| Burdett Way | DE65 6GA |
| Burton Road | DE65 6FL DE65 6FN DE73 7JG |
| Chapel Street | DE73 7JY |
| Chestnut Avenue | DE65 6EJ |
| Chestnut Way | DE65 6FQ |
| Church Lane | DE73 7JU |
| Clayfields Road | DE65 6RA |
| Coppice Rise | DE65 6SN |
| Derby Road | DE73 7JD DE73 7LG |
| Fisher Close | DE65 6GS |
| Forge Close | DE65 6WR |
| Grange Close | DE73 7LF |
| Greenhill Court | DE65 6RJ |
| Harpur Avenue | DE73 7JS |
| Hayes Farm Court | DE73 7JE |
| High Street | DE65 6GD DE65 6GF DE73 7JH DE65 6GE |
| Hill View | DE65 6GT |
| Holbrook Court | DE65 6QZ |
| Holloway | DE65 6RH |
| Ingleby Lane | DE73 7JQ DE73 7JX |
| Longlands | DE65 6GB |
| Main Street | DE65 6EF DE65 6EZ DE65 6FB DE73 7JF DE73 7JZ DE65 6NZ |
| Maple Court | DE65 6PZ |
| Meadow Close | DE65 6WT |
| Meadow Lane | DE65 6PL |
| Melbourne Lane | DE73 7JT |
| Mercia Court | DE65 6FF |
| Mill Farm | DE65 6RR |
| Mill Hill | DE65 6GQ |
| Milton Road | DE65 6FZ DE65 6EE DE65 6QY |
| Mitre Drive | DE65 6FJ |
| Monsom Lane | DE65 6FX |
| Narrow Lane | DE73 7JR |
| Pinfold Close | DE65 6FR |
| Pinfold Lane | DE65 6GH |
| Red Lane | DE65 6FD DE65 6QP |
| Richmond Court | DE65 6WS |
| Rose Lane | DE73 7JW DE73 7LB |
| Saxon Croft | DE65 6FY |
| Scaddows Lane | DE73 7JP |
| Shakespeare Meadows | DE65 6SB |
| Spinney Lodge | DE65 6PH |
| Springfield Road | DE65 6GN DE65 6GP |
| Stanton Hill | DE73 7LA |
| Staunton Lane | DE73 7GZ |
| Stratford Close | DE65 6SQ |
| Tanners Lane | DE65 6FP |
| The Crescent | DE65 6GL |
| The Green | DE73 7GY |
| The Paddock | DE65 6SE |
| The Pastures | DE65 6GG |
| The Woodyard | DE73 7LN |
| Walnut Close | DE65 6WA |
| Waterworks House | DE65 6EH |
| Well Lane | DE65 6EY |
| Willington Road | DE65 6FH DE65 6ZH |
| Wystan Court | DE65 6SA |
| DE73 7HW DE65 6FE DE73 7GL DE73 7LE |
Transport near Repton
-
Willington Station
-
Peartree Station
-
Burton-On-Trent Station
-
Derby Station
-
Tutbury and Hatton Station
-
Spondon Station
- FAQ
- Price Paid By Year
- Property Type Price
Frequently asked questions about Repton
What is the average price for a property for sale in Repton?
The average price for a property for sale in Repton is £456,533. This amount is 48% higher than the average price in Derby. There are 2,143 property listings for sale in Repton.
What streets have the most expensive properties for sale in Repton?
The streets with the most expensive properties for sale in Repton are Mill Hill at an average of £1,350,000, Mitre Drive at an average of £1,250,000 and The Pastures at an average of £1,177,500.
What streets have the most affordable properties for sale in Repton?
The streets with the most affordable properties for sale in Repton are The Crescent at an average of £215,000, Pinfold Lane at an average of £241,750 and Springfield Road at an average of £255,333.
Which train stations are available in or near Repton?
Some of the train stations available in or near Repton are Willington, Peartree and Burton-On-Trent.
Property Price Paid in Repton by Year
The average sold property price by year was:
| Year | Average Sold Price | Price Change |
Sold Properties
|
|---|---|---|---|
| 2025 | £442,916 | 9% |
39 Properties |
| 2024 | £402,454 | -26% |
33 Properties |
| 2023 | £506,872 | 10% |
46 Properties |
| 2022 | £458,145 | -3% |
52 Properties |
| 2021 | £472,546 | 34% |
76 Properties |
| 2020 | £311,677 | -6% |
52 Properties |
| 2019 | £331,922 | -1% |
58 Properties |
| 2018 | £336,357 | -1% |
67 Properties |
| 2017 | £339,107 | 13% |
93 Properties |
| 2016 | £295,528 | -11% |
76 Properties |
| 2015 | £328,297 | 4% |
63 Properties |
| 2014 | £314,527 | -7% |
67 Properties |
| 2013 | £335,848 | 10% |
44 Properties |
| 2012 | £300,746 | 13% |
45 Properties |
| 2011 | £261,026 | -22% |
37 Properties |
| 2010 | £318,327 | 13% |
36 Properties |
| 2009 | £275,866 | 8% |
39 Properties |
| 2008 | £252,951 | -11% |
31 Properties |
| 2007 | £280,112 | 6% |
53 Properties |
| 2006 | £264,027 | 18% |
79 Properties |
| 2005 | £216,860 | -11% |
41 Properties |
| 2004 | £241,173 | 13% |
49 Properties |
| 2003 | £210,051 | 21% |
56 Properties |
| 2002 | £165,400 | 16% |
81 Properties |
| 2001 | £139,362 | -5% |
70 Properties |
| 2000 | £145,957 | 18% |
51 Properties |
| 1999 | £120,397 | 21% |
78 Properties |
| 1998 | £95,623 | -19% |
54 Properties |
| 1997 | £114,197 | 20% |
57 Properties |
| 1996 | £91,130 | -3% |
53 Properties |
| 1995 | £94,237 | - |
38 Properties |
Property Price per Property Type in Repton
Here you can find historic sold price data in order to help with your property search.
The average Property Paid Price for specific property types in the last three years are:
| Property Type | Average Sold Price | Sold Properties |
|---|---|---|
| Semi Detached House | £309,043.00 | 33 Semi Detached Houses |
| Detached House | £597,777.00 | 62 Detached Houses |
| Terraced House | £299,500.00 | 19 Terraced Houses |
| Flat | £229,937.00 | 4 Flats |

