
Houses for sale & to rent in Repton, Burton-on-trent
House Prices in Repton
Properties in Repton have an average house price of £411k and had 66 Property Transactions within the last 3 years¹.
Repton is an area in Burton-on-trent, Derbyshire with 619 households², where the most expensive property was sold for £825k.
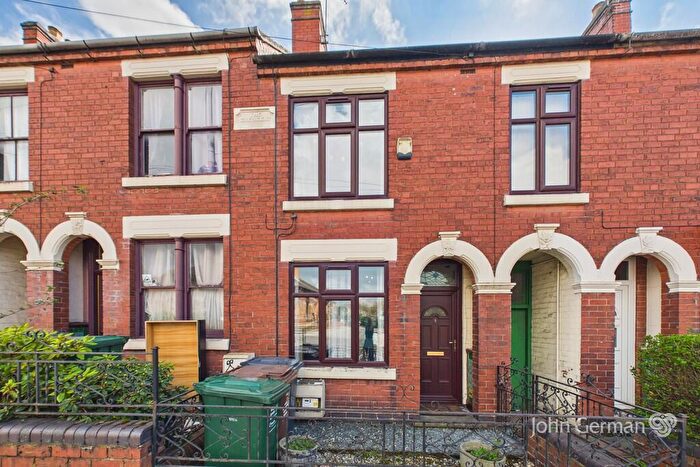
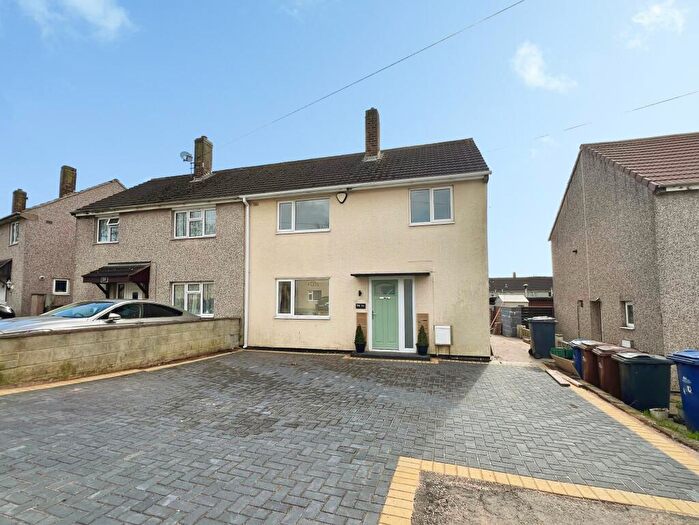
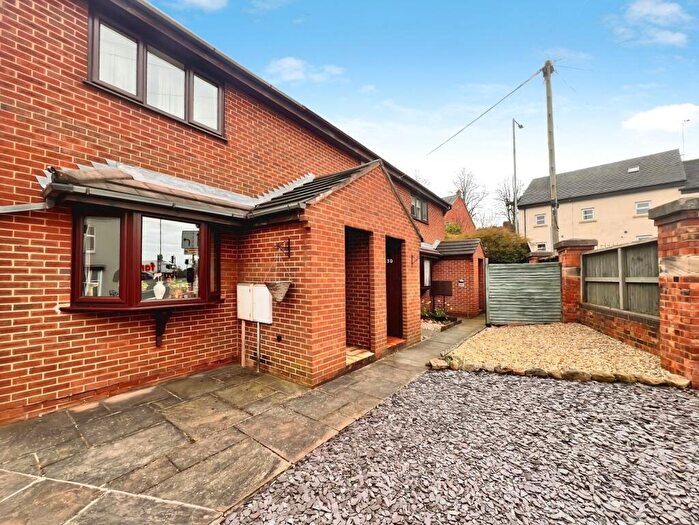
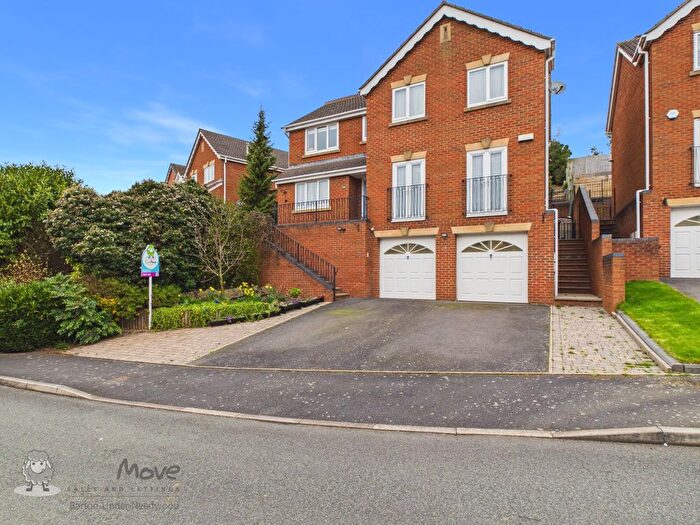
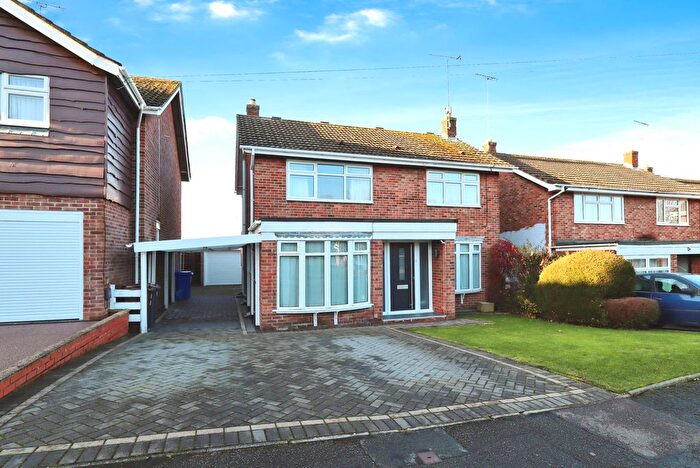
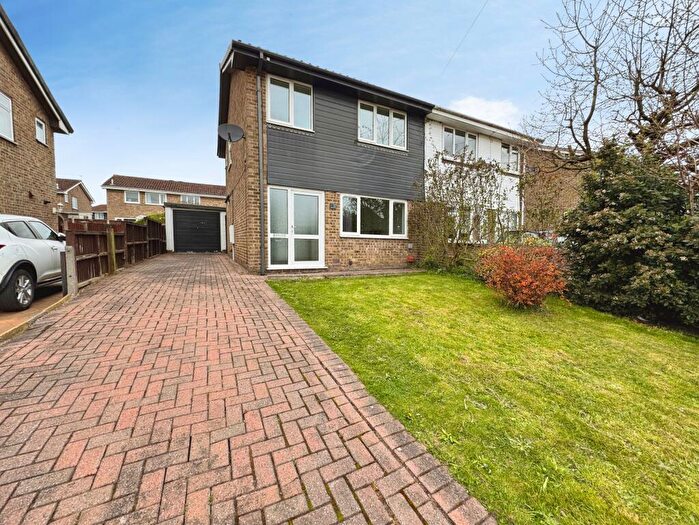
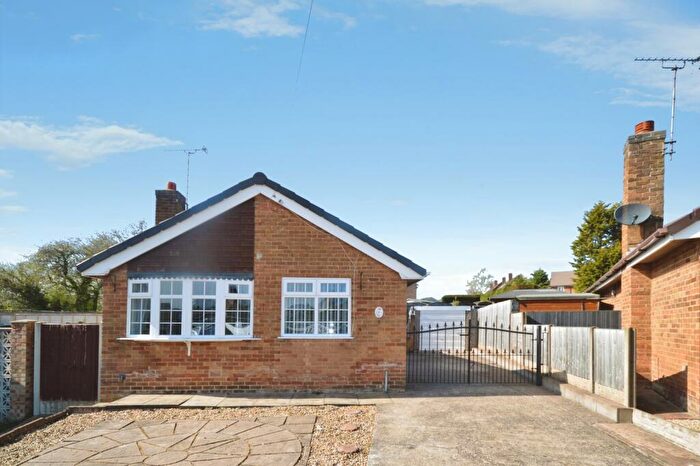
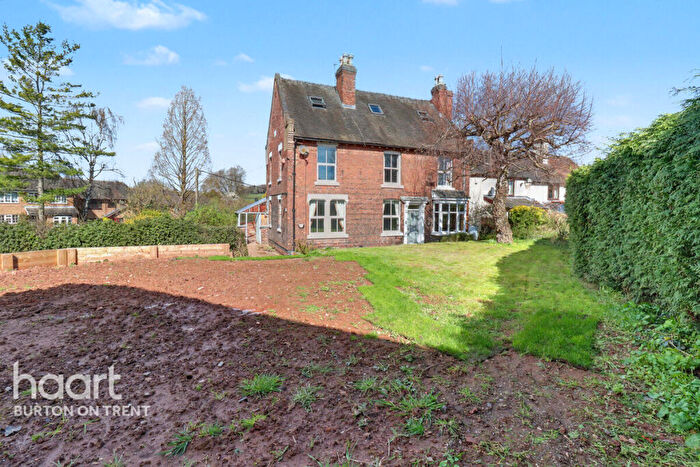
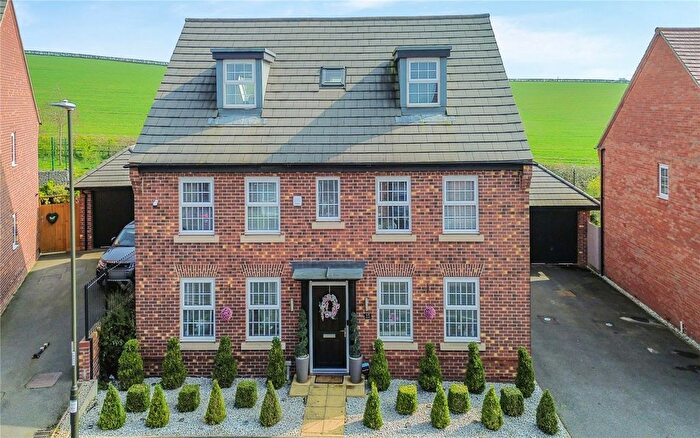
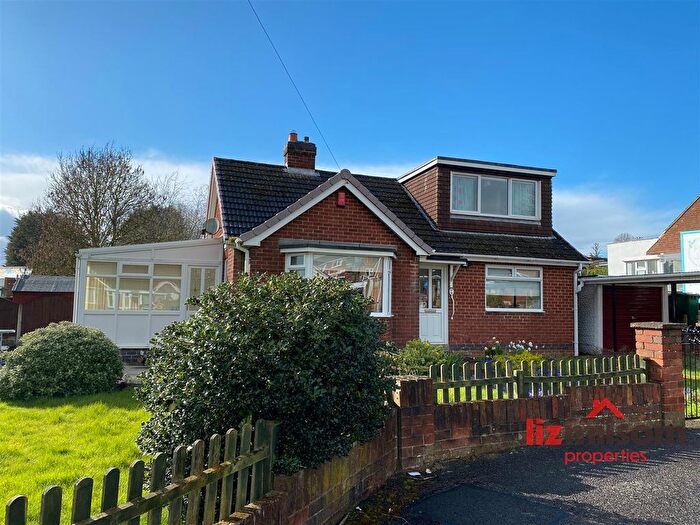
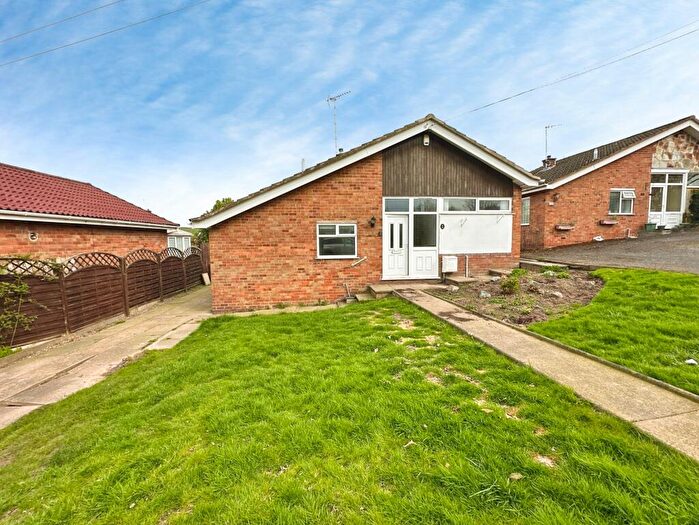
Properties for sale in Repton
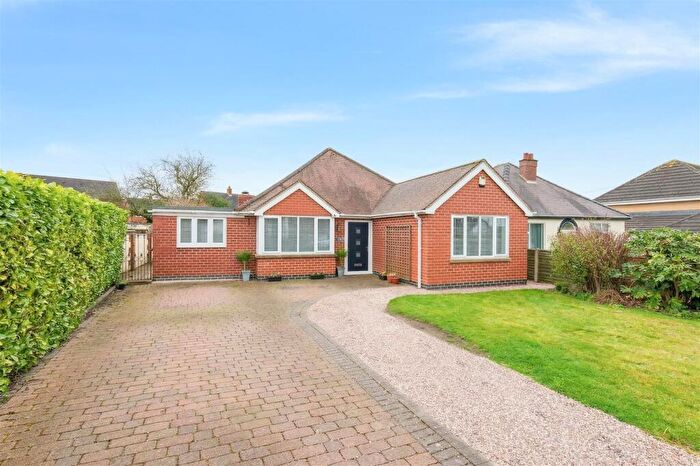
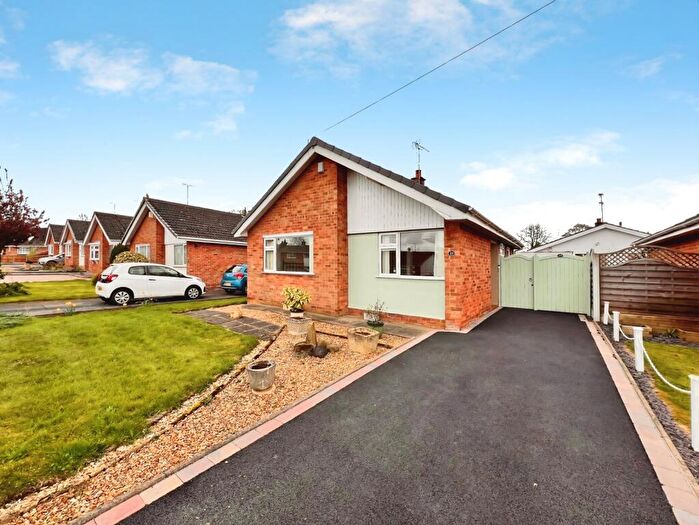
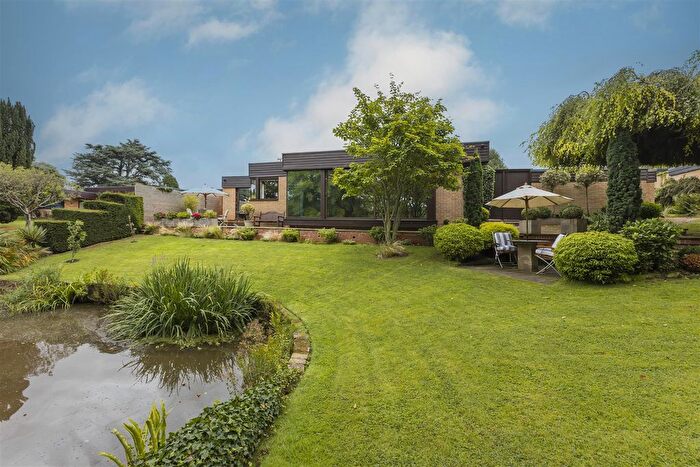
![]()
If you are looking to sell your house, let it out, or receive a property valuation, an expert can help you.
Click the button below to get started.


Roads and Postcodes in Repton
Navigate through our locations to find the location of your next house in Repton, Burton-on-trent for sale or to rent.
| Streets | Postcodes |
|---|---|
| Ashby Road East | DE15 0PS DE15 0PT DE15 0PU |
| Blacksmiths Lane | DE15 0SD |
| Bretby Business Park | DE15 0YZ |
| Bretby Fairways | DE15 0QY |
| Bretby Lane | DE15 0QN DE15 0QP DE15 0QR DE15 0QS DE15 0QW DE15 0RX DE15 0RY |
| Bretby Park | DE15 0RB DE15 0QG |
| Brick Kiln Road | DE15 0TS |
| Carnarvon Court | DE15 0UA |
| Church Lane | DE15 0SR |
| Cricket Close | DE15 0RZ |
| Geary Lane | DE15 0QE |
| Gretton Mews | DE15 0UB |
| Greysich Lane | DE15 0RH |
| Hargate Lane | DE15 0TH |
| Hartshorne Road | DE15 0RQ |
| Higgot Lane | DE15 0BG |
| Hollies Close | DE15 0SB |
| Hollow Lane | DE15 0DR |
| Hoskins Lane | DE15 0TW |
| Knights Lane | DE15 0RT |
| Main Street | DE15 0SJ |
| Mill Close | DE15 0SA |
| Mount Road | DE15 0RA |
| Newton Close | DE15 0SL |
| Newton Lane | DE15 0RU |
| Newton Park | DE15 0SX DE15 0ST |
| Newton Road | DE15 0TE DE15 0TF DE15 0TG DE15 0TQ DE15 0TB DE15 0TD |
| Oldicote Lane | DE15 0QH |
| Park Row | DE15 0RL |
| Ratcliff Mews | DE15 0BF |
| Repton Road | DE15 0RG DE15 0SG |
| Repton Shrubs | DE15 0RJ |
| St Marys Close | DE15 0SE |
| Stanhope Green | DE15 0QU |
| The Close | DE15 0SZ |
| The Green | DE15 0RE |
| The Mews | DE15 0SU |
| The Ridge | DE15 0SY |
| The Square | DE15 0RF DE15 0SQ |
| Trent Lane | DE15 0SF |
| Waggon Lane | DE15 0QF |
| Wheatley Lane | DE15 0RS |
| DE15 0QQ DE15 0RD DE15 0QX DE15 0RN DE15 0SS DE15 0TA |
Transport near Repton
-
 Burton-On-Trent Station
 -
Willington Station
-
Tutbury and Hatton Station
-
Peartree Station
-
Derby Station
-
Spondon Station
- FAQ
- Price Paid By Year
- Property Type Price
Frequently asked questions about Repton
What is the average price for a property for sale in Repton?
The average price for a property for sale in Repton is £411,368. This amount is 12% higher than the average price in Burton-on-trent. There are 3,084 property listings for sale in Repton.
What streets have the most expensive properties for sale in Repton?
The streets with the most expensive properties for sale in Repton are Trent Lane at an average of £680,933, Geary Lane at an average of £620,000 and Hoskins Lane at an average of £530,000.
What streets have the most affordable properties for sale in Repton?
The streets with the most affordable properties for sale in Repton are Park Row at an average of £260,833, Carnarvon Court at an average of £262,500 and The Ridge at an average of £270,000.
Which train stations are available in or near Repton?
Some of the train stations available in or near Repton are Burton-On-Trent, Willington and Tutbury and Hatton.
Property Price Paid in Repton by Year
The average sold property price by year was:
| Year | Average Sold Price | Price Change |
Sold Properties
|
|---|---|---|---|
| 2025 | £467,760 | 17% |
23 Properties |
| 2024 | £389,975 | 4% |
21 Properties |
| 2023 | £372,831 | 1% |
22 Properties |
| 2022 | £370,729 | -1% |
37 Properties |
| 2021 | £374,341 | -17% |
52 Properties |
| 2020 | £437,909 | 18% |
24 Properties |
| 2019 | £358,376 | 6% |
46 Properties |
| 2018 | £336,807 | -6% |
59 Properties |
| 2017 | £356,772 | 17% |
33 Properties |
| 2016 | £295,479 | 6% |
37 Properties |
| 2015 | £279,023 | -9% |
21 Properties |
| 2014 | £303,937 | 9% |
24 Properties |
| 2013 | £277,615 | 9% |
17 Properties |
| 2012 | £252,500 | 13% |
8 Properties |
| 2011 | £218,572 | 4% |
13 Properties |
| 2010 | £208,944 | -43% |
9 Properties |
| 2009 | £298,832 | -12% |
19 Properties |
| 2008 | £333,993 | 4% |
9 Properties |
| 2007 | £320,074 | 9% |
26 Properties |
| 2006 | £292,614 | 3% |
34 Properties |
| 2005 | £282,380 | -6% |
31 Properties |
| 2004 | £299,842 | 20% |
20 Properties |
| 2003 | £238,382 | 22% |
34 Properties |
| 2002 | £185,678 | 14% |
38 Properties |
| 2001 | £160,421 | 13% |
49 Properties |
| 2000 | £139,192 | 21% |
25 Properties |
| 1999 | £109,630 | 10% |
23 Properties |
| 1998 | £98,355 | -6% |
18 Properties |
| 1997 | £104,528 | 22% |
19 Properties |
| 1996 | £81,357 | 4% |
14 Properties |
| 1995 | £78,030 | - |
27 Properties |
Property Price per Property Type in Repton
Here you can find historic sold price data in order to help with your property search.
The average Property Paid Price for specific property types in the last three years are:
| Property Type | Average Sold Price | Sold Properties |
|---|---|---|
| Semi Detached House | £338,273.00 | 23 Semi Detached Houses |
| Detached House | £525,349.00 | 30 Detached Houses |
| Terraced House | £266,071.00 | 7 Terraced Houses |
| Flat | £291,166.00 | 6 Flats |