
Houses for sale in St Johns, Glossop
House Prices in St Johns
Properties in St Johns have an average house price of £298k and had 88 Property Transactions within the last 3 years¹.
St Johns is an area in Glossop, Derbyshire with 858 households², where the most expensive property was sold for £930k.
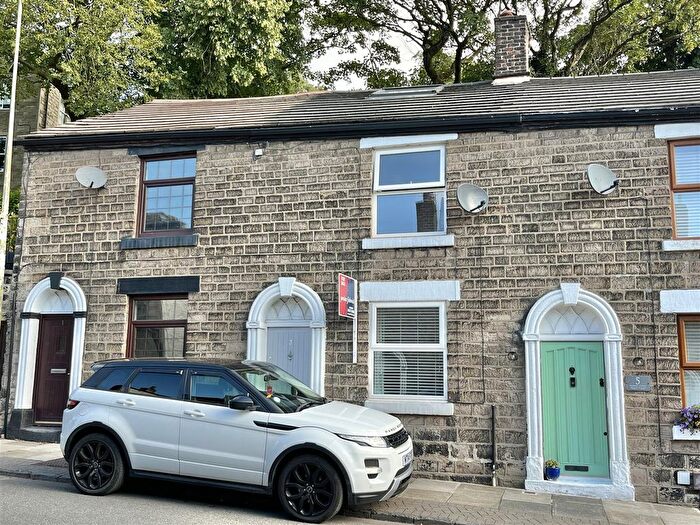
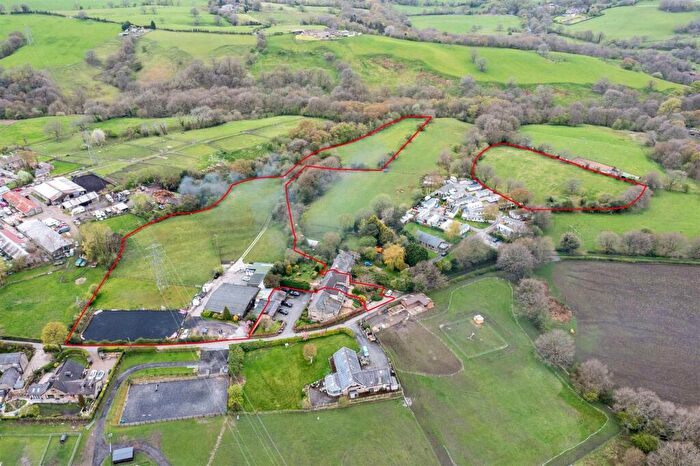
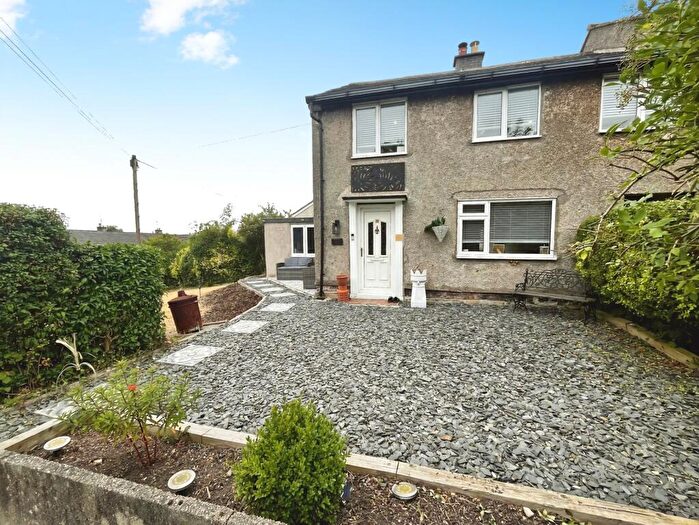
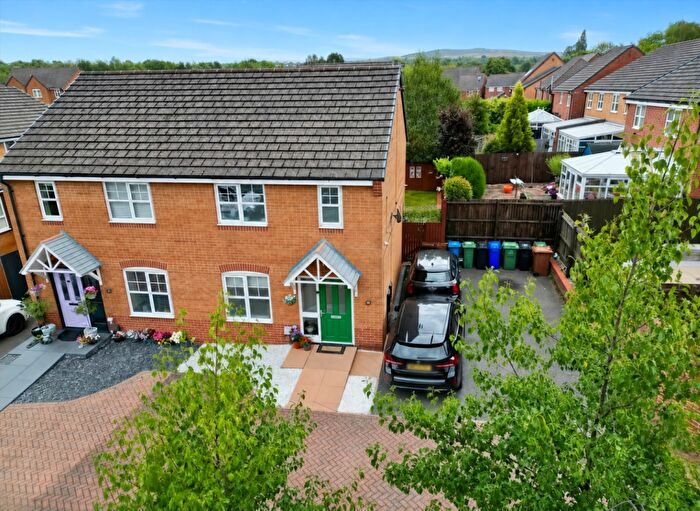
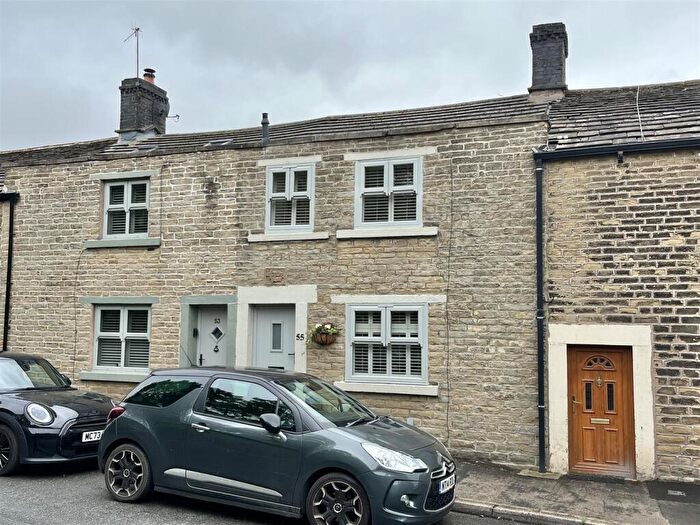
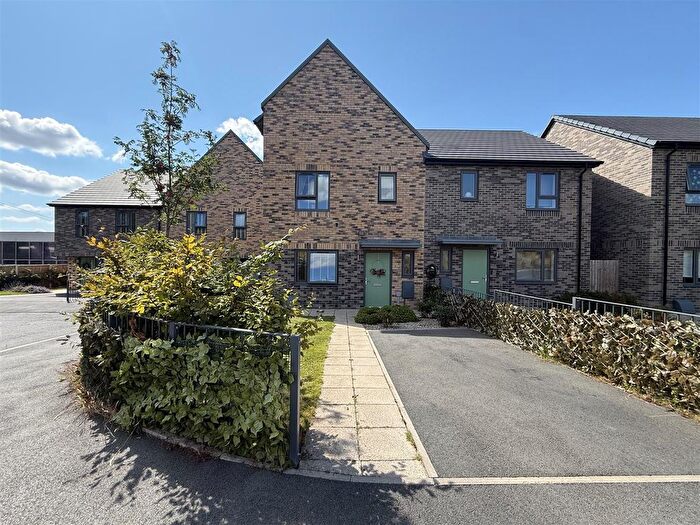
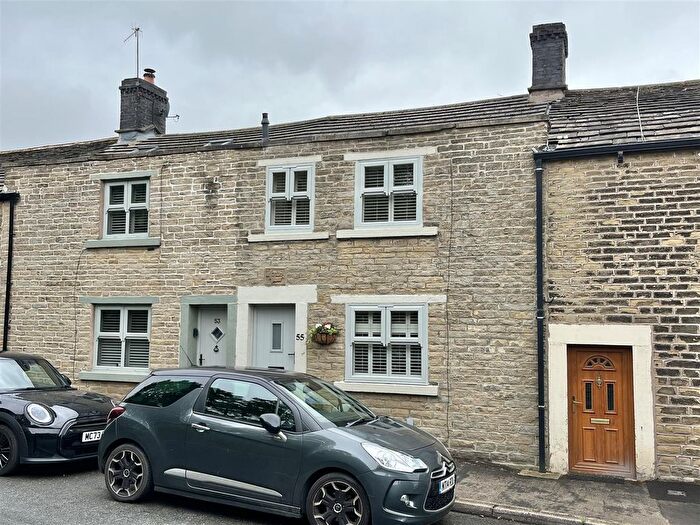
Properties for sale in St Johns

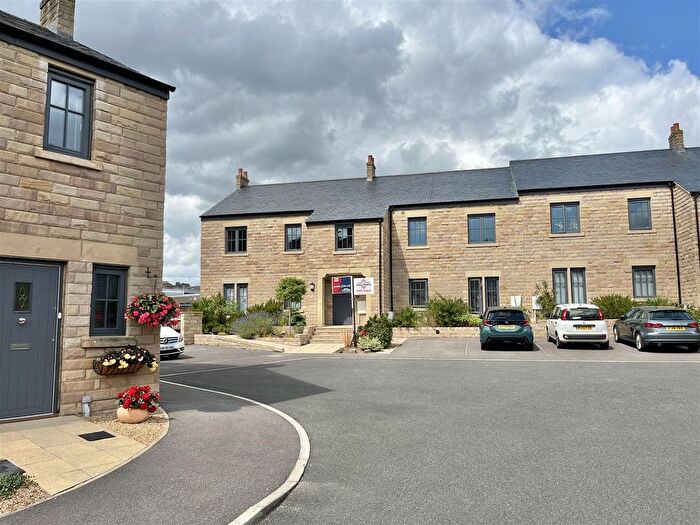

![]()
If you are looking to sell your house, let it out, or receive a property valuation, an expert can help you.
Click the button below to get started.

Roads and Postcodes in St Johns
Navigate through our locations to find the location of your next house in St Johns, Glossop for sale or to rent.
| Streets | Postcodes |
|---|---|
| Back Lane | SK13 5HJ |
| Bankwood | SK13 5ER |
| Besthill Cottages | SK13 5EP |
| Blackshaw Clough | SK13 7QR |
| Boarfold Lane | SK13 5RT |
| Boggard Lane | SK13 5HL |
| Chapel Brow | SK13 5HH |
| Chew Wood | SK13 5RR |
| Chunal | SK13 6JY |
| Church Fold | SK13 5EU |
| Coombes Lane | SK13 5DG SK13 5HN |
| Derbyshire Level | SK13 7PR SK13 7PT |
| Far Woodseats Lane | SK13 5RS |
| Gamesley Fold | SK13 6JJ |
| Glossop Road | SK13 5EZ SK13 5HB SK13 5HF SK13 6EJ SK13 6JH |
| Hargate Hill | SK13 6JL |
| Hargate Hill Lane | SK13 5HG |
| Haydn Fold | SK13 5HE |
| High Lane | SK13 6JN |
| Higher Chisworth | SK13 5SA SK13 5SD |
| Kidd Road | SK13 7PN |
| Kinderlee Way | SK13 5DB |
| Lee Head | SK13 5DD |
| Lee Vale Drive | SK13 5HD |
| Lee Valley | SK13 5DN |
| Long Lane | SK13 5ES SK13 5ET |
| Marple Road | SK13 5DA SK13 5DE SK13 5DF SK13 5DH SK13 5DL SK13 5EY SK13 5RU |
| Monks Road | SK13 6JZ |
| Moorfield | SK13 7PP |
| New Mills Road | SK13 5DJ |
| Rose Grove | SK13 5DT |
| Sandy Lane | SK13 5RZ |
| Sheffield Road | SK13 7PU |
| Shepley Street | SK13 7PY |
| Sherwood Fold | SK13 5HW |
| Snake Road | SK13 7PQ |
| Springfield | SK13 5DW |
| Springmeadow | SK13 5HP |
| Tomwood Rise | SK13 5BZ |
| Torside | SK13 1JF SK13 1HX |
| Town Lane | SK13 5HA SK13 5HQ |
| Woodhead Road | SK13 1HU |
| Woodseats Lane | SK13 5DP SK13 5DR SK13 5DS |
| SK13 1JE SK13 1HT SK13 1JB SK13 5SB SK13 7PS SK13 7PW |
Property price trends in St Johns
According to the latest Land Registry data, the average home in St Johns sold for £273,125 in 2026. That figure comes from 1,018 sales logged over the past 31 years.
Prices have fallen back over the last three years. Compared with 2023, when the typical sale came in around £322,459, that's a fall of roughly 15.3%.
Looking back five years, average prices are down about 5.9% since 2021, a drop of around £16,995 in cash terms.
Zoom out to the past decade for the fuller picture. Back in 2016, homes here averaged £200,598, so the typical sold price has climbed about 36.2% since then, roughly 3.1% a year. Stretch the view to fifteen years and that annual pace eases back to about 2.5%.
Frequently asked questions about St Johns
What is the average price for a property for sale in St Johns?
The average price for a property for sale in St Johns is £298,076. This amount is 11% higher than the average price in Glossop. There are 9,280 property listings for sale in St Johns.
What streets have the most expensive properties for sale in St Johns?
The streets with the most expensive properties for sale in St Johns are Chapel Brow at an average of £619,500, Back Lane at an average of £393,500 and Lee Head at an average of £369,666.
What streets have the most affordable properties for sale in St Johns?
The streets with the most affordable properties for sale in St Johns are Kinderlee Way at an average of £197,527, Church Fold at an average of £213,125 and Sherwood Fold at an average of £254,000.
Which train stations are available in or near St Johns?
Some of the train stations available in or near St Johns are Dinting, Broadbottom and Glossop.
Property Price Paid in St Johns by Year
The average sold property price by year was:
| Year | Average Sold Price | Price Change |
Sold Properties
|
|---|---|---|---|
| 2026 | £273,125 | -6% |
4 Properties |
| 2025 | £289,652.41 | -2% |
29 Properties |
| 2024 | £296,223.68 | -9% |
38 Properties |
| 2023 | £322,458.82 | -1% |
17 Properties |
| 2022 | £324,315.79 | 11% |
38 Properties |
| 2021 | £290,119.62 | -13% |
58 Properties |
| 2020 | £329,284.14 | 29% |
35 Properties |
| 2019 | £234,060.71 | -2% |
49 Properties |
| 2018 | £238,710.94 | 1% |
32 Properties |
| 2017 | £235,325.69 | 15% |
35 Properties |
Property Price per Property Type in St Johns
Here you can find historic sold price data in order to help with your property search.
The average Property Paid Price for specific property types in the last three years are:
| Property Type | Average Sold Price | Sold Properties |
|---|---|---|
| Semi Detached House | £319,333.33 | 27 Semi Detached Houses |
| Detached House | £427,127.00 | 18 Detached Houses |
| Terraced House | £238,717.00 | 33 Terraced Houses |
| Flat | £204,275.00 | 10 Flats |
