
Houses for sale in Whitfield, Glossop
House Prices in Whitfield
Properties in Whitfield have an average house price of £199k and had 90 Property Transactions within the last 3 years¹.
Whitfield is an area in Glossop, Derbyshire with 1,033 households², where the most expensive property was sold for £415k.
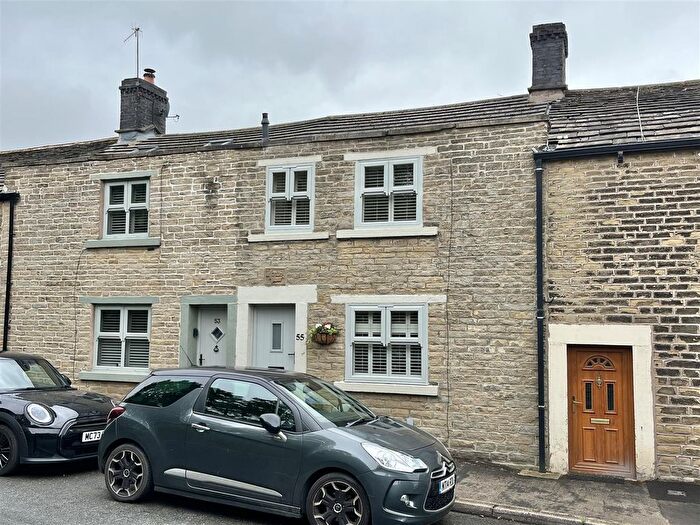
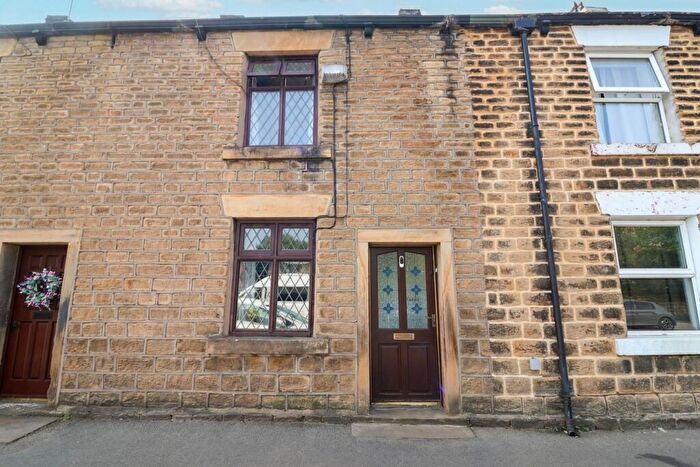
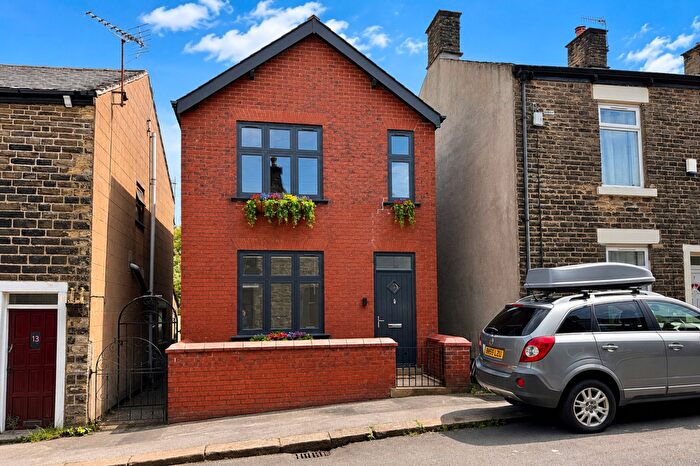
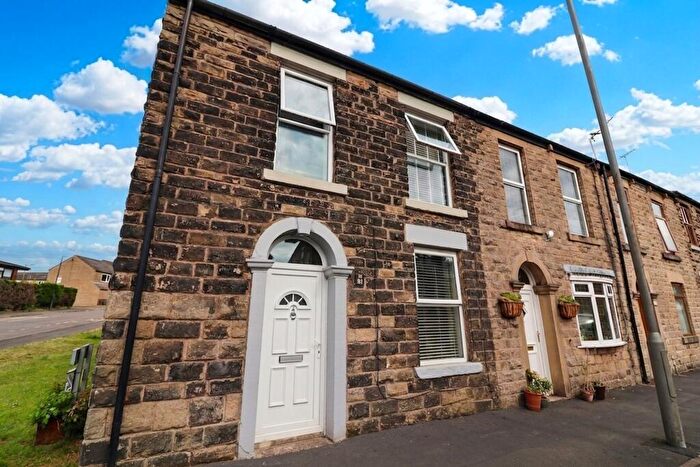
Properties for sale in Whitfield

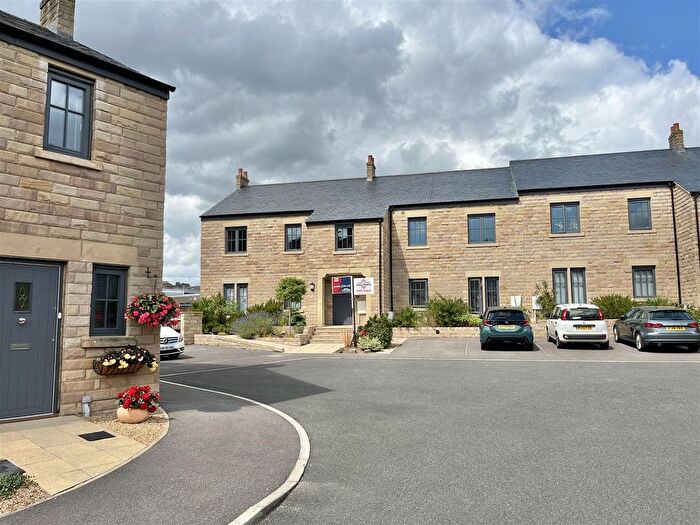

![]()
If you are looking to sell your house, let it out, or receive a property valuation, an expert can help you.
Click the button below to get started.


Roads and Postcodes in Whitfield
Navigate through our locations to find the location of your next house in Whitfield, Glossop for sale or to rent.
| Streets | Postcodes |
|---|---|
| Acre Street | SK13 8JS |
| Bank Street | SK13 8ND |
| Barn Close | SK13 8NP |
| Charlestown Road | SK13 8JN SK13 8LB |
| Charlestown View | SK13 8GT |
| Chunal Lane | SK13 6JA SK13 6LA SK13 6AB |
| Cliffe Road | SK13 8NT SK13 8NY |
| Crosslands Close | SK13 8PB |
| Derby Street | SK13 8LP |
| Ebenezer Street | SK13 8JY |
| Fieldhead | SK13 8NX |
| Freetown | SK13 8JT SK13 8NH |
| Gladstone Close | SK13 8LN |
| Gladstone Street | SK13 8NE SK13 8NG |
| Hague Street | SK13 7PJ SK13 8NR SK13 8NS |
| Highfield Road | SK13 8NZ SK13 8PE |
| Hob Hill Meadows | SK13 8LW |
| Kershaw Street | SK13 8NB SK13 8NN |
| King Charles Court | SK13 8NJ |
| Kings Court | SK13 8HD |
| Lean Town | SK13 7PL |
| Morley Street | SK13 8PG |
| Nursery Close | SK13 8PQ |
| Padfield Gate | SK13 8NU |
| Todd Street | SK13 8NQ |
| Unity Walk | SK13 8PH |
| Uplands Road | SK13 8PA SK13 8PD |
| Victoria Court | SK13 8HR |
| Whitfield Avenue | SK13 8JZ SK13 8LA SK13 8LH |
| Whitfield Cross | SK13 8NW |
| Whitfield Park | SK13 8LG |
| Whitfield Wells | SK13 8GL |
| Wood Street | SK13 8NF SK13 8NL |
Property price trends in Whitfield
According to the latest Land Registry data, the average home in Whitfield sold for £200,500 in 2026. That figure comes from 1,035 sales logged over the past 31 years.
Prices have continued to climb over the last three years. Compared with 2023, when the typical sale came in around £174,962, that's a rise of roughly 14.6%.
Looking back five years, average prices are up about 4.6% since 2021, a gain of around £8,757 in cash terms.
Zoom out to the past decade for the fuller picture. Back in 2016, homes here averaged £162,701, so the typical sold price has climbed about 23.2% since then, roughly 2.1% a year. Stretch the view to fifteen years and that annual pace edges up closer to 3.9%.
Frequently asked questions about Whitfield
What is the average price for a property for sale in Whitfield?
The average price for a property for sale in Whitfield is £199,443. This amount is 26% lower than the average price in Glossop. There are 1,075 property listings for sale in Whitfield.
What streets have the most expensive properties for sale in Whitfield?
The streets with the most expensive properties for sale in Whitfield are Hague Street at an average of £296,218, Hob Hill Meadows at an average of £281,650 and Victoria Court at an average of £271,475.
What streets have the most affordable properties for sale in Whitfield?
The streets with the most affordable properties for sale in Whitfield are Nursery Close at an average of £142,500, Unity Walk at an average of £157,000 and Charlestown Road at an average of £161,323.
Which train stations are available in or near Whitfield?
Some of the train stations available in or near Whitfield are Glossop, Dinting and Hadfield.
Property Price Paid in Whitfield by Year
The average sold property price by year was:
| Year | Average Sold Price | Price Change |
Sold Properties
|
|---|---|---|---|
| 2026 | £200,500 | -11% |
2 Properties |
| 2025 | £221,947 | 11% |
33 Properties |
| 2024 | £196,452 | 11% |
28 Properties |
| 2023 | £174,962 | -16% |
27 Properties |
| 2022 | £203,028 | 6% |
26 Properties |
| 2021 | £191,743 | 2% |
41 Properties |
| 2020 | £187,672 | 21% |
35 Properties |
| 2019 | £147,453 | -2% |
29 Properties |
| 2018 | £150,129 | 6% |
37 Properties |
| 2017 | £141,788 | -15% |
28 Properties |
Property Price per Property Type in Whitfield
Here you can find historic sold price data in order to help with your property search.
The average Property Paid Price for specific property types in the last three years are:
| Property Type | Average Sold Price | Sold Properties |
|---|---|---|
| Semi Detached House | £216,626.00 | 17 Semi Detached Houses |
| Detached House | £292,061.00 | 9 Detached Houses |
| Terraced House | £194,915.00 | 51 Terraced Houses |
| Flat | £130,615.00 | 13 Flats |
