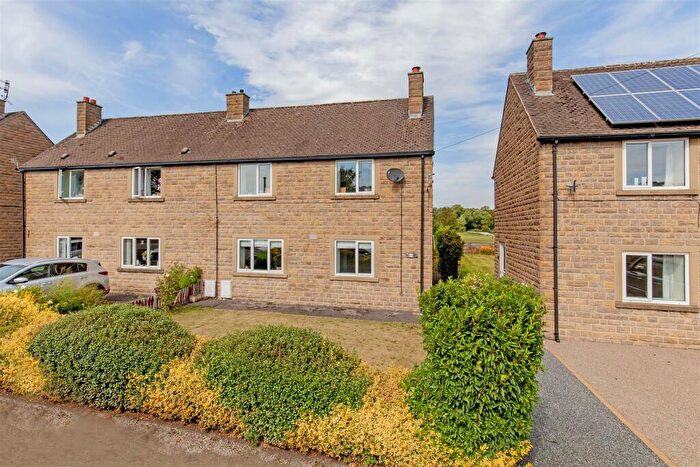
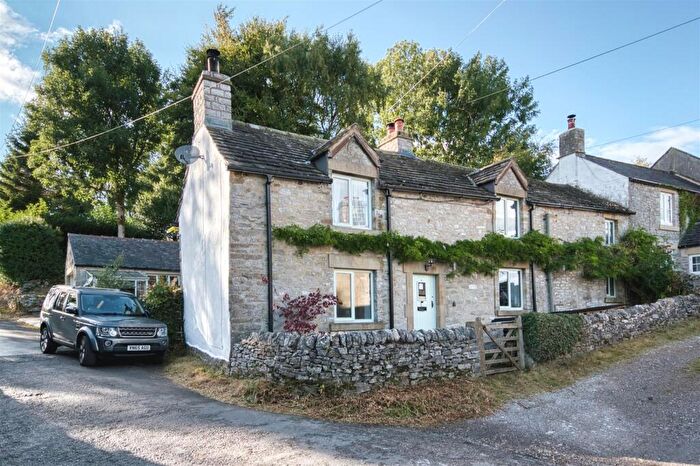
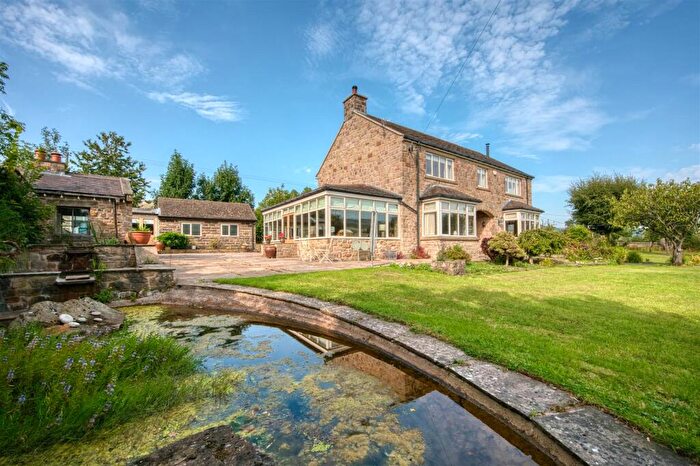
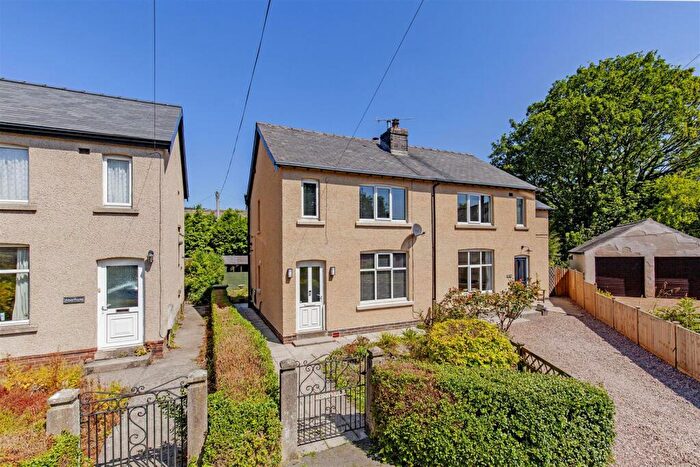
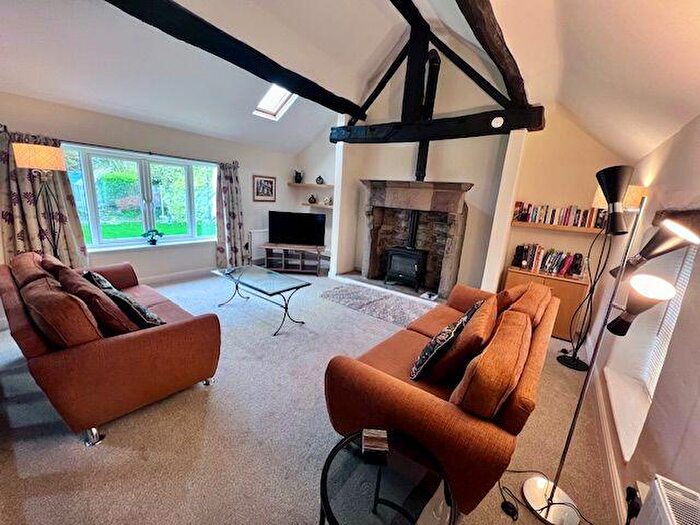
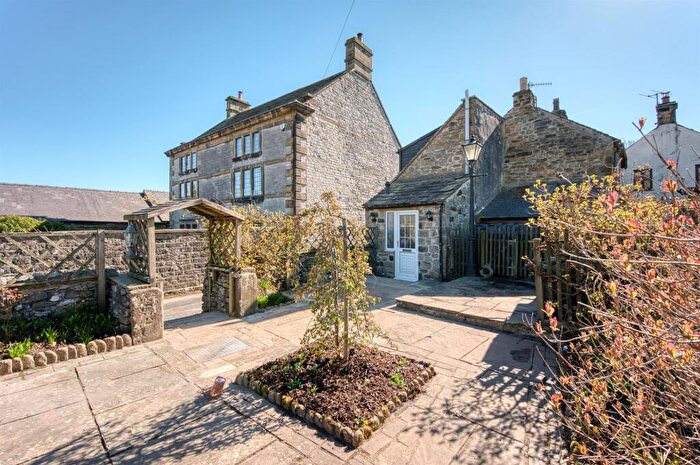
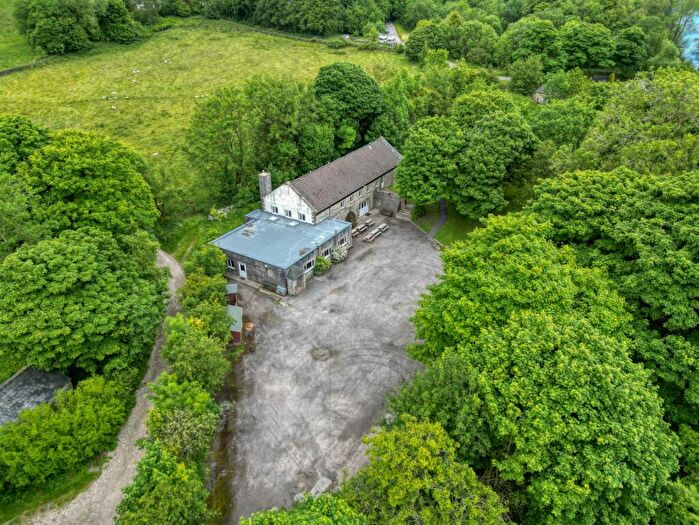
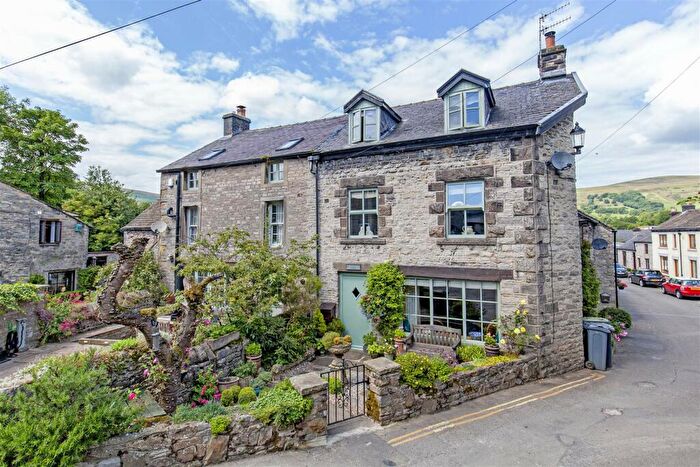
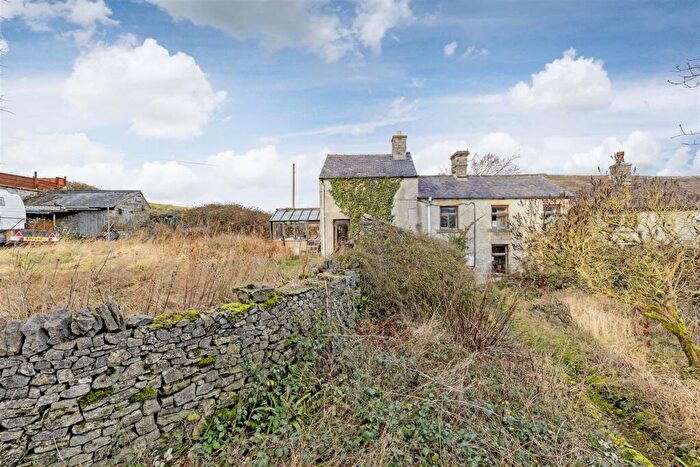
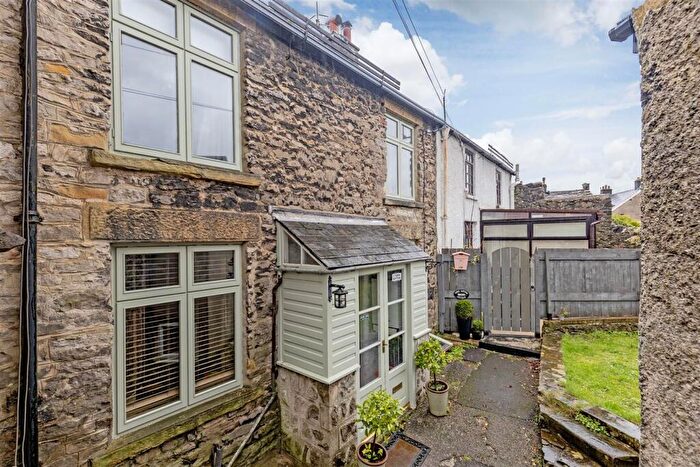
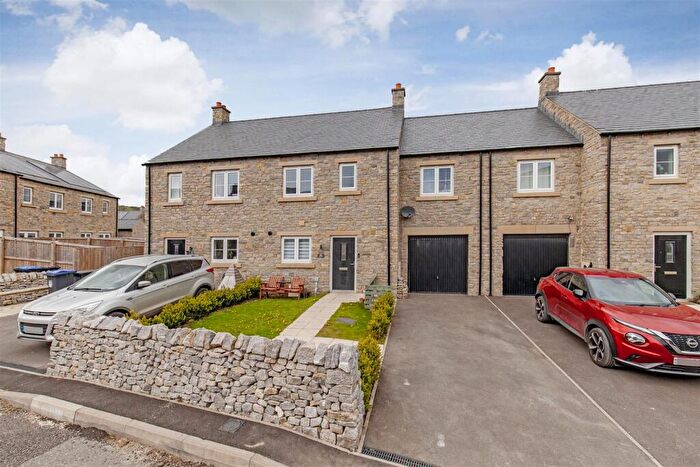
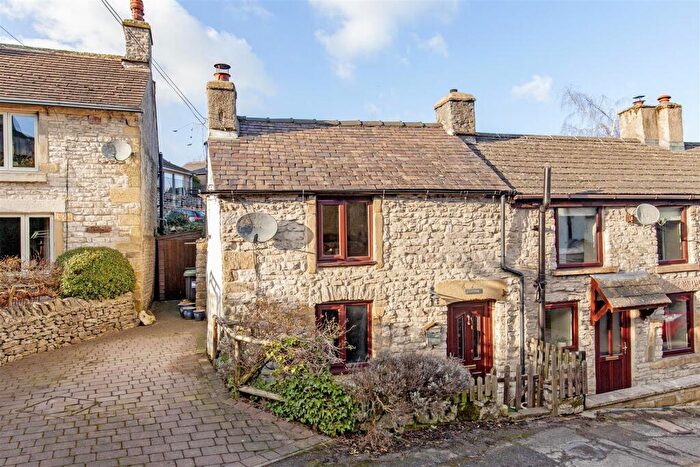
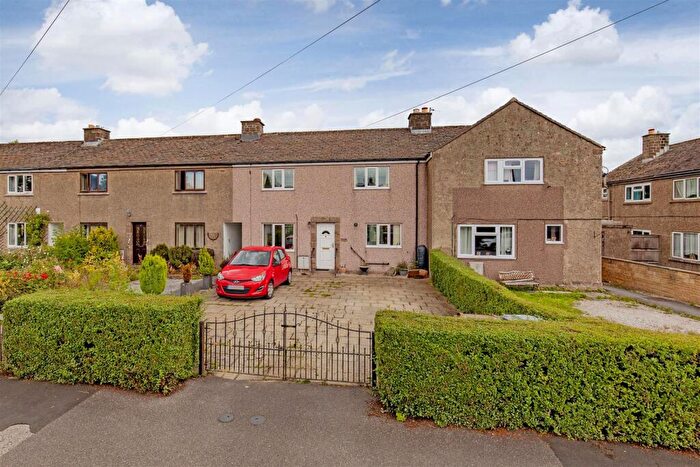
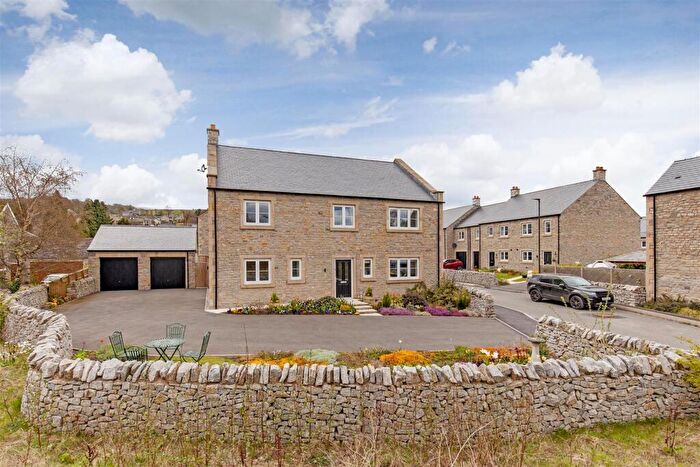
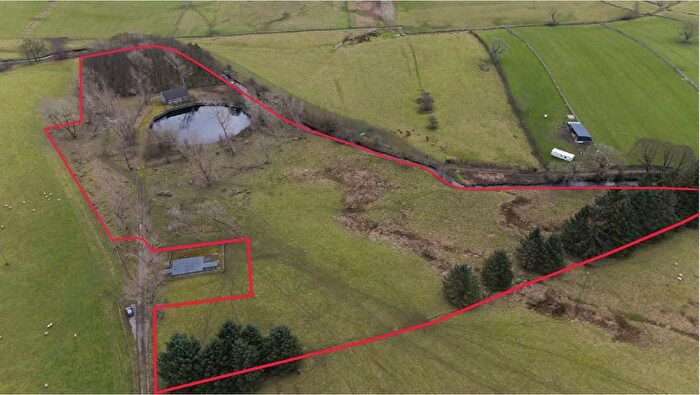
Houses for sale & to rent in Bradwell, Hope Valley
House Prices in Bradwell
Properties in Bradwell have an average house price of £347,720.00 and had 68 Property Transactions within the last 3 years¹.
Bradwell is an area in Hope Valley, Derbyshire with 723 households², where the most expensive property was sold for £1,068,750.00.
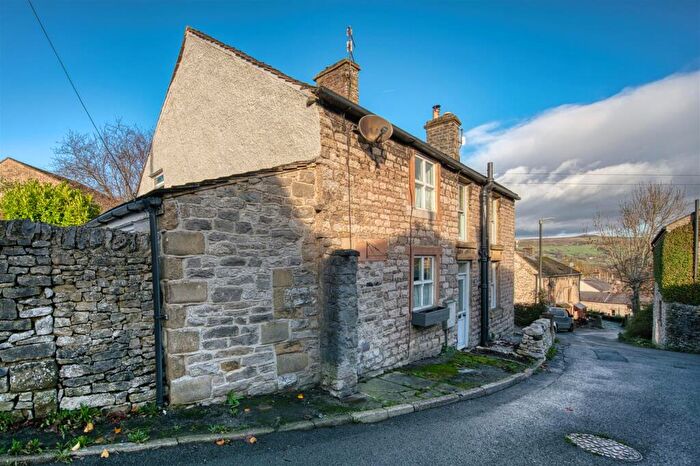
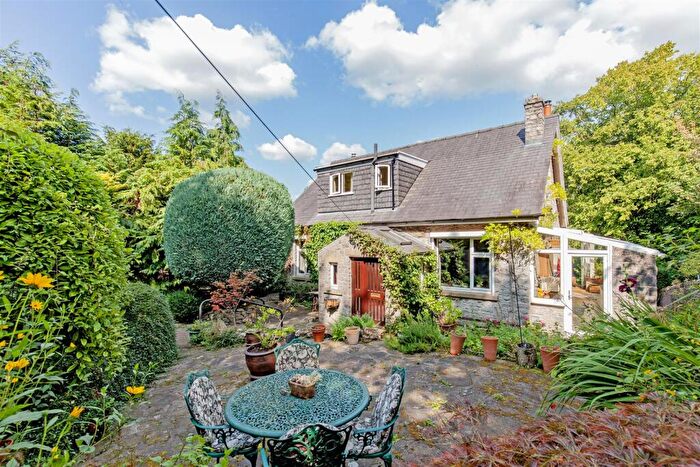
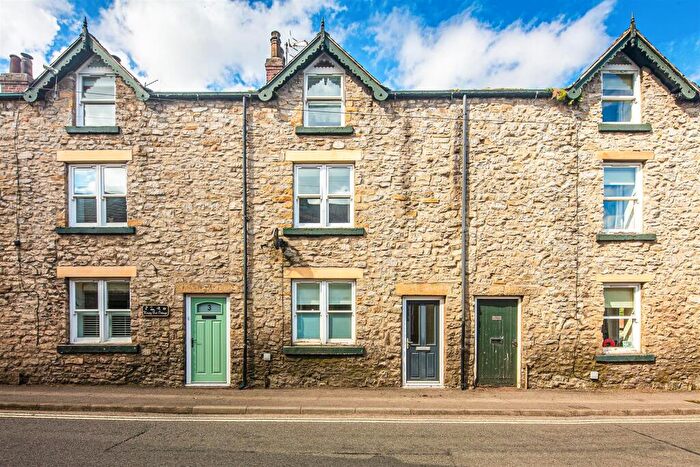
Properties for sale in Bradwell
Previously listed properties in Bradwell
Roads and Postcodes in Bradwell
Navigate through our locations to find the location of your next house in Bradwell, Hope Valley for sale or to rent.
| Streets | Postcodes |
|---|---|
| Batham Road | S33 9HA |
| Bradshaw Lane | S32 5PZ |
| Bradwell Head Road | S33 9HD |
| Bretton | S32 5QD |
| Bridge Street | S33 9HE |
| Brookside | S33 9HF S33 9AD |
| Butts Mill Court | S33 9LE |
| Charlotte Lane | S33 9HH |
| Church Street | S33 9HJ |
| Cross Lane Villas | S33 9GU |
| Dale End | S33 9HP |
| Edge Lane | S33 9LG |
| Elliott Avenue | S33 9HQ |
| Evans Close | S33 9GD |
| Far Hill | S33 9HR |
| Fern Bank | S33 9HS |
| Foolow | S32 5QA S32 5QR |
| Gore Lane | S33 9HT |
| Granby Road | S33 9HU |
| Hallgate View | S33 9HW |
| Hill Head | S33 9HY |
| Hollow Gate | S33 9JA |
| Hugh Lane | S33 9JB |
| Hungry Lane | S33 9JD |
| Jeffrey Lane | S33 9JE |
| Little Lane | S33 9JF |
| Main Road | S33 9JG |
| Michlow Close | S33 9GF |
| Michlow Drive | S33 9GA |
| Micklow Lane | S33 9JH S33 9JZ |
| Moorbrook Lane | S33 9JJ |
| Moss Rake | S33 9HB |
| Netherside | S33 9JL S33 9JW S33 9AA |
| New Church Street | S33 9JN |
| Outlands | S33 9JP S33 9NP |
| Quarters Lane | S33 9HX |
| Smalldale | S33 9GQ S33 9JQ S33 9AB |
| Smithy Hill | S33 9JR |
| Soft Water Lane | S33 9LD |
| Springfield Close | S33 9LA |
| Springfield Road | S33 9JS |
| Stretfield | S33 9JT |
| Swift Close | S33 9AE |
| The Crescent | S33 9HL |
| The Hills | S33 9GZ S33 9HZ |
| The Stones | S33 9LF |
| Town Bottom | S33 9JU |
| Town Lane | S33 9JY |
| Towngate | S33 9JX |
| Wortley Court | S33 9LB |
| S33 9NT S33 9AF |
Transport near Bradwell
- FAQ
- Price Paid By Year
- Property Type Price
Frequently asked questions about Bradwell
What is the average price for a property for sale in Bradwell?
The average price for a property for sale in Bradwell is £347,720. This amount is 24% lower than the average price in Hope Valley. There are 182 property listings for sale in Bradwell.
What streets have the most expensive properties for sale in Bradwell?
The streets with the most expensive properties for sale in Bradwell are Jeffrey Lane at an average of £545,000, Hungry Lane at an average of £542,500 and Church Street at an average of £473,975.
What streets have the most affordable properties for sale in Bradwell?
The streets with the most affordable properties for sale in Bradwell are Elliott Avenue at an average of £140,000, Fern Bank at an average of £186,000 and Micklow Lane at an average of £195,000.
Which train stations are available in or near Bradwell?
Some of the train stations available in or near Bradwell are Hope (Derbyshire), Bamford and Hathersage.
Property Price Paid in Bradwell by Year
The average sold property price by year was:
| Year | Average Sold Price | Price Change |
Sold Properties
|
|---|---|---|---|
| 2025 | £386,479 | 10% |
17 Properties |
| 2024 | £346,818 | 8% |
29 Properties |
| 2023 | £318,959 | -2% |
22 Properties |
| 2022 | £323,850 | -9% |
21 Properties |
| 2021 | £352,116 | -7% |
23 Properties |
| 2020 | £378,400 | 30% |
21 Properties |
| 2019 | £263,370 | 15% |
26 Properties |
| 2018 | £224,275 | -22% |
20 Properties |
| 2017 | £273,945 | 17% |
22 Properties |
| 2016 | £226,522 | -14% |
22 Properties |
| 2015 | £257,757 | 1% |
26 Properties |
| 2014 | £255,732 | 4% |
20 Properties |
| 2013 | £246,086 | -3% |
22 Properties |
| 2012 | £253,884 | 4% |
13 Properties |
| 2011 | £242,822 | -0,3% |
18 Properties |
| 2010 | £243,571 | 16% |
19 Properties |
| 2009 | £204,882 | -6% |
17 Properties |
| 2008 | £217,176 | -27% |
17 Properties |
| 2007 | £276,716 | 3% |
25 Properties |
| 2006 | £268,611 | 27% |
31 Properties |
| 2005 | £195,167 | -7% |
23 Properties |
| 2004 | £209,131 | 11% |
23 Properties |
| 2003 | £185,661 | 21% |
27 Properties |
| 2002 | £147,454 | 20% |
28 Properties |
| 2001 | £117,881 | -24% |
26 Properties |
| 2000 | £145,859 | 19% |
29 Properties |
| 1999 | £118,456 | 25% |
22 Properties |
| 1998 | £89,144 | 7% |
24 Properties |
| 1997 | £82,610 | -7% |
32 Properties |
| 1996 | £88,105 | 9% |
26 Properties |
| 1995 | £79,853 | - |
14 Properties |
Property Price per Property Type in Bradwell
Here you can find historic sold price data in order to help with your property search.
The average Property Paid Price for specific property types in the last three years are:
| Property Type | Average Sold Price | Sold Properties |
|---|---|---|
| Semi Detached House | £319,057.00 | 20 Semi Detached Houses |
| Detached House | £488,294.00 | 22 Detached Houses |
| Terraced House | £250,821.00 | 26 Terraced Houses |

