
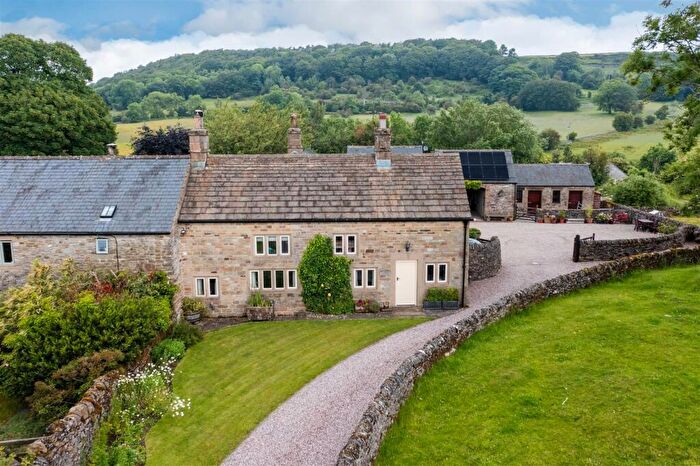
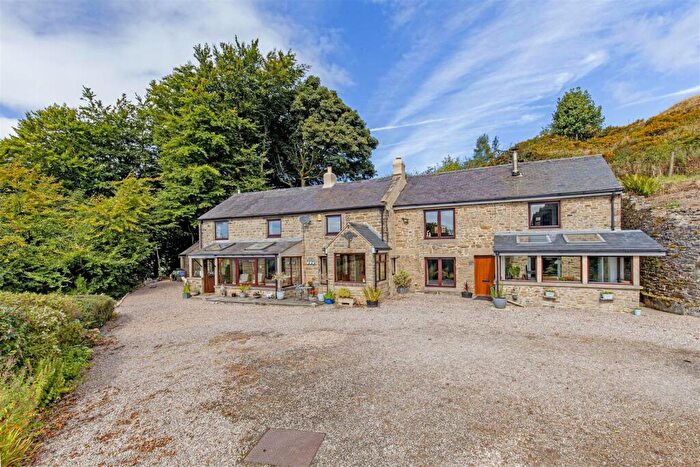
Houses for sale in Bradwell, Buxton
House Prices in Bradwell
Properties in Bradwell have an average house price of £497k and had 8 Property Transactions within the last 3 years¹.
Bradwell is an area in Buxton, Derbyshire with 125 households², where the most expensive property was sold for £880k.
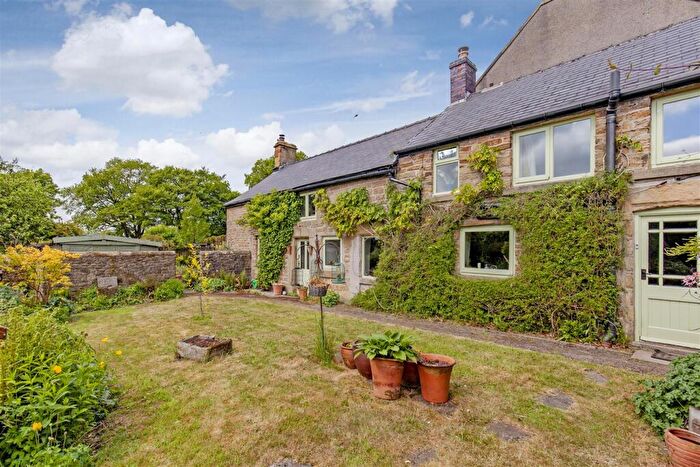
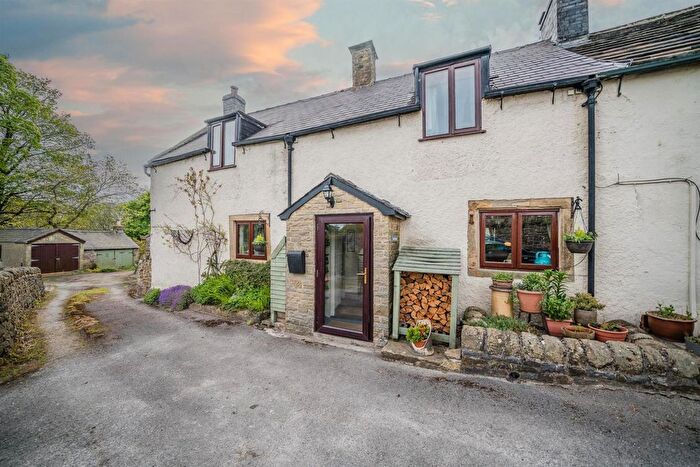
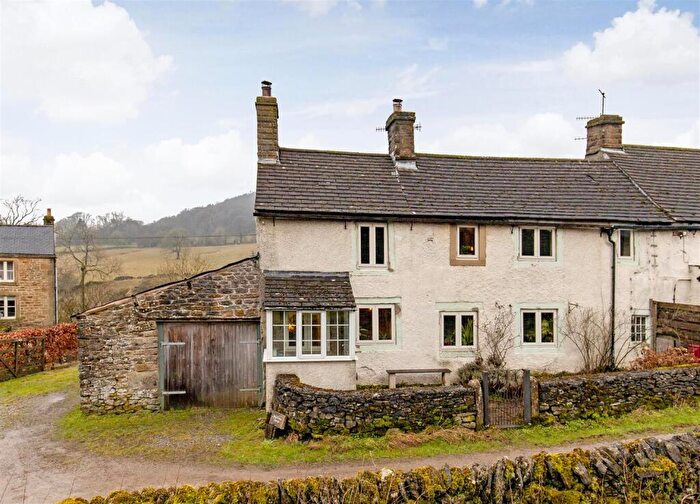
Properties for sale in Bradwell
Previously listed properties in Bradwell
![]()
If you are looking to sell your house, let it out, or receive a property valuation, an expert can help you.
Click the button below to get started.
Roads and Postcodes in Bradwell
Navigate through our locations to find the location of your next house in Bradwell, Buxton for sale or to rent.
| Streets | Postcodes |
|---|---|
| Coplow Dale | SK17 8RS |
| Grindlow | SK17 8RJ |
| Windmill | SK17 8RE |
| SK17 8RL SK17 8RH SK17 8AQ SK17 8RD SK17 8RF SK17 8RG SK17 8RQ SK17 8RR SK17 8RT |
Property price trends in Bradwell
According to the latest Land Registry data, the average home in Bradwell sold for £315,000 in 2026. That figure comes from 99 sales logged over the past 31 years.
Prices have fallen back over the last three years. Compared with 2023, when the typical sale came in around £480,833, that's a fall of roughly 34.5%.
Looking back five years, average prices are down about 20.9% since 2021, a drop of around £83,000 in cash terms.
Zoom out to the past decade for the fuller picture. Back in 2016, homes here averaged £271,033, so the typical sold price has climbed about 16.2% since then, roughly 1.5% a year. Stretch the view to fifteen years and that annual pace eases back to about -1.9%.
Frequently asked questions about Bradwell
What is the average price for a property for sale in Bradwell?
The average price for a property for sale in Bradwell is £497,125. This amount is 76% higher than the average price in Buxton. There are 9 property listings for sale in Bradwell.
What streets have the most expensive properties for sale in Bradwell?
The street with the most expensive properties for sale in Bradwell is Windmill at an average of £675,000.
What streets have the most affordable properties for sale in Bradwell?
The street with the most affordable properties for sale in Bradwell is Grindlow at an average of £394,500.
Which train stations are available in or near Bradwell?
Some of the train stations available in or near Bradwell are Hope (Derbyshire), Bamford and Hathersage.
Property Price Paid in Bradwell by Year
The average sold property price by year was:
| Year | Average Sold Price | Price Change |
Sold Properties
|
|---|---|---|---|
| 2026 | £315,000 | -98% |
1 Property |
| 2025 | £623,166 | 44% |
3 Properties |
| 2024 | £350,000 | -37% |
1 Property |
| 2023 | £480,833 | 17% |
3 Properties |
| 2021 | £398,000 | -24% |
4 Properties |
| 2019 | £494,000 | 28% |
3 Properties |
| 2018 | £354,166 | -21% |
9 Properties |
| 2017 | £428,833 | 37% |
3 Properties |
| 2016 | £271,033 | -48% |
6 Properties |
| 2015 | £399,950 | 17% |
1 Property |
Property Price per Property Type in Bradwell
Here you can find historic sold price data in order to help with your property search.
The average Property Paid Price for specific property types in the last three years are:
| Property Type | Average Sold Price | Sold Properties |
|---|---|---|
| Semi Detached House | £597,250.00 | 2 Semi Detached Houses |
| Terraced House | £315,000.00 | 1 Terraced House |
| Detached House | £493,500.00 | 5 Detached Houses |
