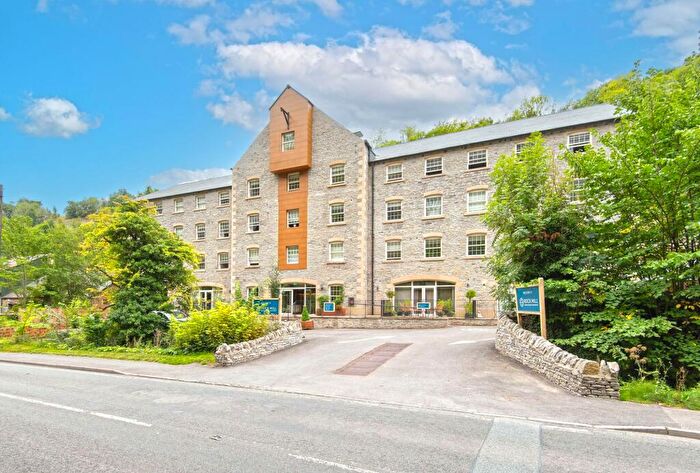
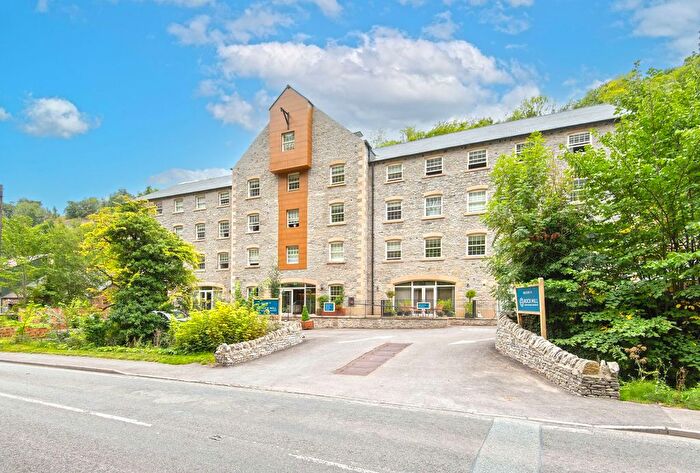
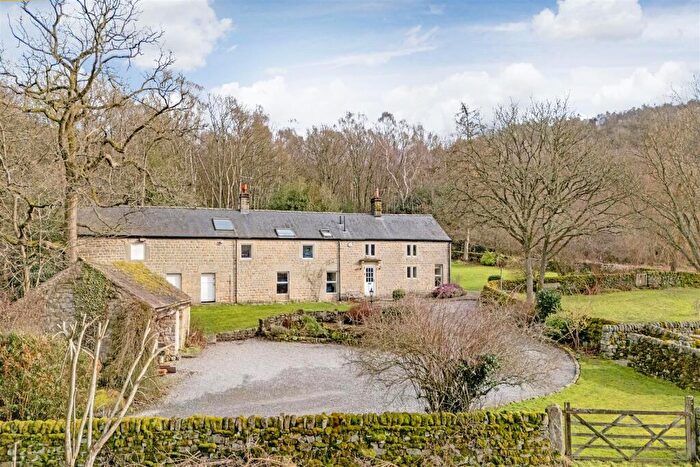
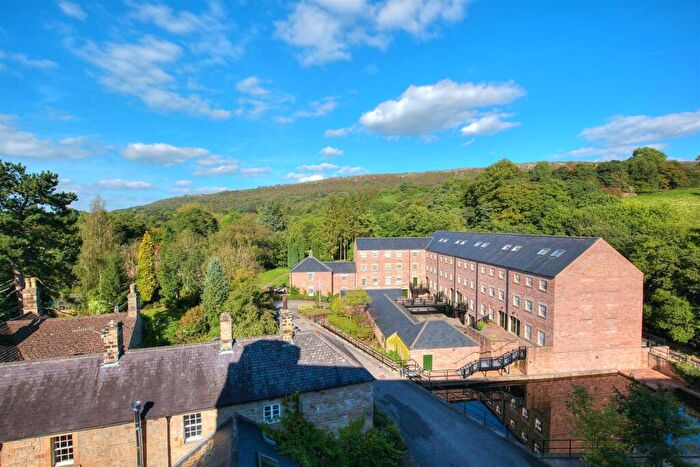
Houses for sale & to rent in Calver, Hope Valley
House Prices in Calver
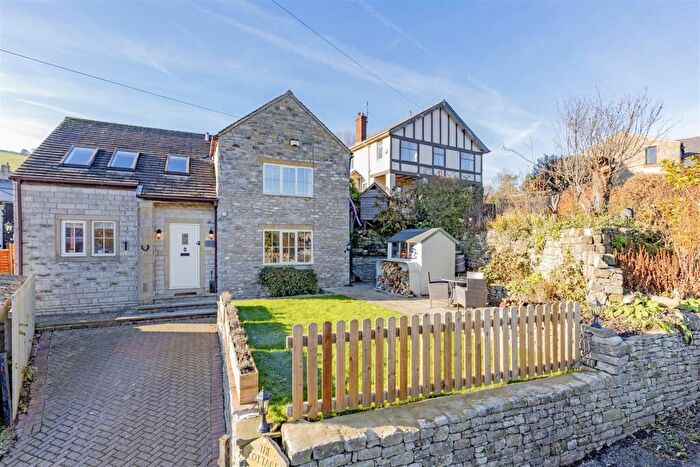
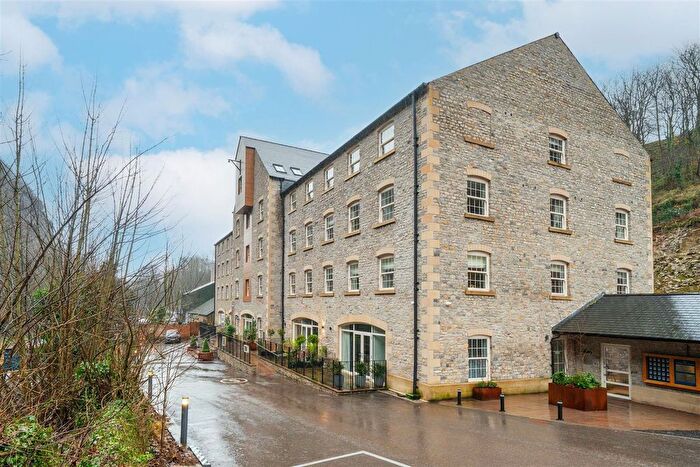
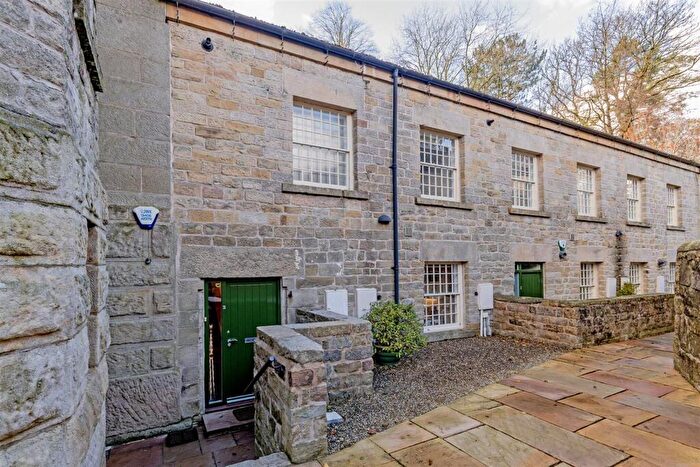
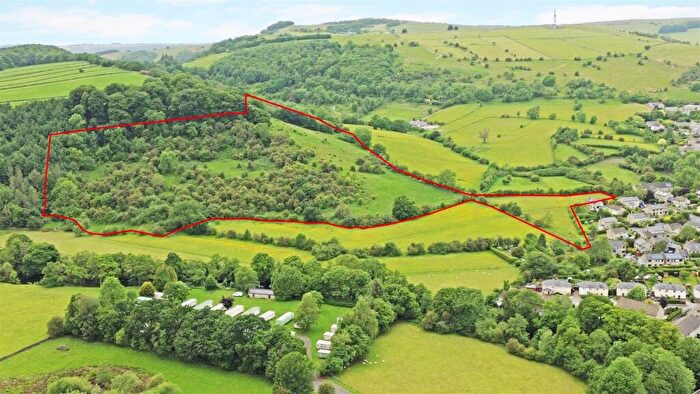
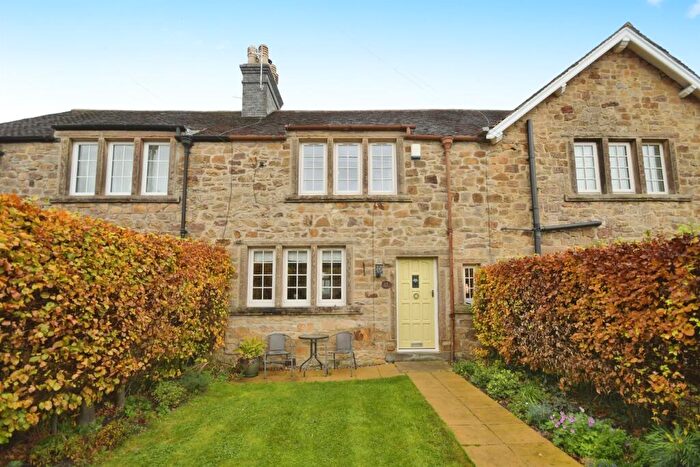
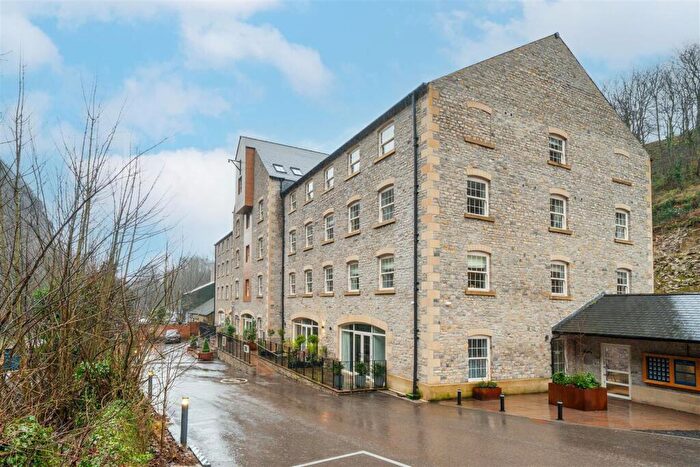
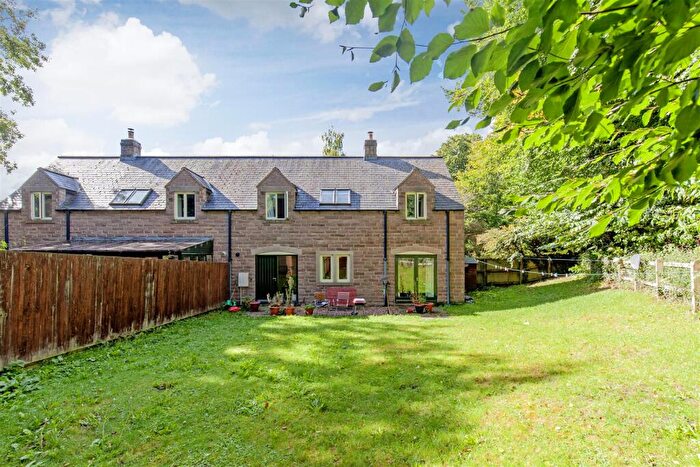
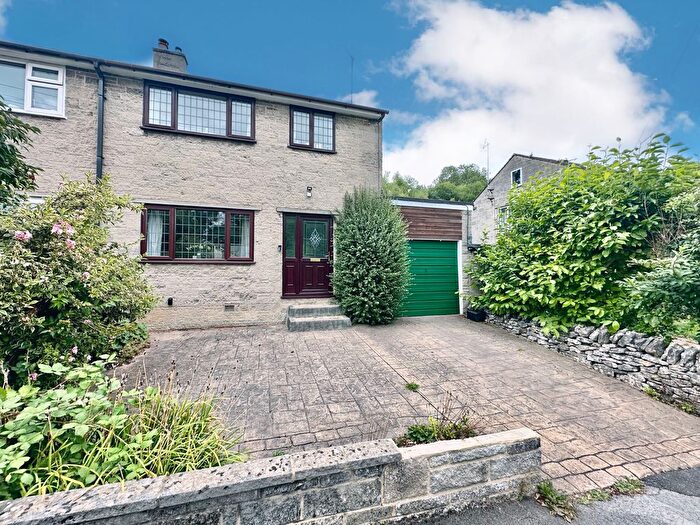
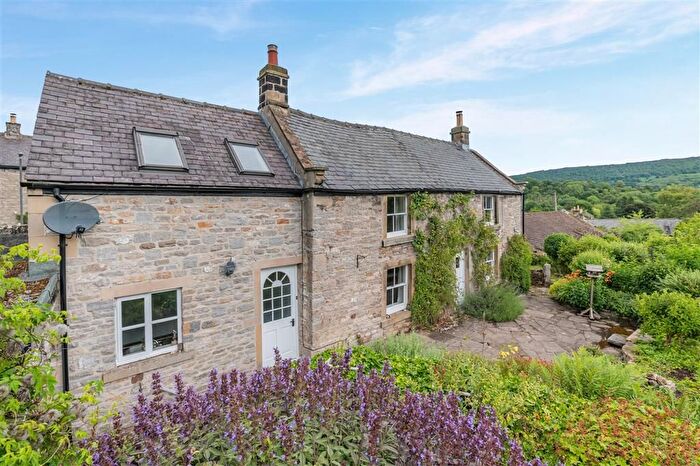
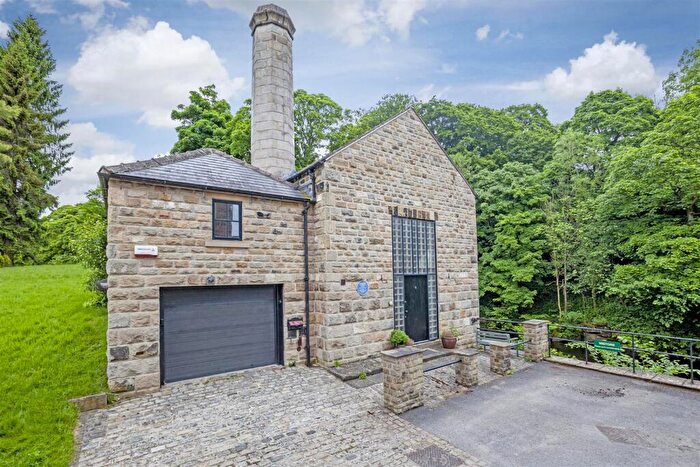
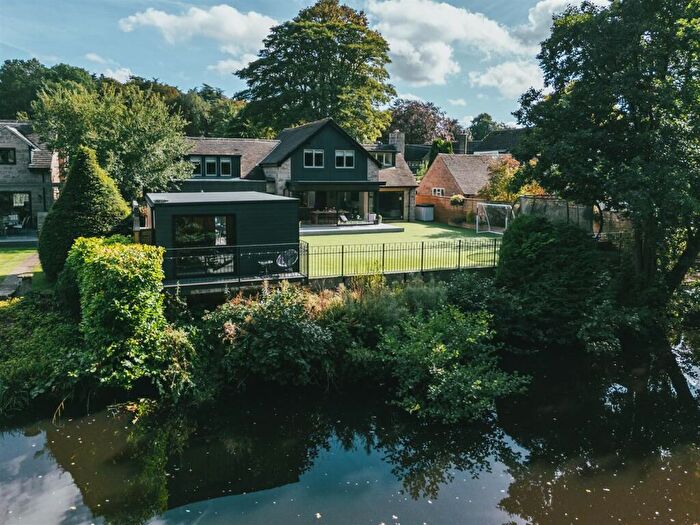
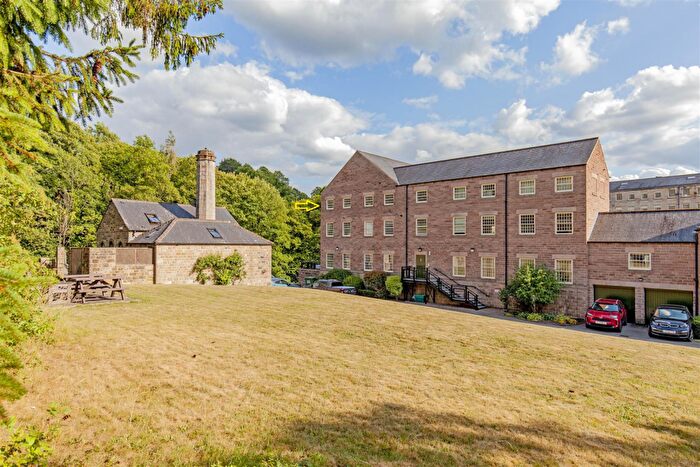
Properties in Calver have an average house price of £533,669.00 and had 83 Property Transactions within the last 3 years¹.
Calver is an area in Hope Valley, Derbyshire with 823 households², where the most expensive property was sold for £1,450,000.00.
Properties for sale in Calver
Previously listed properties in Calver
Roads and Postcodes in Calver
Navigate through our locations to find the location of your next house in Calver, Hope Valley for sale or to rent.
| Streets | Postcodes |
|---|---|
| Avenue Close | S32 4TA |
| Bar Lane | S32 3YA |
| Bar Road | S32 3YB S32 3YR |
| Brook Close | S32 3AD |
| Brookfields | S32 3XB |
| Calver Bridge | S32 3XA |
| Calver Mill | S32 3YU S32 3YY |
| Calver Sough | S32 3XH |
| Chapel Walk | S32 3YQ |
| Cliff Lane | S32 3WD S32 3XD |
| Cornmill Close | S32 3XZ |
| Cross Lane | S32 3XS |
| Curbar Hill | S32 3YE |
| Curbar Lane | S32 3YF |
| Denman Crescent | S32 4TG |
| Dukes Drive | S32 3YP |
| Eaton Fold | S32 4TY |
| Edge View | S32 4UA |
| Edgemount View | S32 3YX |
| Farnsley Lane | S32 4TH |
| Folds Head | S32 3XJ |
| Folds Lane | S32 3AB |
| Froggatt | S32 3ZA S32 3ZH |
| Froggatt Edge | S32 3ZB S32 3ZJ |
| Froggatt Road | S32 3ZD |
| Green Close | S32 3YG |
| Grindleford Road | S32 3XY |
| Hall Fold | S32 3XL |
| Hassop Road | S32 3XN |
| Hay Lane | S32 3ZE |
| Hazel Grove | S32 3WT |
| High Street | S32 3XP S32 4TL |
| Hollowgate | S32 3ZN |
| Low Side | S32 3XQ |
| Lowside Close | S32 3WZ |
| Main Road | S32 4TN S32 4AA |
| Main Street | S32 3XR S32 3AA |
| Meadow Close | S32 4TQ |
| Middleton Lane | S32 4UB |
| Mill Farm Close | S32 3WW |
| Mill Lane | S32 4TS |
| Mill Street | S32 4TT |
| Moorlands Lane | S32 3ZF S32 3ZL |
| New Bridge | S32 3XT |
| Newburgh Terrace | S32 3XU |
| Old Hall Gardens | S32 4TZ |
| Peak View Close | S32 3ZP |
| Pinfold Hill | S32 3YL |
| Riddings Lane | S32 3YN S32 3YS S32 3YT |
| Riverside Close | S32 3WU |
| Riverside Court | S32 3YW |
| Riverside Drive | S32 3XE |
| Smithy Knoll Road | S32 3XW |
| Sough Lane | S32 3WY |
| The Avenue | S32 4TB |
| The Bank | S32 4TD |
| The Bent | S32 3YD |
| The Dale | S32 4TE S32 4TF |
| The Fold | S32 4TJ |
| The Green | S32 3YH |
| The Hillock | S32 3YJ |
| The Nook | S32 4TU |
| Trinkey Lane | S32 4TX |
| Well Green | S32 3XX |
| S32 3XG S32 4WW |
Transport near Calver
-
Grindleford Station
-
Hathersage Station
-
Bamford Station
-
Hope (Derbyshire) Station
-
Dore and Totley Station
-
Dronfield Station
-
Chesterfield Station
-
Edale Station
-
Matlock Station
- FAQ
- Price Paid By Year
- Property Type Price
Frequently asked questions about Calver
What is the average price for a property for sale in Calver?
The average price for a property for sale in Calver is £533,669. This amount is 16% higher than the average price in Hope Valley. There are 192 property listings for sale in Calver.
What streets have the most expensive properties for sale in Calver?
The streets with the most expensive properties for sale in Calver are Pinfold Hill at an average of £1,450,000, Froggatt at an average of £1,206,666 and Riddings Lane at an average of £1,115,000.
What streets have the most affordable properties for sale in Calver?
The streets with the most affordable properties for sale in Calver are Main Road at an average of £230,000, Avenue Close at an average of £265,000 and Mill Street at an average of £275,000.
Which train stations are available in or near Calver?
Some of the train stations available in or near Calver are Grindleford, Hathersage and Bamford.
Property Price Paid in Calver by Year
The average sold property price by year was:
| Year | Average Sold Price | Price Change |
Sold Properties
|
|---|---|---|---|
| 2025 | £430,275 | -45% |
20 Properties |
| 2024 | £624,583 | 18% |
30 Properties |
| 2023 | £513,683 | 5% |
33 Properties |
| 2022 | £488,468 | 14% |
27 Properties |
| 2021 | £419,108 | 3% |
30 Properties |
| 2020 | £406,253 | -2% |
25 Properties |
| 2019 | £415,821 | -5% |
31 Properties |
| 2018 | £438,581 | 3% |
19 Properties |
| 2017 | £426,777 | 2% |
34 Properties |
| 2016 | £418,838 | 15% |
39 Properties |
| 2015 | £355,187 | -33% |
27 Properties |
| 2014 | £473,928 | 26% |
32 Properties |
| 2013 | £350,801 | -9% |
28 Properties |
| 2012 | £381,446 | 12% |
34 Properties |
| 2011 | £337,400 | -13% |
10 Properties |
| 2010 | £382,164 | 9% |
27 Properties |
| 2009 | £349,168 | -3% |
22 Properties |
| 2008 | £360,751 | 3% |
22 Properties |
| 2007 | £348,970 | 7% |
37 Properties |
| 2006 | £323,547 | 9% |
46 Properties |
| 2005 | £293,592 | -6% |
21 Properties |
| 2004 | £310,309 | 12% |
37 Properties |
| 2003 | £272,843 | 33% |
31 Properties |
| 2002 | £183,251 | -4% |
38 Properties |
| 2001 | £189,768 | -8% |
40 Properties |
| 2000 | £204,410 | 19% |
57 Properties |
| 1999 | £166,345 | 11% |
21 Properties |
| 1998 | £147,662 | 21% |
27 Properties |
| 1997 | £116,818 | -15% |
29 Properties |
| 1996 | £134,901 | 17% |
31 Properties |
| 1995 | £111,617 | - |
20 Properties |
Property Price per Property Type in Calver
Here you can find historic sold price data in order to help with your property search.
The average Property Paid Price for specific property types in the last three years are:
| Property Type | Average Sold Price | Sold Properties |
|---|---|---|
| Semi Detached House | £341,576.00 | 13 Semi Detached Houses |
| Detached House | £686,680.00 | 47 Detached Houses |
| Terraced House | £302,292.00 | 13 Terraced Houses |
| Flat | £365,025.00 | 10 Flats |

