
Houses for sale in Chatsworth, Bakewell
House Prices in Chatsworth
Properties in Chatsworth have an average house price of £642k and had 67 Property Transactions within the last 3 years¹.
Chatsworth is an area in Bakewell, Derbyshire with 652 households², where the most expensive property was sold for £2M.
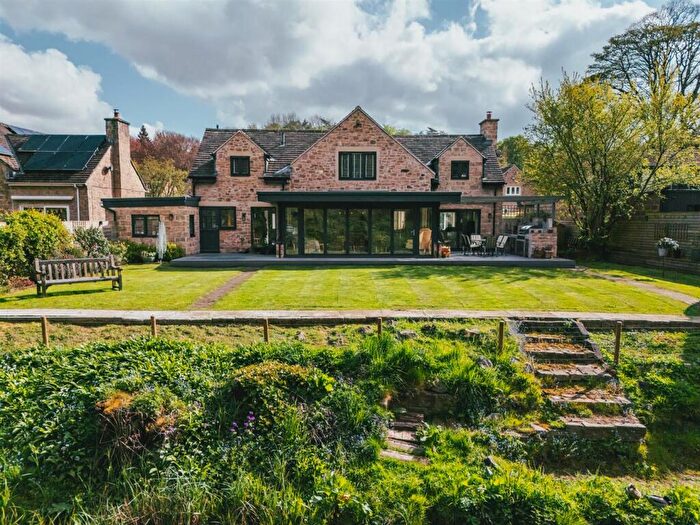
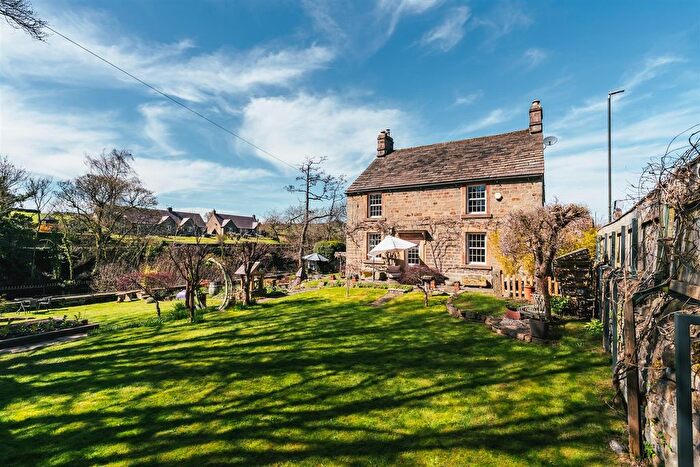
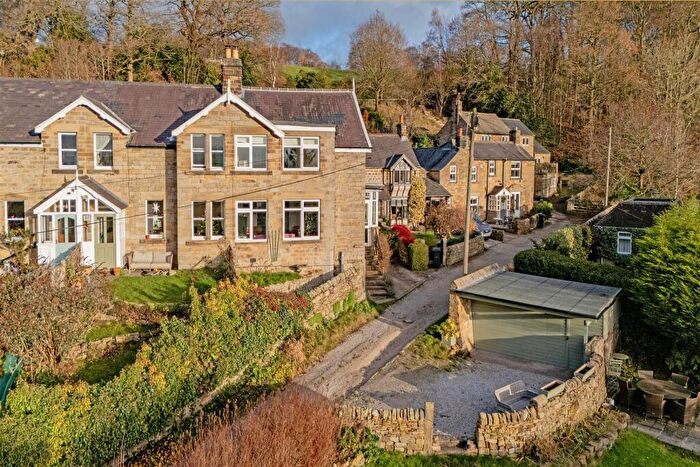
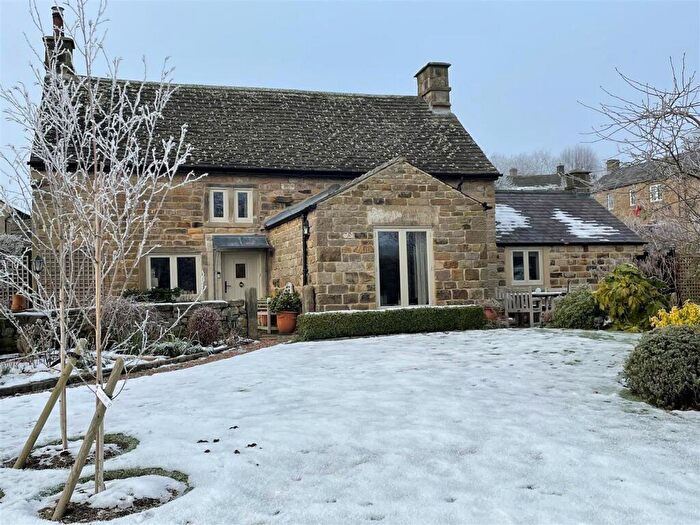
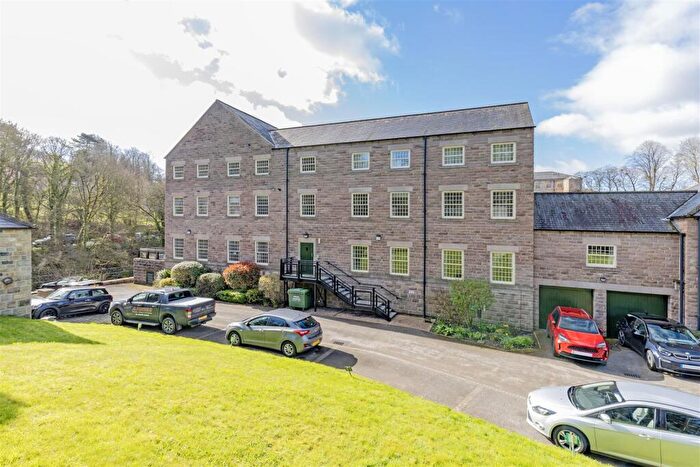
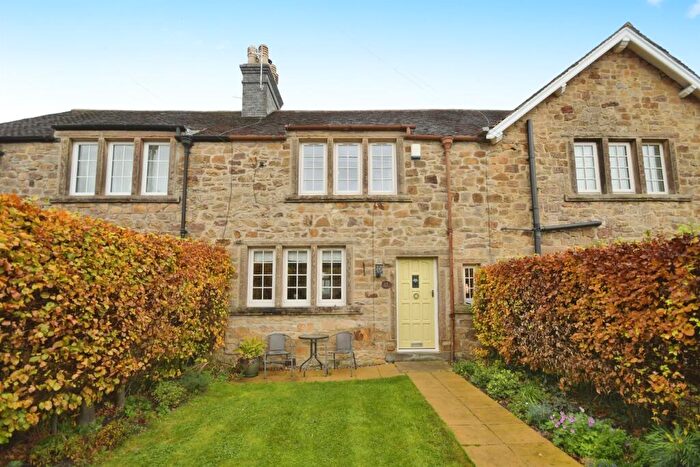
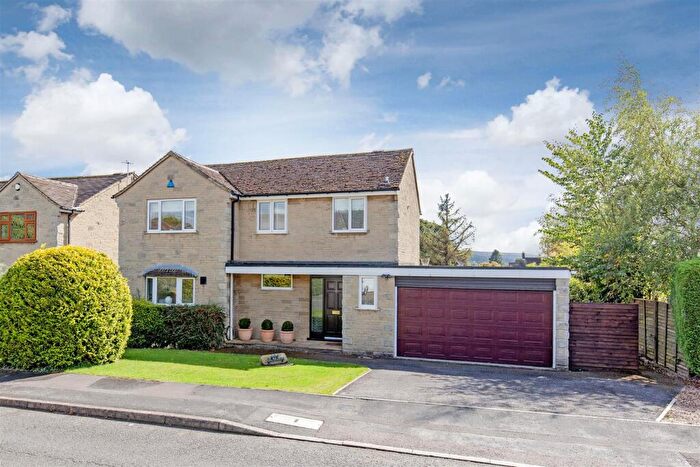
Properties for sale in Chatsworth
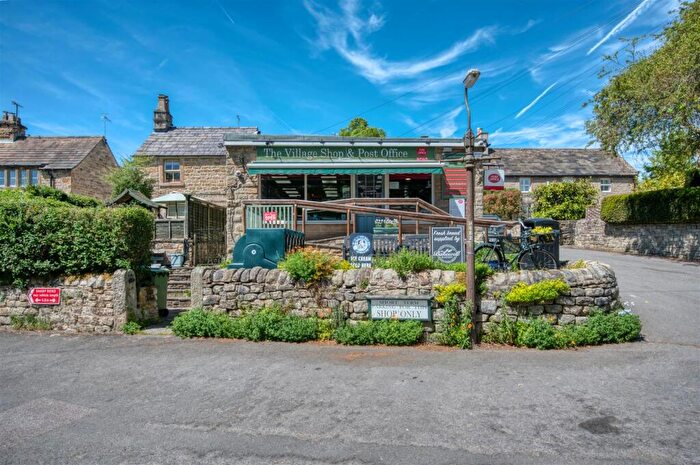
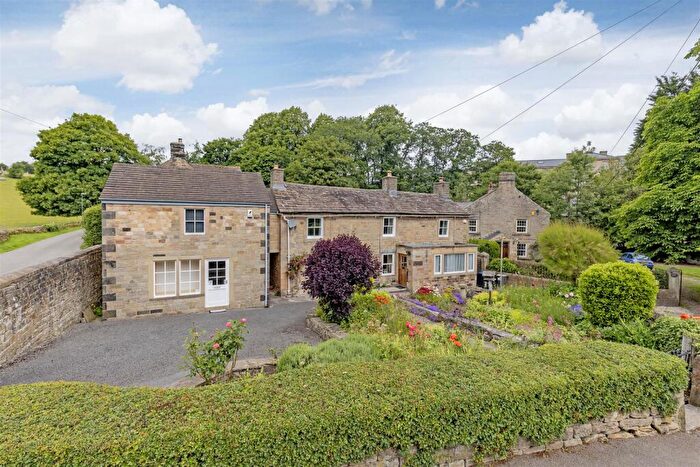
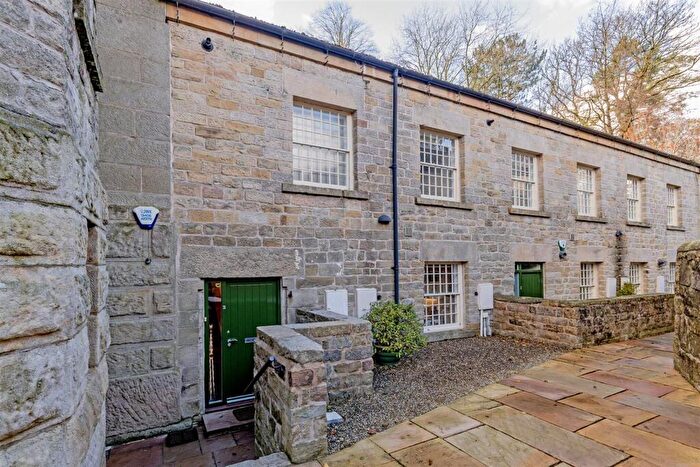
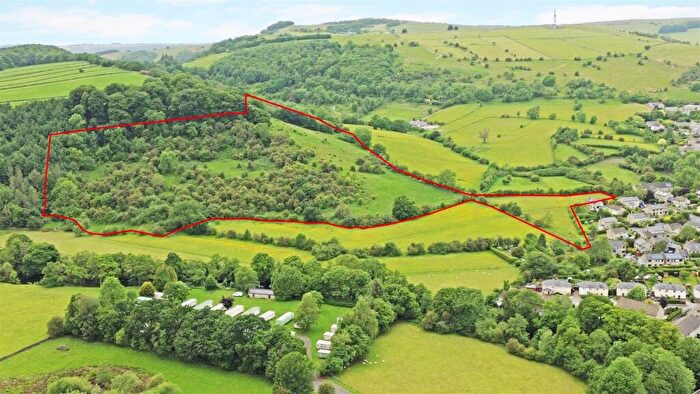
![]()
If you are looking to sell your house, let it out, or receive a property valuation, an expert can help you.
Click the button below to get started.
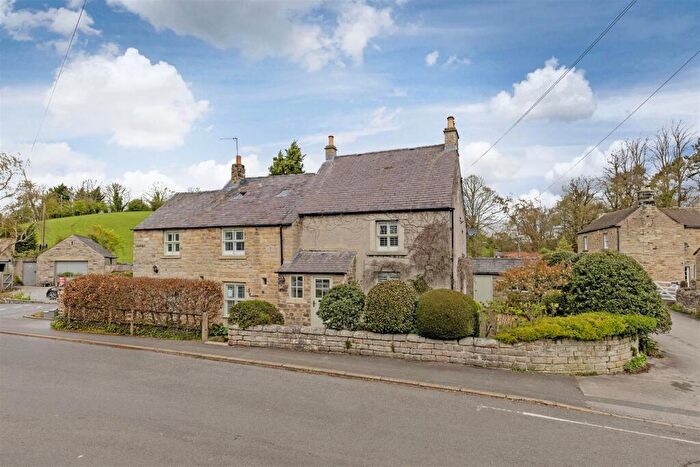
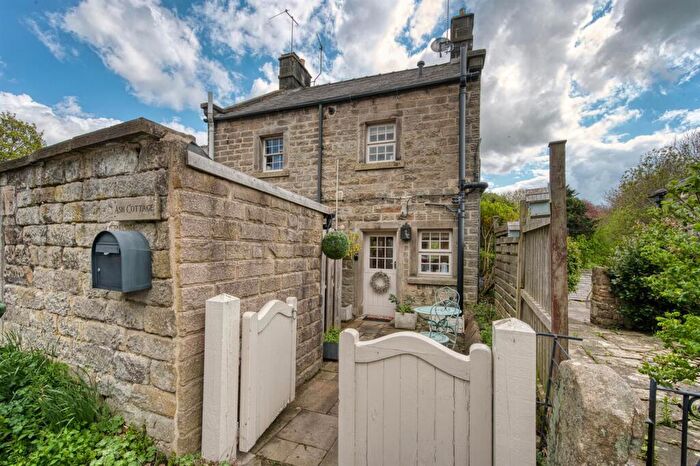
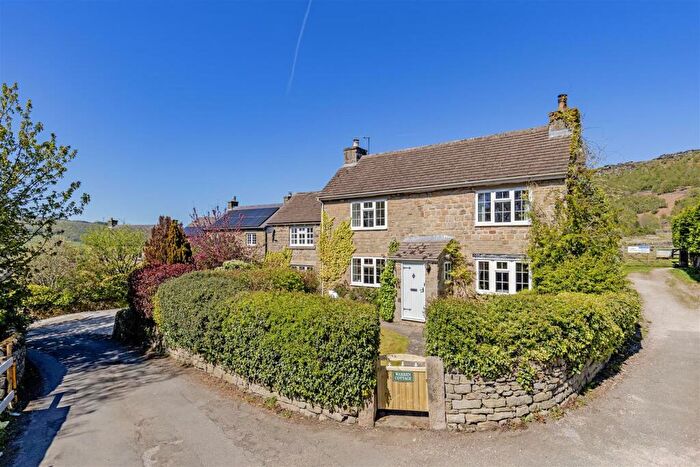
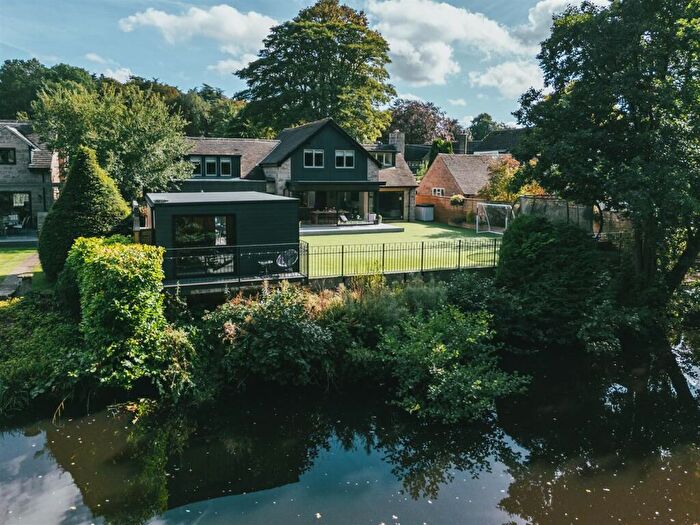
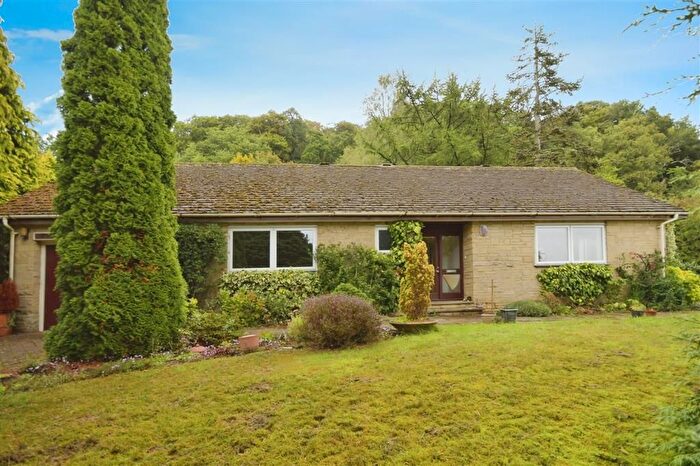
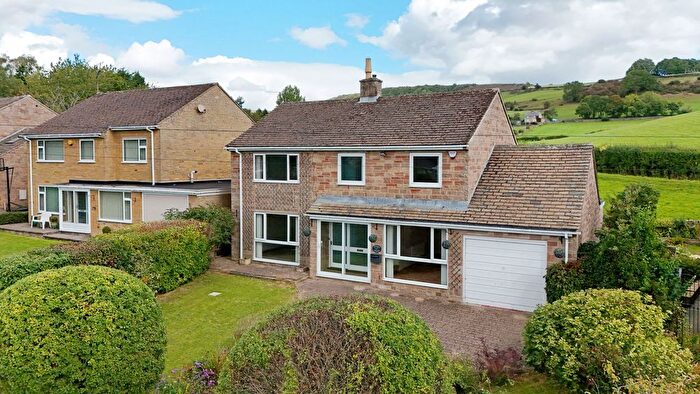
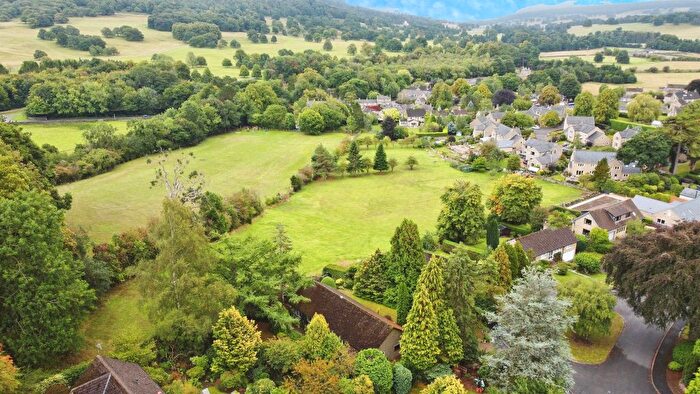
Previously listed properties in Chatsworth
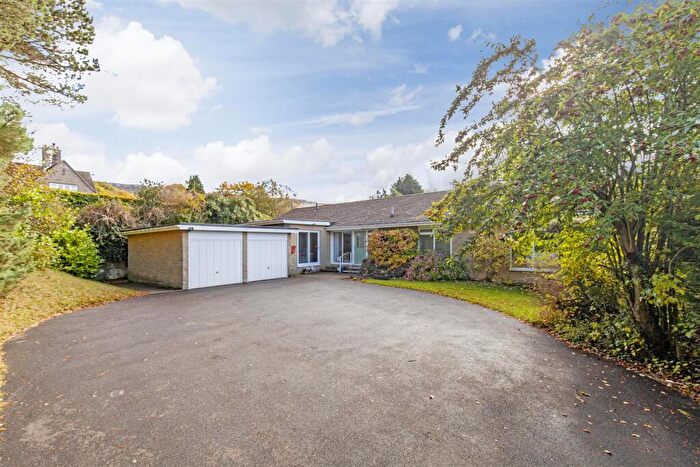
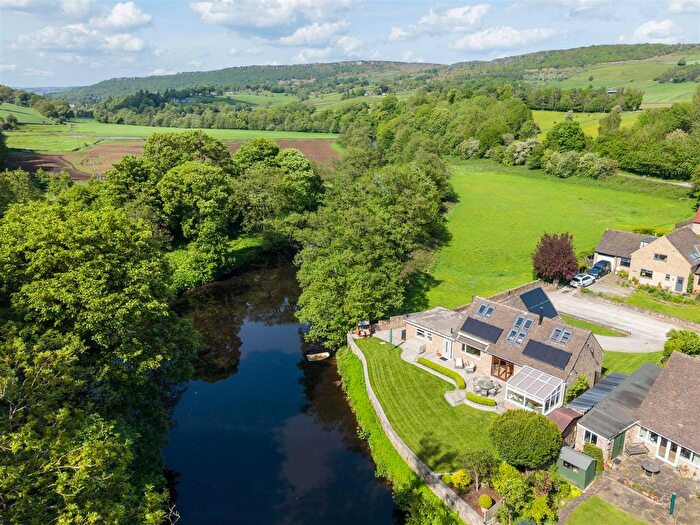
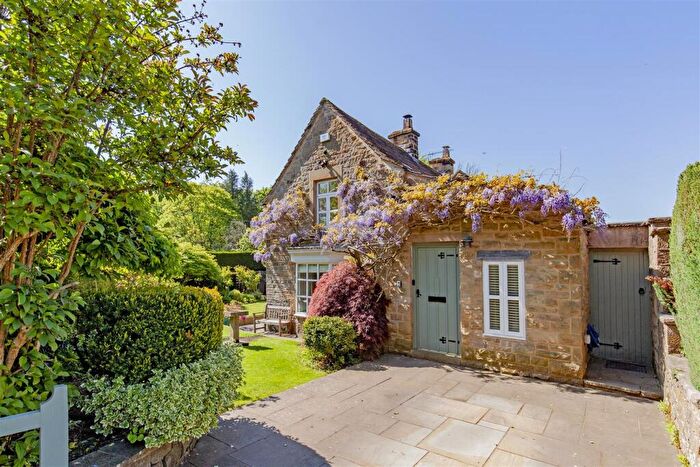
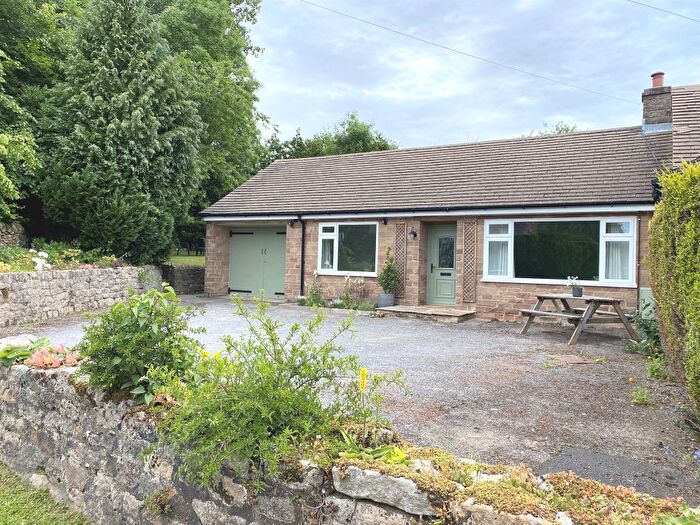
![]()
If you are looking to sell your house, let it out, or receive a property valuation, an expert can help you.
Click the button below to get started.
Roads and Postcodes in Chatsworth
Navigate through our locations to find the location of your next house in Chatsworth, Bakewell for sale or to rent.
| Streets | Postcodes |
|---|---|
| Bakewell Road | DE45 1RE |
| Bar Road | DE45 1SF |
| Bubnell Lane | DE45 1RN DE45 1RJ DE45 1RL |
| Bun Alley | DE45 1UH |
| Calver Road | DE45 1RD DE45 1RP DE45 1RR |
| Chatsworth Road | DE45 1PG |
| Chesterfield Road | DE45 1PQ |
| Church Lane | DE45 1HS DE45 1SP |
| Church Street | DE45 1RY |
| Church View Drive | DE45 1RA |
| Derwent Drive | DE45 1RS |
| Duck Row | DE45 1UJ |
| Eaton Drive | DE45 1SE |
| Eaton Hill | DE45 1SB |
| Eaton Place | DE45 1RW |
| Elizabeth Court | DE45 1RX |
| Goose Green View | DE45 1RU |
| Gorse Bank Lane | DE45 1PS DE45 1SD DE45 1SG |
| Gorse Ridge Drive | DE45 1SL |
| High Street | DE45 1UL |
| Hydro Close | DE45 1SH |
| Low Meadows | DE45 1GX |
| Nether End | DE45 1SR |
| Old Brampton Road | DE45 1PU |
| Over Lane | DE45 1RT DE45 1SA |
| Over Road | DE45 1PL |
| Park Lane | DE45 1SS |
| Pilsley Lane | DE45 1PF |
| Royal Croft Drive | DE45 1SN |
| School Lane | DE45 1RZ |
| Sheffield Road | DE45 1PR |
| South View | DE45 1UG |
| St Annes Close | DE45 1RB |
| Stoney Furlong Road | DE45 1ST |
| West End | DE45 1RG |
| Wheatlands Lane | DE45 1RF |
| White Edge Drive | DE45 1SJ |
| White Lodge Lane | DE45 1RQ |
| DE45 1EX DE45 1PJ DE45 1PH DE45 1PN DE45 1PP DE45 1UF |
Property price trends in Chatsworth
According to the latest Land Registry data, the average home in Chatsworth sold for £770,000 in 2026. That figure comes from 656 sales logged over the past 31 years.
Prices have continued to climb over the last three years. Compared with 2023, when the typical sale came in around £661,178, that's a rise of roughly 16.5%.
Looking back five years, average prices are up about 14.3% since 2021, a gain of around £96,431 in cash terms.
Zoom out to the past decade for the fuller picture. Back in 2016, homes here averaged £417,331, so the typical sold price has climbed about 84.5% since then, roughly 6.3% a year. Stretch the view to fifteen years and that annual pace eases back to about 3.7%.
Frequently asked questions about Chatsworth
What is the average price for a property for sale in Chatsworth?
The average price for a property for sale in Chatsworth is £641,899. This amount is 40% higher than the average price in Bakewell. There are 119 property listings for sale in Chatsworth.
What streets have the most expensive properties for sale in Chatsworth?
The streets with the most expensive properties for sale in Chatsworth are Bar Road at an average of £1,425,000, Eaton Hill at an average of £1,068,748 and Gorse Bank Lane at an average of £971,666.
What streets have the most affordable properties for sale in Chatsworth?
The streets with the most affordable properties for sale in Chatsworth are Bakewell Road at an average of £275,000, West End at an average of £356,666 and Calver Road at an average of £378,000.
Which train stations are available in or near Chatsworth?
Some of the train stations available in or near Chatsworth are Grindleford, Hathersage and Bamford.
Property Price Paid in Chatsworth by Year
The average sold property price by year was:
| Year | Average Sold Price | Price Change |
Sold Properties
|
|---|---|---|---|
| 2026 | £770,000 | 29% |
3 Properties |
| 2025 | £548,015 | -22% |
16 Properties |
| 2024 | £670,800 | 1% |
20 Properties |
| 2023 | £661,178 | 17% |
28 Properties |
| 2022 | £550,055 | -22% |
9 Properties |
| 2021 | £673,569 | 34% |
28 Properties |
| 2020 | £443,721 | -22% |
12 Properties |
| 2019 | £539,865 | 14% |
23 Properties |
| 2018 | £466,439 | 3% |
26 Properties |
| 2017 | £451,236 | 8% |
19 Properties |
Property Price per Property Type in Chatsworth
Here you can find historic sold price data in order to help with your property search.
The average Property Paid Price for specific property types in the last three years are:
| Property Type | Average Sold Price | Sold Properties |
|---|---|---|
| Semi Detached House | £386,035.00 | 14 Semi Detached Houses |
| Detached House | £854,813.00 | 39 Detached Houses |
| Terraced House | £379,687.00 | 8 Terraced Houses |
| Flat | £204,583.00 | 6 Flats |
