Houses for sale & to rent in Ilkeston Central, Ilkeston
House Prices in Ilkeston Central
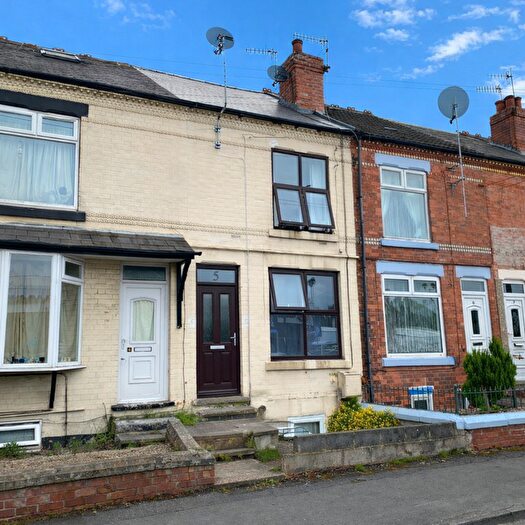
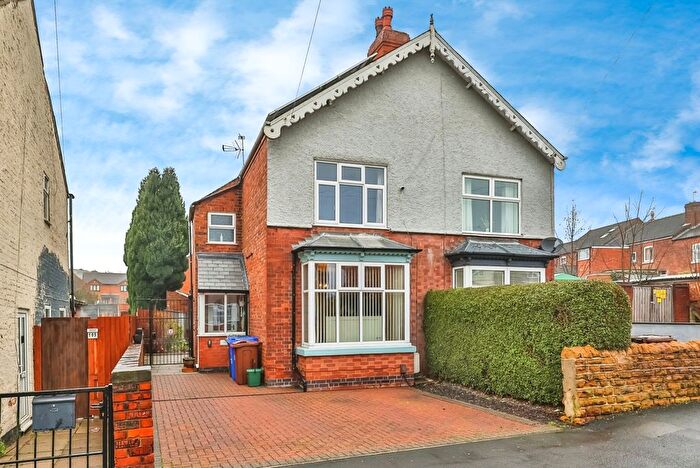
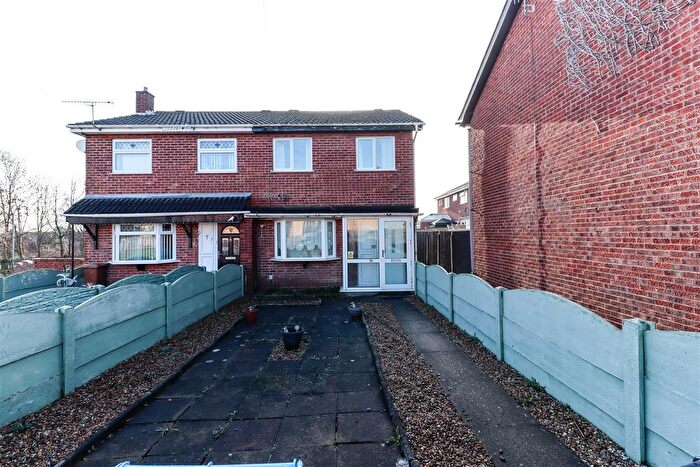
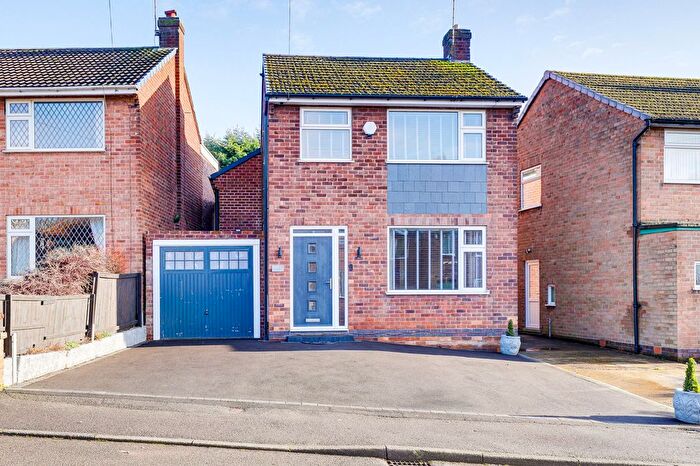
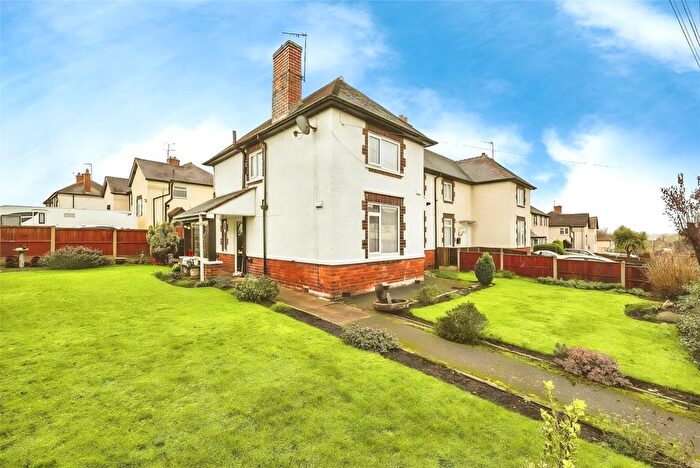
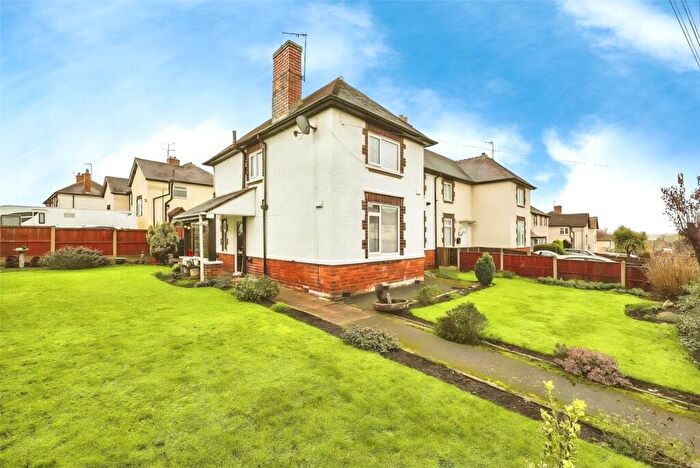
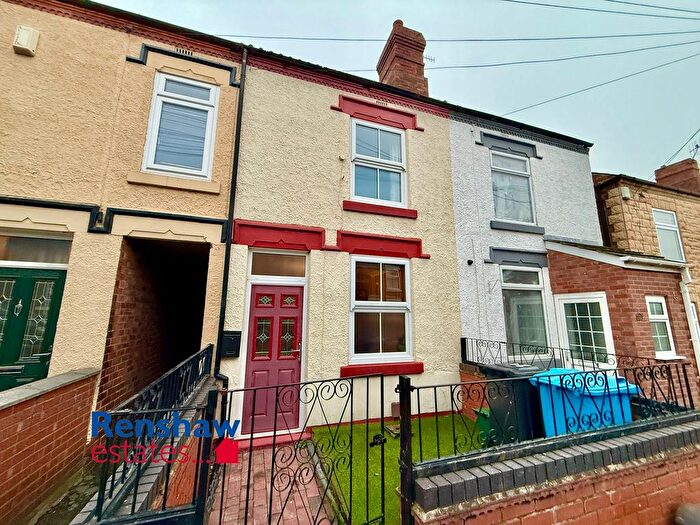
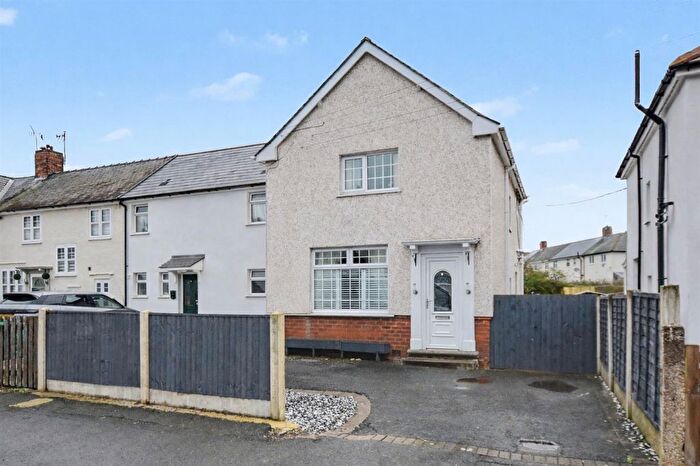
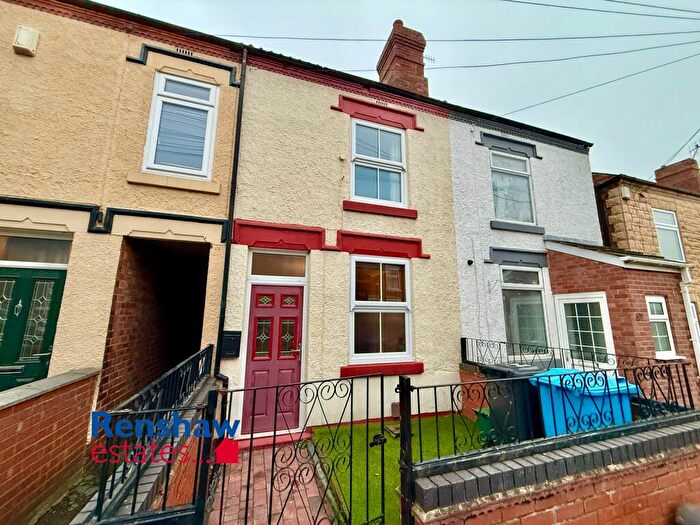
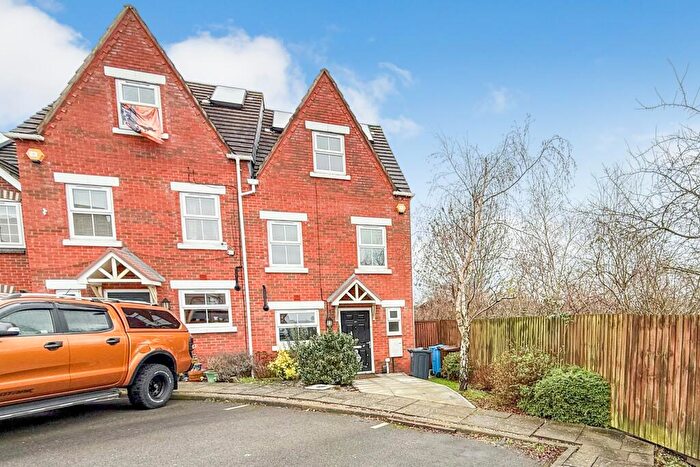
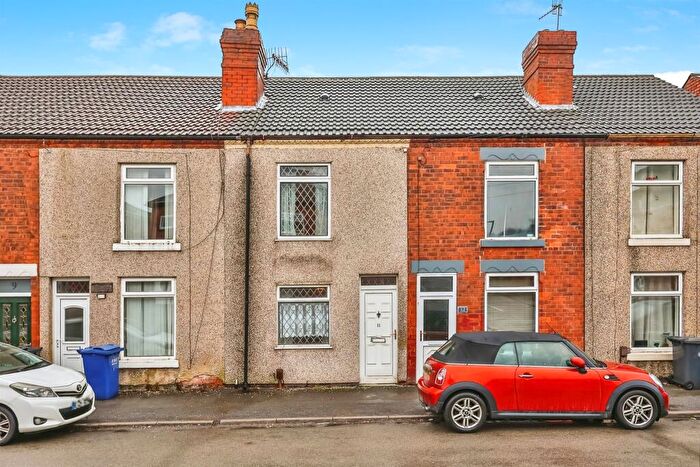
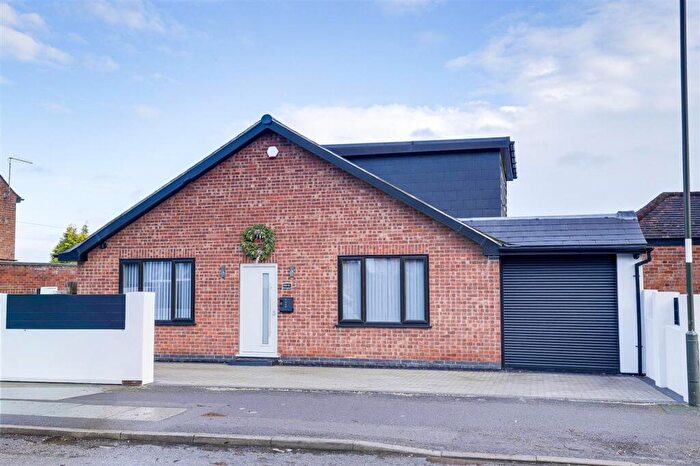
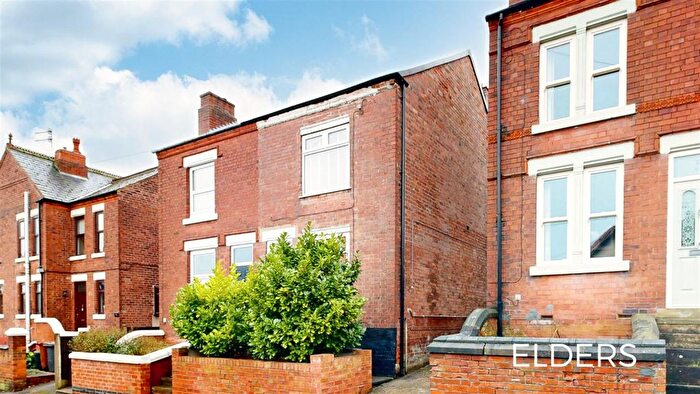
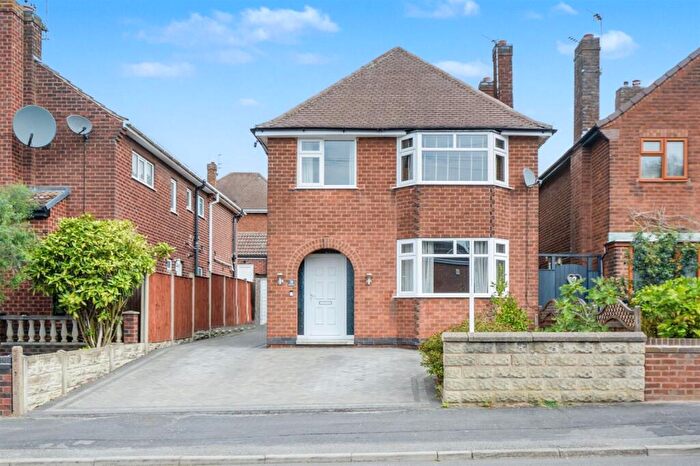
Properties in Ilkeston Central have an average house price of £151,722.00 and had 266 Property Transactions within the last 3 years¹.
Ilkeston Central is an area in Ilkeston, Derbyshire with 2,123 households², where the most expensive property was sold for £435,000.00.
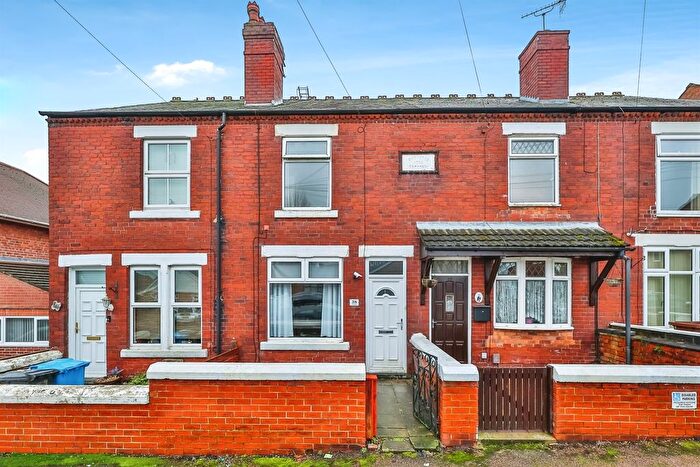
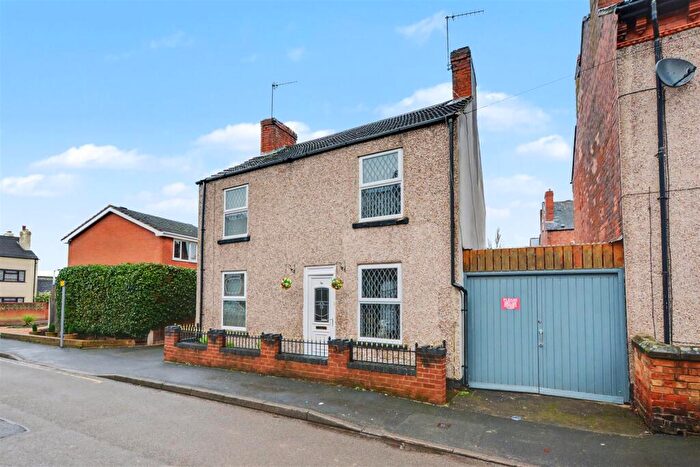
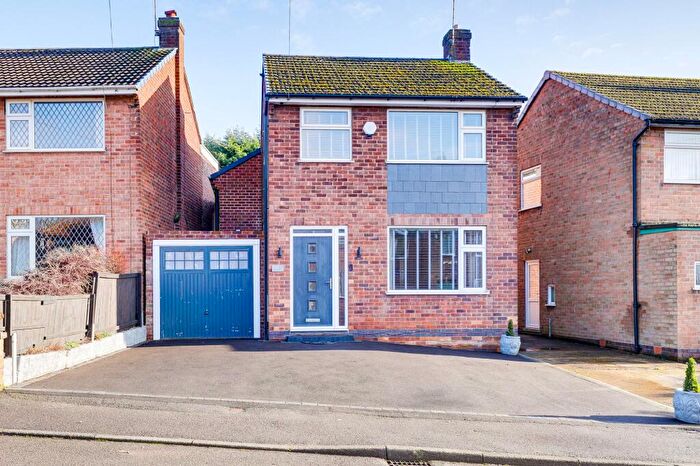
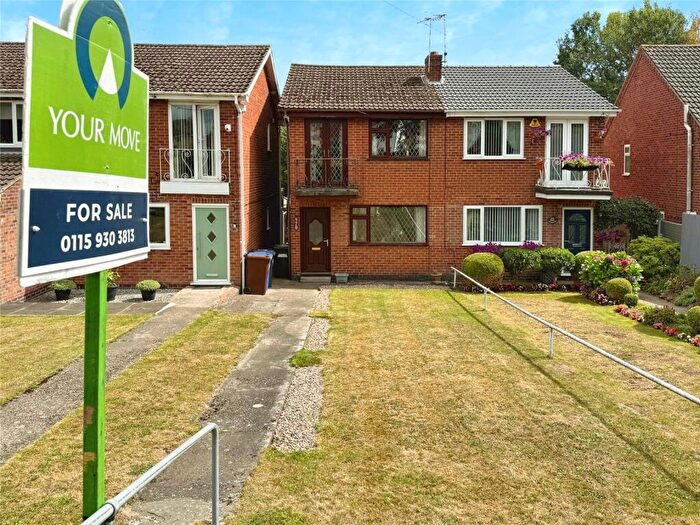
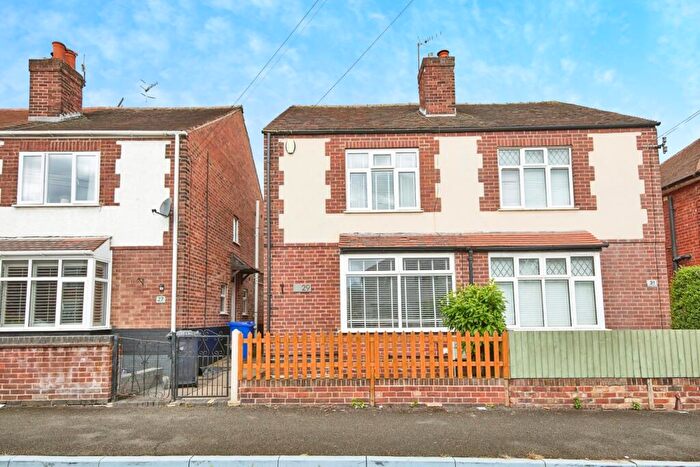
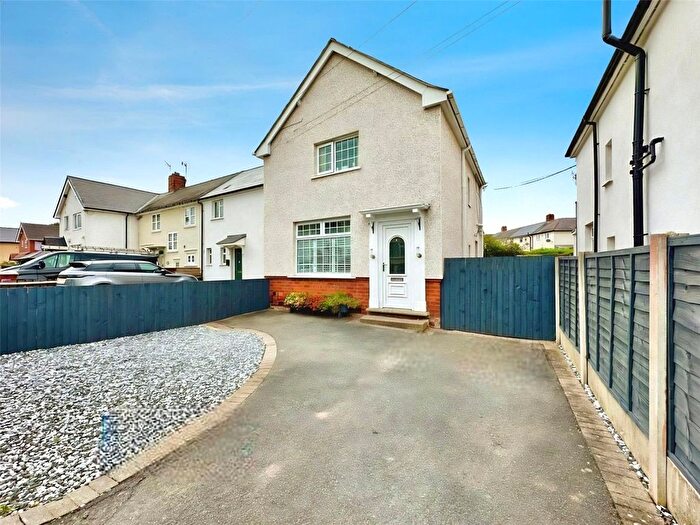
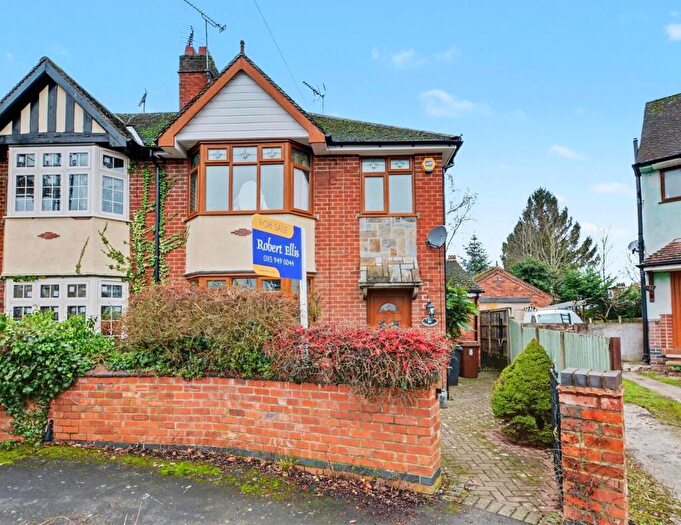
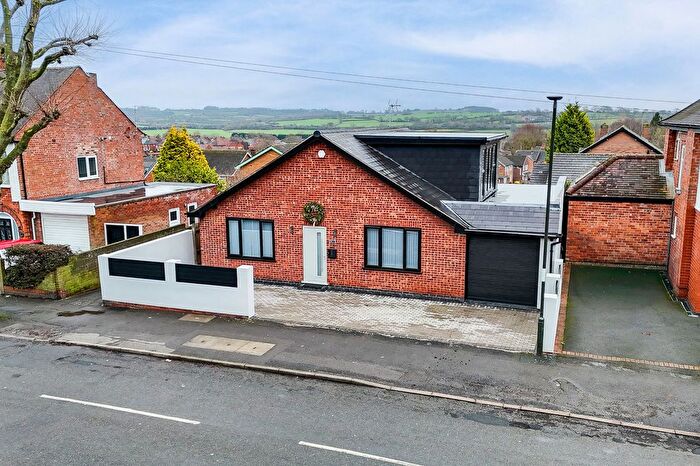
Properties for sale in Ilkeston Central
Roads and Postcodes in Ilkeston Central
Navigate through our locations to find the location of your next house in Ilkeston Central, Ilkeston for sale or to rent.
| Streets | Postcodes |
|---|---|
| Albert Villas | DE7 5TD |
| Albion Terrace | DE7 8FS |
| Allison Gardens | DE7 5LZ |
| Alvenor Street | DE7 5LR |
| Amilda Avenue | DE7 5DB |
| Awsworth Road | DE7 8HX DE7 8JF |
| Barker Gate | DE7 8DS |
| Bath Street | DE7 8FB DE7 8FD DE7 8FE DE7 8FF |
| Blake Street | DE7 8GP |
| Bloomsgrove Road | DE7 8DQ |
| Boatmans Close | DE7 8LT |
| Brook Cottages | DE7 8JS |
| Brussells Terrace | DE7 8FG |
| Burr Lane | DE7 5JD |
| Byron Street | DE7 5JG |
| Canal Side | DE7 8JT |
| Canal Street | DE7 8GR |
| Canning Mews | DE7 5BS |
| Cantelupe Road | DE7 5HT DE7 5HU DE7 5LU |
| Chalons Close | DE7 5PX |
| Chapel Street | DE7 5JR |
| Chaucer Street | DE7 5JJ |
| Chichester Close | DE7 5EW |
| Coronation Street | DE7 5QH |
| Cranmer Street | DE7 5JH |
| Critchley Street | DE7 8GB |
| Digby Street | DE7 5TG |
| Disraeli Crescent | DE7 5BU |
| Doris Road | DE7 5DP |
| East Street | DE7 5JB |
| Farfield Road | DE7 5LT |
| Farm Close | DE7 5ET |
| Flamstead Road | DE7 5LS |
| Gladstone Street | DE7 5QS DE7 5QY |
| Gordon Street | DE7 5LQ |
| Granby Street | DE7 8HN |
| Gresley Road | DE7 5LX |
| Halfacre Gardens | DE7 8HB |
| Hallcroft Road | DE7 5QL |
| Heathfield Avenue | DE7 5ED DE7 5EH DE7 5EL |
| John Street | DE7 8GL |
| King Street | DE7 5JQ DE7 8GJ |
| Lee Crescent | DE7 5EF |
| Lower Chapel Street | DE7 5JN |
| Lower Granby Street | DE7 8DJ |
| Manning View | DE7 8HZ |
| Margaret Avenue | DE7 5DD |
| Market Street | DE7 5QU DE7 5RB DE7 5RD |
| Mill Street | DE7 8GG DE7 8GH DE7 8GQ |
| Millfield Road | DE7 5DJ DE7 5DL |
| Monks Close | DE7 5EY |
| Mundy Street | DE7 8DH |
| Northgate Street | DE7 8FR |
| Palmerston Road | DE7 5BW |
| Park Avenue | DE7 5DH |
| Park Road | DE7 5BQ DE7 5DF DE7 5DQ |
| Potters Way | DE7 5EX |
| Redland Close | DE7 8LR |
| Rigley Avenue | DE7 5LW |
| Rope Walk | DE7 5HX |
| Rupert Street | DE7 5LP |
| Rutland Street | DE7 8DG |
| Spring Garden Terrace | DE7 8HW |
| Springfield Gardens | DE7 8HY DE7 8JA |
| Stamford Street | DE7 8FL |
| Station Road | DE7 5LD DE7 5LE DE7 5LG DE7 5LH DE7 5LJ DE7 5LL |
| Station Street | DE7 5TE |
| Sudbury Avenue | DE7 5EA |
| Taylor Street | DE7 5JP |
| Tressall Close | DE7 5EN |
| Vincent Avenue | DE7 5DE |
| Wentworth Street | DE7 5TF |
| West Terrace | DE7 8GA |
| Wilton Place | DE7 8FW |
| Wilton Street | DE7 8FT |
| Winchester Crescent | DE7 5EJ |
| Wood Street | DE7 8GE |
| Wortley Close | DE7 5EU |
Transport near Ilkeston Central
- FAQ
- Price Paid By Year
- Property Type Price
Frequently asked questions about Ilkeston Central
What is the average price for a property for sale in Ilkeston Central?
The average price for a property for sale in Ilkeston Central is £151,722. This amount is 27% lower than the average price in Ilkeston. There are 1,917 property listings for sale in Ilkeston Central.
What streets have the most expensive properties for sale in Ilkeston Central?
The streets with the most expensive properties for sale in Ilkeston Central are Park Avenue at an average of £350,000, Winchester Crescent at an average of £269,750 and Halfacre Gardens at an average of £252,000.
What streets have the most affordable properties for sale in Ilkeston Central?
The streets with the most affordable properties for sale in Ilkeston Central are Market Street at an average of £54,750, Northgate Street at an average of £79,166 and Cranmer Street at an average of £88,000.
Which train stations are available in or near Ilkeston Central?
Some of the train stations available in or near Ilkeston Central are Ilkeston, Langley Mill and Bulwell.
Property Price Paid in Ilkeston Central by Year
The average sold property price by year was:
| Year | Average Sold Price | Price Change |
Sold Properties
|
|---|---|---|---|
| 2025 | £156,072 | 8% |
86 Properties |
| 2024 | £144,240 | -8% |
98 Properties |
| 2023 | £156,101 | 11% |
82 Properties |
| 2022 | £138,552 | -3% |
115 Properties |
| 2021 | £142,476 | 12% |
111 Properties |
| 2020 | £124,793 | 16% |
99 Properties |
| 2019 | £105,091 | -11% |
114 Properties |
| 2018 | £116,854 | 10% |
100 Properties |
| 2017 | £105,744 | 5% |
98 Properties |
| 2016 | £100,800 | 3% |
79 Properties |
| 2015 | £97,802 | 8% |
96 Properties |
| 2014 | £90,045 | 2% |
90 Properties |
| 2013 | £88,066 | -5% |
67 Properties |
| 2012 | £92,261 | 8% |
59 Properties |
| 2011 | £84,518 | -5% |
59 Properties |
| 2010 | £88,452 | 3% |
77 Properties |
| 2009 | £86,094 | -18% |
47 Properties |
| 2008 | £101,932 | -9% |
74 Properties |
| 2007 | £111,505 | 7% |
158 Properties |
| 2006 | £103,706 | 1% |
178 Properties |
| 2005 | £102,819 | 18% |
166 Properties |
| 2004 | £83,812 | 19% |
115 Properties |
| 2003 | £67,978 | 20% |
125 Properties |
| 2002 | £54,381 | 23% |
150 Properties |
| 2001 | £41,672 | 12% |
100 Properties |
| 2000 | £36,607 | -3% |
71 Properties |
| 1999 | £37,849 | 20% |
89 Properties |
| 1998 | £30,184 | -19% |
89 Properties |
| 1997 | £35,783 | 1% |
96 Properties |
| 1996 | £35,478 | 12% |
72 Properties |
| 1995 | £31,136 | - |
83 Properties |
Property Price per Property Type in Ilkeston Central
Here you can find historic sold price data in order to help with your property search.
The average Property Paid Price for specific property types in the last three years are:
| Property Type | Average Sold Price | Sold Properties |
|---|---|---|
| Semi Detached House | £179,726.00 | 65 Semi Detached Houses |
| Detached House | £246,650.00 | 40 Detached Houses |
| Terraced House | £121,637.00 | 137 Terraced Houses |
| Flat | £89,395.00 | 24 Flats |

