Houses for sale & to rent in Little Hallam, Ilkeston
House Prices in Little Hallam
Properties in Little Hallam have an average house price of £207,015.00 and had 182 Property Transactions within the last 3 years¹.
Little Hallam is an area in Ilkeston, Derbyshire with 1,766 households², where the most expensive property was sold for £829,000.00.
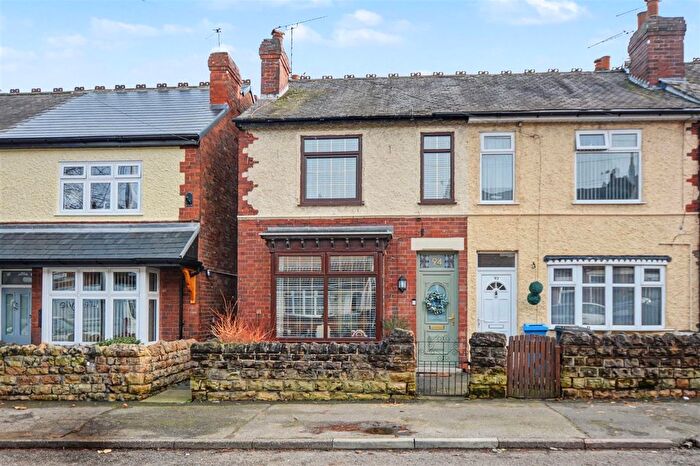
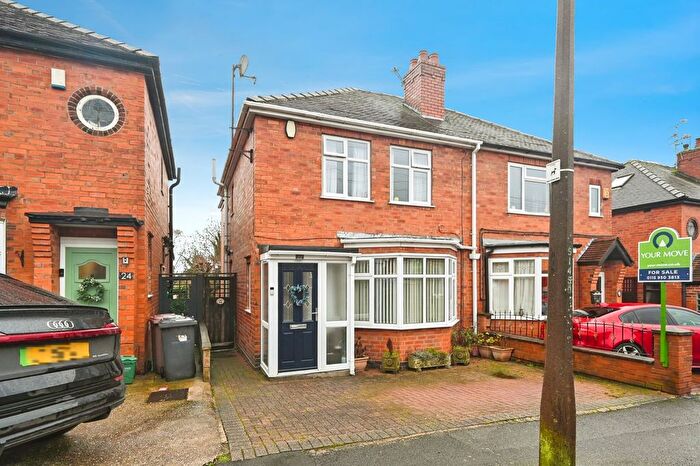
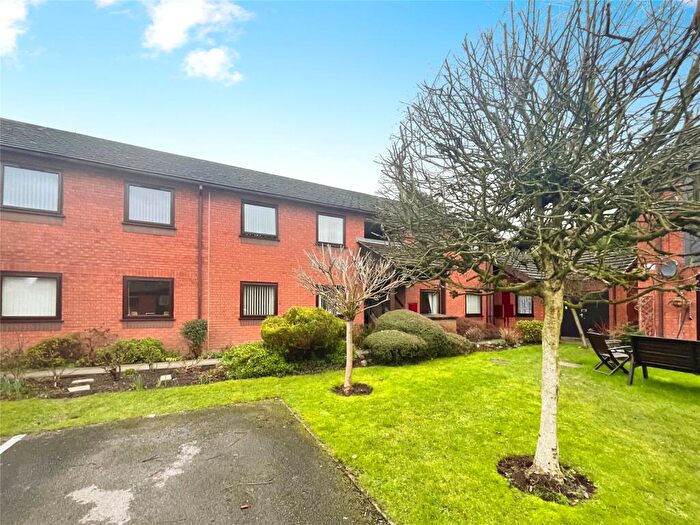
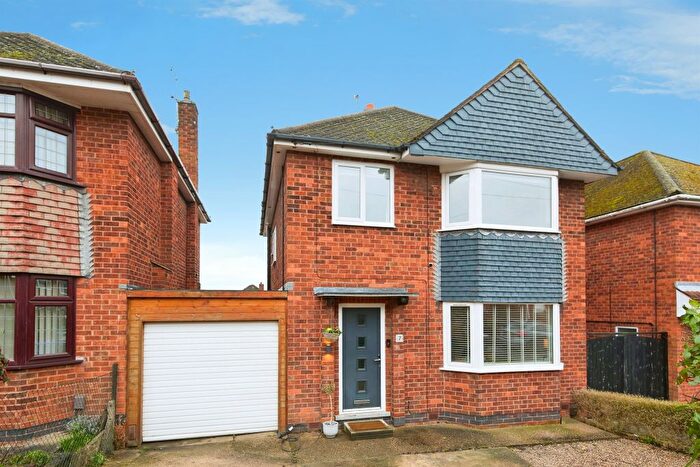
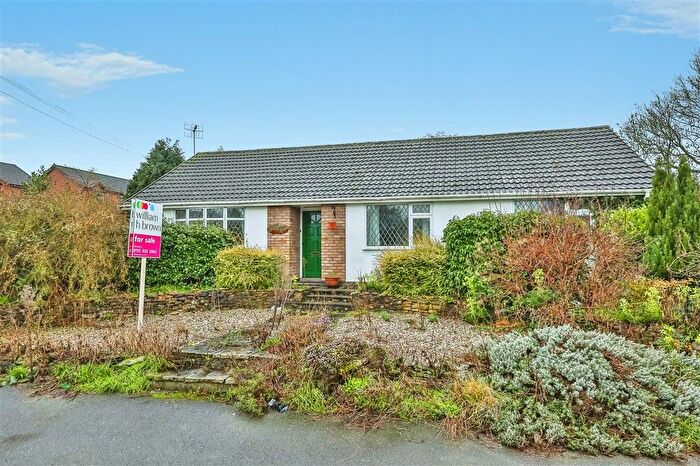
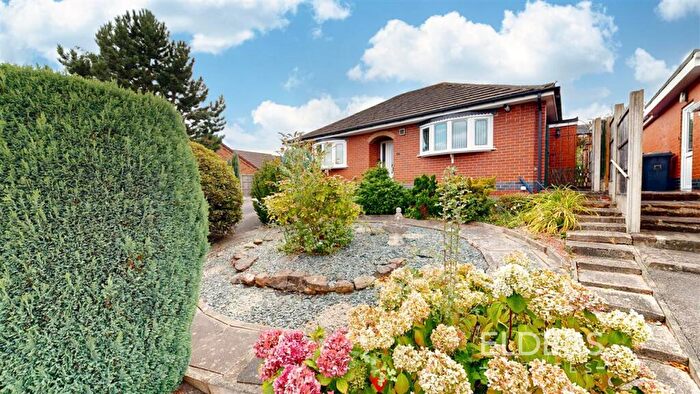
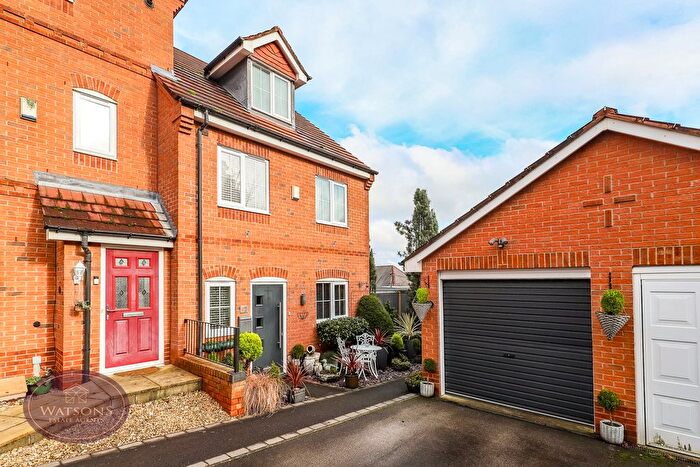
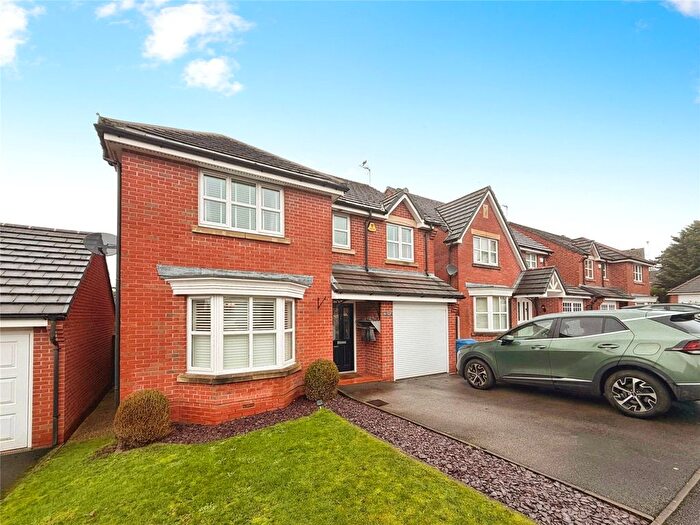
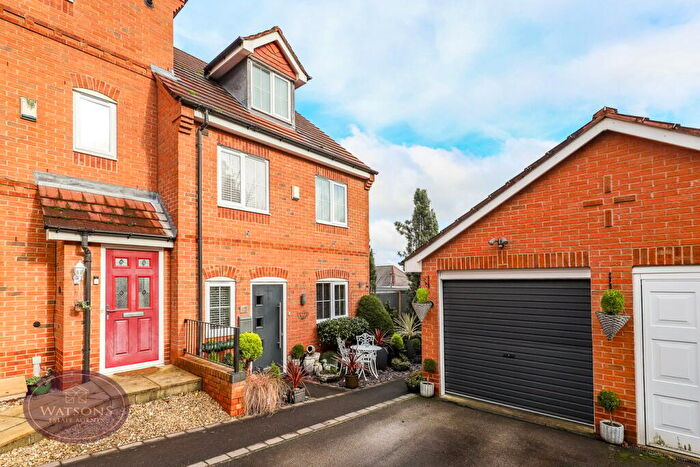
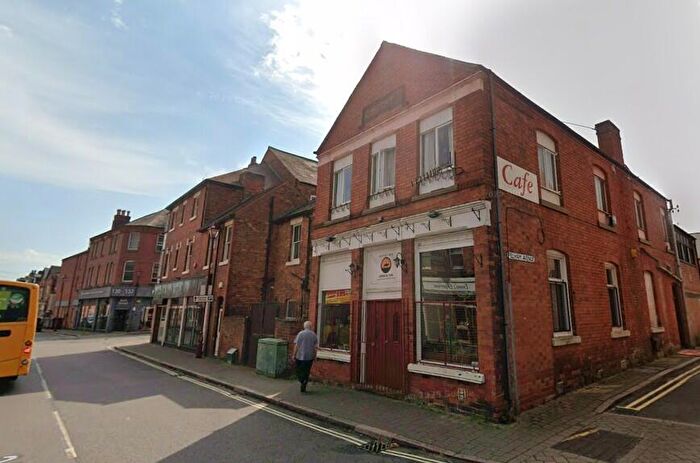
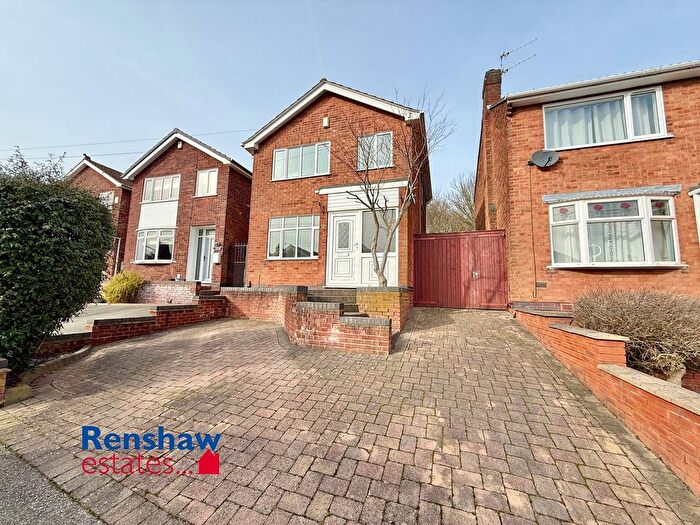
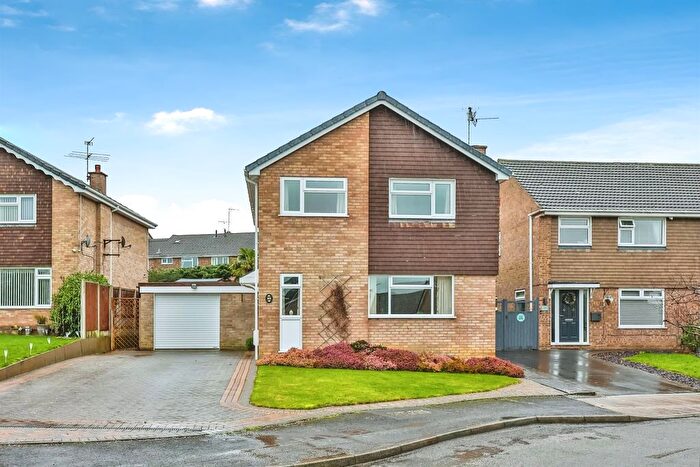
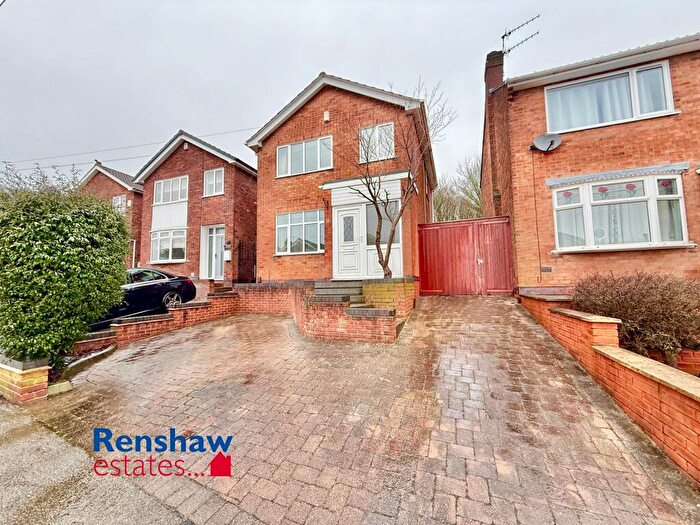
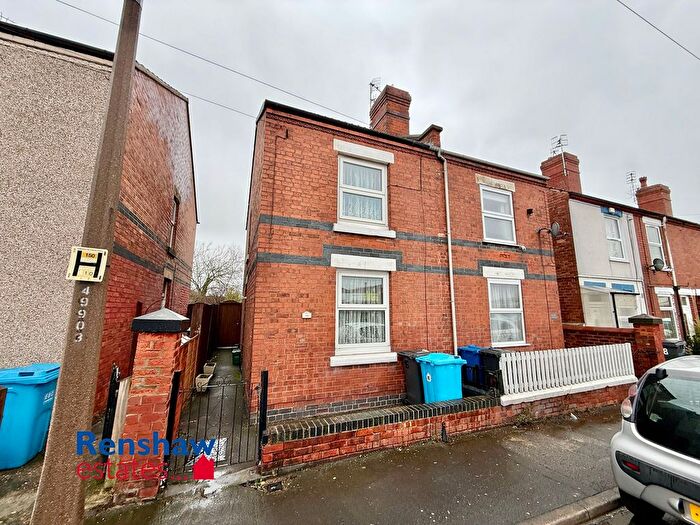
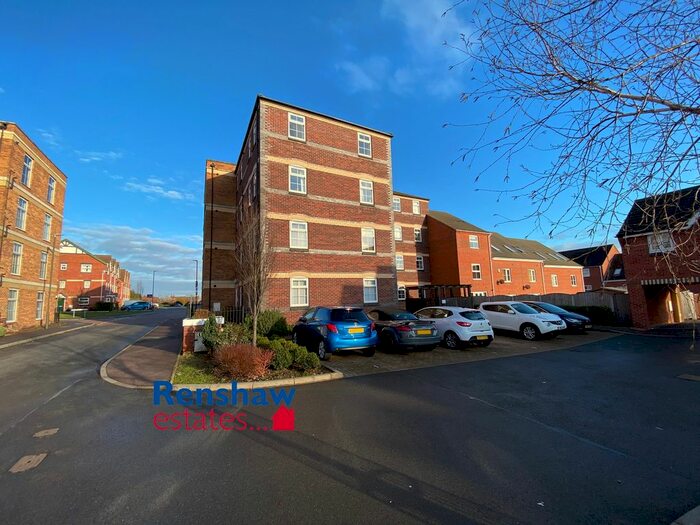
Properties for sale in Little Hallam
Roads and Postcodes in Little Hallam
Navigate through our locations to find the location of your next house in Little Hallam, Ilkeston for sale or to rent.
| Streets | Postcodes |
|---|---|
| Albert Street | DE7 5GS DE7 5GU |
| Albion Centre | DE7 8AG |
| Allendale | DE7 4LE |
| Appleby Close | DE7 4LP |
| Back Lane | DE7 8EJ |
| Bath Street | DE7 8AH DE7 8AP DE7 8AS DE7 8AJ DE7 8BU DE7 8DD DE7 8FH DE7 8HF |
| Belper Street | DE7 5FJ |
| Birkdale Close | DE7 8YA |
| Black Hills Drive | DE7 5FZ |
| Bristol Road | DE7 5HD |
| Burns Street | DE7 8AA |
| Cedar Park | DE7 5GE |
| Chapel Street | DE7 5JY |
| Charter Park | DE7 5GA |
| Church View | DE7 4LF |
| Dale View | DE7 4LD |
| Darwin Avenue | DE7 5GN |
| Derby Road | DE7 5EZ DE7 5FB DE7 5FF DE7 5FH DE7 5FG |
| Derby Street | DE7 5GB |
| Derbyshire Drive | DE7 4LG |
| Drummond Road | DE7 5HA |
| Durham Street | DE7 8FQ |
| Enterprise Court | DE7 8EW |
| Essex Street | DE7 8FP |
| First Avenue | DE7 5FT |
| Fullwood Avenue | DE7 8BA |
| Fullwood Street | DE7 8AZ |
| Gayton Road | DE7 5HN |
| Godfrey Drive | DE7 4HH |
| Gregory Street | DE7 8AE |
| Heanor Road | DE7 8DR DE7 8ES |
| Hedingham Close | DE7 5HR |
| High Street | DE7 5JA |
| Hobson Drive | DE7 4LJ DE7 4LL |
| Jackson Avenue | DE7 8AD |
| King George Avenue | DE7 5GY DE7 5HS |
| Kniveton Park | DE7 5FD |
| Lissett Avenue | DE7 5GQ |
| Lord Haddon Road | DE7 8AU DE7 8AW DE7 8AX |
| Lower Stanton Road | DE7 4LN |
| Manners Avenue | DE7 8HE DE7 8XD |
| Manners Industrial Estate | DE7 8WP |
| Manners Road | DE7 5HB DE7 8AT |
| Manor Fields Drive | DE7 5FA |
| Manor Road | DE7 8EG |
| Market Place | DE7 5HY DE7 5PS DE7 5QA DE7 5QB DE7 5QG DE7 5RN DE7 8GS |
| Market Street | DE7 5PQ |
| Mercian Close | DE7 8HG |
| Moss Road | DE7 5GP |
| Nesfield Road | DE7 8AY DE7 8BS |
| New Lawn Road | DE7 5HE DE7 5HG |
| North Street | DE7 8RF |
| Northfield Avenue | DE7 8EH |
| Nursery Hollow | DE7 4LQ |
| Oak Apple Crescent | DE7 4NZ |
| Oakwell Crescent | DE7 5GX |
| Oakwell Drive | DE7 5GL |
| Pelham Avenue | DE7 8DT |
| Pelham Street | DE7 8AR |
| Pimlico | DE7 5JS |
| Providence Place | DE7 8AL |
| Queen Street | DE7 5GT |
| Queens Drive | DE7 5GR |
| Scarborough Avenue | DE7 5GZ |
| Second Avenue | DE7 5FS |
| South Street | DE7 5QJ DE7 5PZ DE7 5QE DE7 5QQ DE7 5QT DE7 8TU |
| Spinney Road | DE7 4LH |
| St Andrews Drive | DE7 5GW |
| St Mary Court | DE7 8AQ |
| St Mary Street | DE7 8AB DE7 8AF DE7 8BQ |
| Stamford Street | DE7 8FJ |
| Stanley Close | DE7 4NA |
| Stanley Street | DE7 5FX |
| Stanton Road | DE7 5FQ DE7 5FY |
| Station Court | DE7 8AN |
| Tavern Close | DE7 8LS |
| The Spinney | DE7 4LZ |
| Third Avenue | DE7 5FR |
| Tinker Croft | DE7 5GD |
| Union Road | DE7 5FP DE7 5FL |
| Victoria Court | DE7 8BJ |
| West End Crescent | DE7 5GJ |
| West End Drive | DE7 5GG DE7 5GH |
| West Street | DE7 5JW |
| Wharncliffe Road | DE7 5GF DE7 5HF DE7 5HH |
| Wilmot Street | DE7 8BD DE7 8BB |
| DE7 0AR DE7 0AZ DE7 0BU DE7 0BW DE7 0DR DE7 0EY DE7 0FD DE7 0FR DE7 0FT DE7 0FU DE7 0FW DE7 0FX DE7 0SA DE7 0SB DE7 0SD DE7 0SE DE7 0SF DE7 0SG DE7 0SH DE7 0SJ DE7 0SL DE7 0SN DE7 0SP DE7 0SQ DE7 0SR DE7 0SS DE7 0ST DE7 0SU DE7 0SW DE7 0SX DE7 0SY DE7 0SZ DE7 0TA DE7 0TB DE7 0TD DE7 0TE DE7 0TF DE7 0TG DE7 0ZY DE7 0ZZ DE7 5RP DE7 5SE DE7 8ZG DE7 9ZQ DE7 9ZW DE75 7ZL DE75 9AB DE75 9AR DE75 9AY DE7 0FY DE7 0FZ DE7 0GN DE7 0GP |
Transport near Little Hallam
-
Ilkeston Station
-
Langley Mill Station
-
Bulwell Station
-
Beeston Station
-
Attenborough Station
-
Spondon Station
-
Long Eaton Station
-
Hucknall Station
-
Nottingham Station
-
Duffield Station
- FAQ
- Price Paid By Year
- Property Type Price
Frequently asked questions about Little Hallam
What is the average price for a property for sale in Little Hallam?
The average price for a property for sale in Little Hallam is £207,015. This amount is 0.48% lower than the average price in Ilkeston. There are 1,958 property listings for sale in Little Hallam.
What streets have the most expensive properties for sale in Little Hallam?
The streets with the most expensive properties for sale in Little Hallam are Manor Fields Drive at an average of £732,000, Oakwell Drive at an average of £414,000 and St Andrews Drive at an average of £372,125.
What streets have the most affordable properties for sale in Little Hallam?
The streets with the most affordable properties for sale in Little Hallam are Third Avenue at an average of £89,000, Providence Place at an average of £96,000 and South Street at an average of £97,500.
Which train stations are available in or near Little Hallam?
Some of the train stations available in or near Little Hallam are Ilkeston, Langley Mill and Bulwell.
Property Price Paid in Little Hallam by Year
The average sold property price by year was:
| Year | Average Sold Price | Price Change |
Sold Properties
|
|---|---|---|---|
| 2025 | £208,817 | 8% |
51 Properties |
| 2024 | £191,174 | -16% |
66 Properties |
| 2023 | £221,686 | 2% |
65 Properties |
| 2022 | £217,299 | 8% |
93 Properties |
| 2021 | £199,403 | 26% |
108 Properties |
| 2020 | £147,101 | 4% |
104 Properties |
| 2019 | £141,678 | -18% |
118 Properties |
| 2018 | £167,244 | -1% |
76 Properties |
| 2017 | £169,608 | 10% |
81 Properties |
| 2016 | £152,524 | -7% |
90 Properties |
| 2015 | £162,439 | 13% |
82 Properties |
| 2014 | £141,268 | 15% |
97 Properties |
| 2013 | £120,281 | -28% |
66 Properties |
| 2012 | £153,758 | 12% |
50 Properties |
| 2011 | £135,371 | 8% |
46 Properties |
| 2010 | £124,208 | -8% |
55 Properties |
| 2009 | £134,397 | -0,4% |
40 Properties |
| 2008 | £134,951 | -13% |
49 Properties |
| 2007 | £153,059 | 5% |
94 Properties |
| 2006 | £144,909 | -7% |
109 Properties |
| 2005 | £154,914 | 29% |
105 Properties |
| 2004 | £110,079 | 8% |
66 Properties |
| 2003 | £100,880 | 21% |
65 Properties |
| 2002 | £79,790 | 23% |
94 Properties |
| 2001 | £61,837 | 11% |
90 Properties |
| 2000 | £55,031 | -20% |
80 Properties |
| 1999 | £65,944 | 28% |
123 Properties |
| 1998 | £47,734 | 12% |
85 Properties |
| 1997 | £41,834 | -4% |
70 Properties |
| 1996 | £43,671 | -0,4% |
68 Properties |
| 1995 | £43,832 | - |
55 Properties |
Property Price per Property Type in Little Hallam
Here you can find historic sold price data in order to help with your property search.
The average Property Paid Price for specific property types in the last three years are:
| Property Type | Average Sold Price | Sold Properties |
|---|---|---|
| Flat | £90,265.00 | 13 Flats |
| Semi Detached House | £197,595.00 | 57 Semi Detached Houses |
| Detached House | £344,988.00 | 45 Detached Houses |
| Terraced House | £145,013.00 | 67 Terraced Houses |

