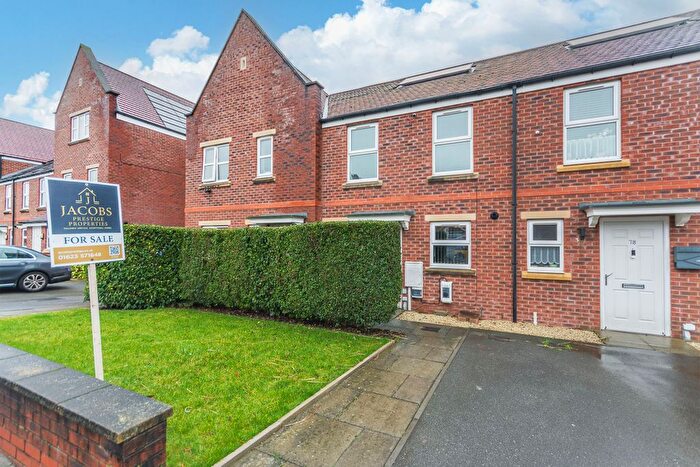
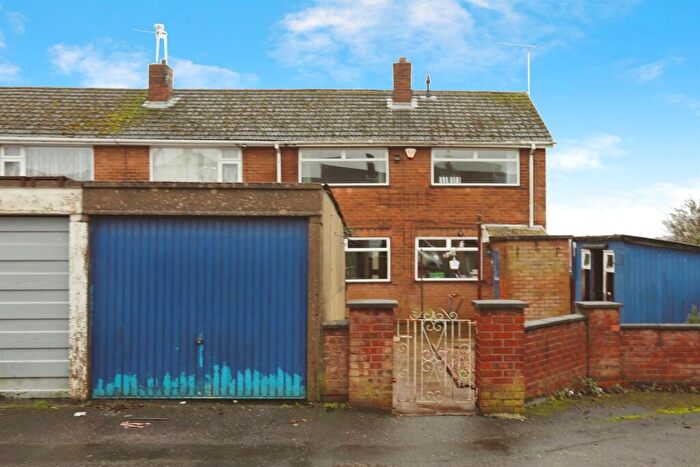
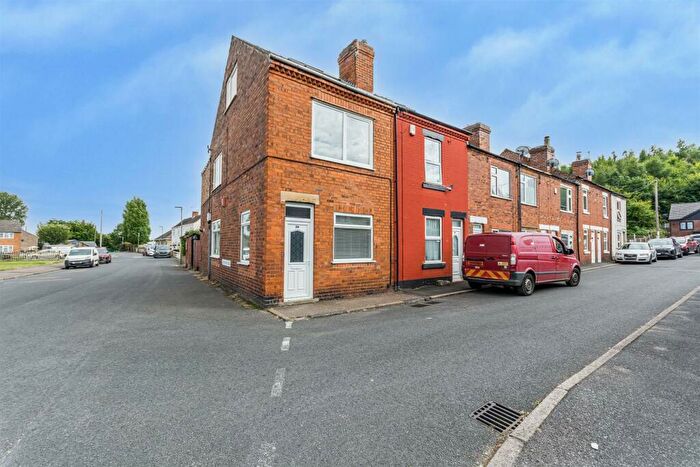
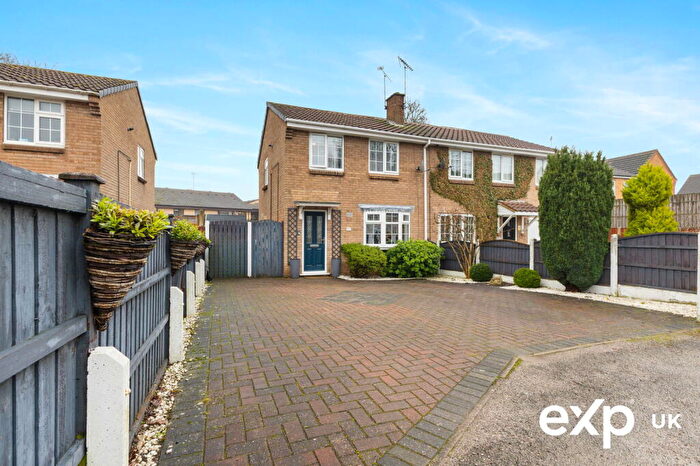
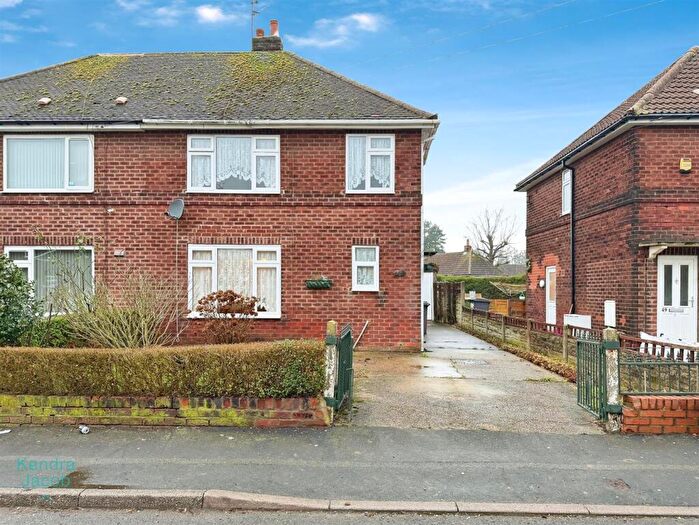
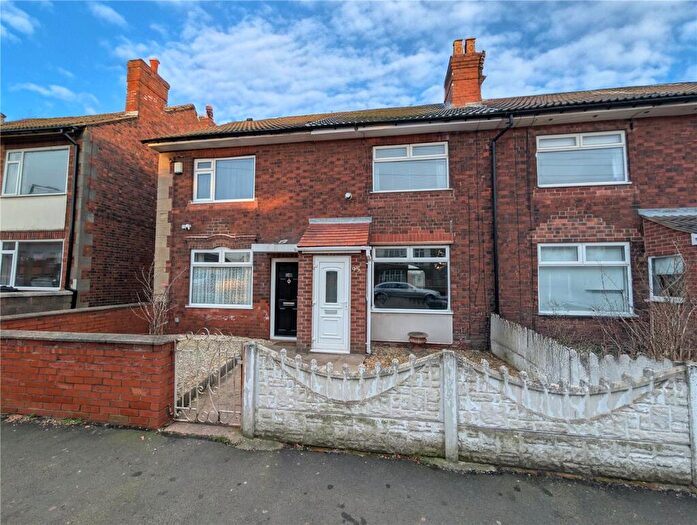
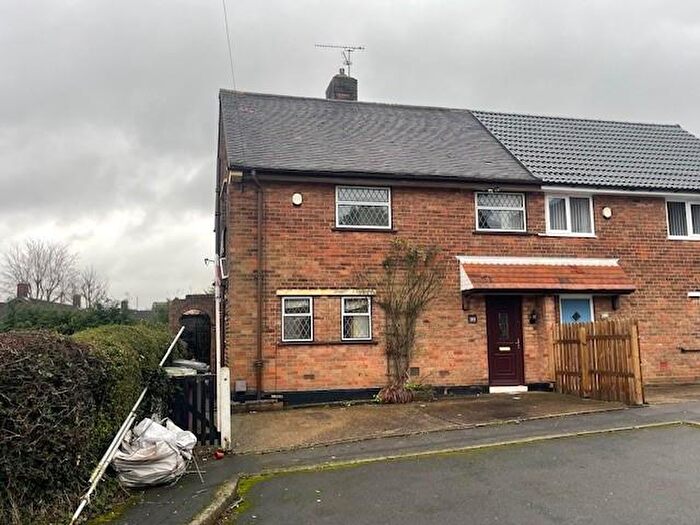
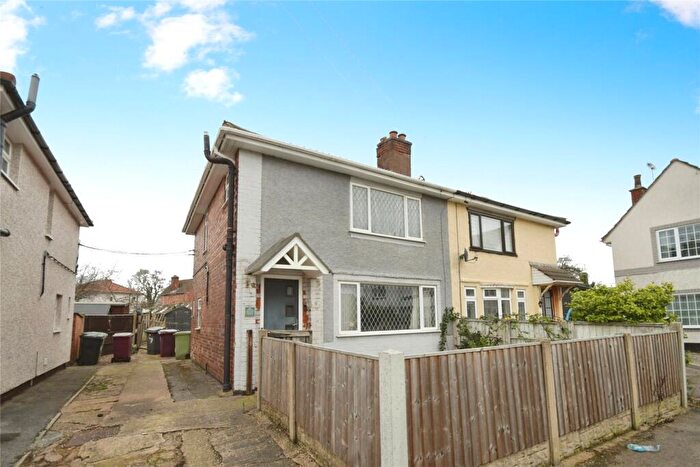
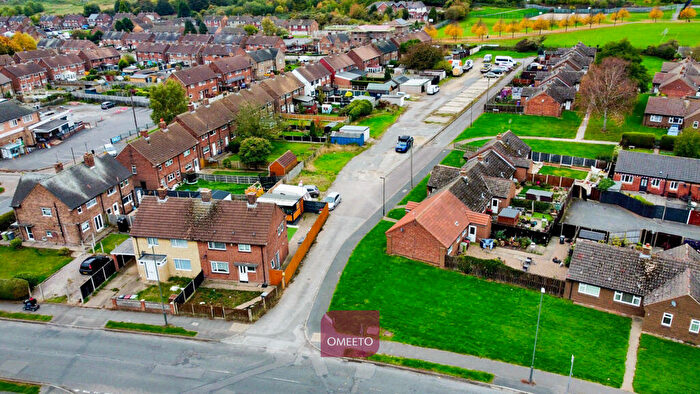
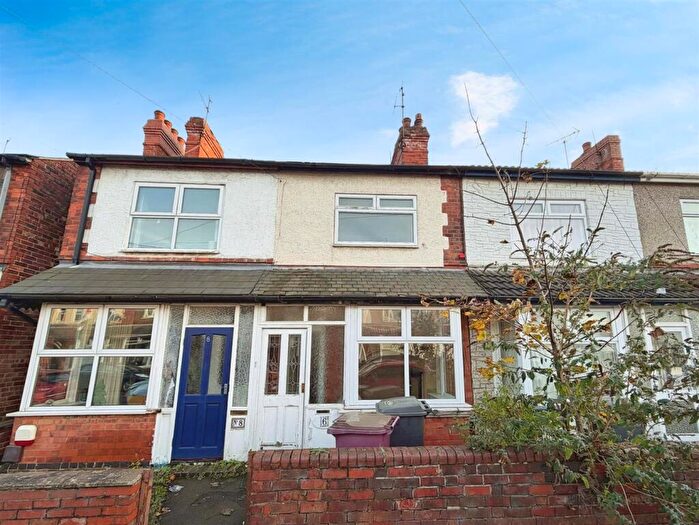
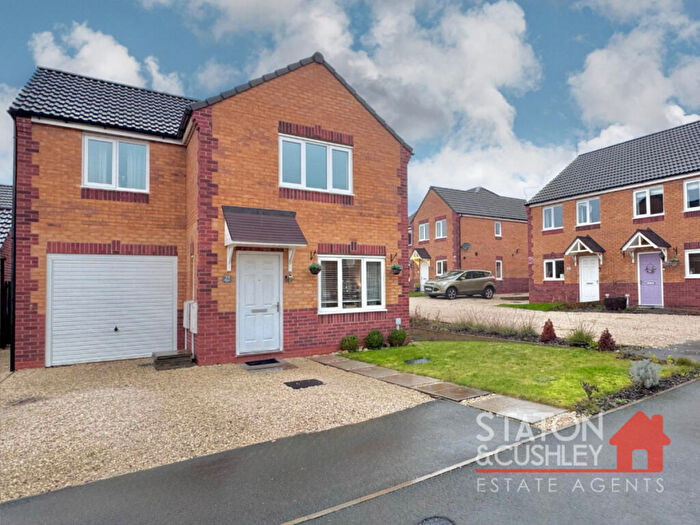
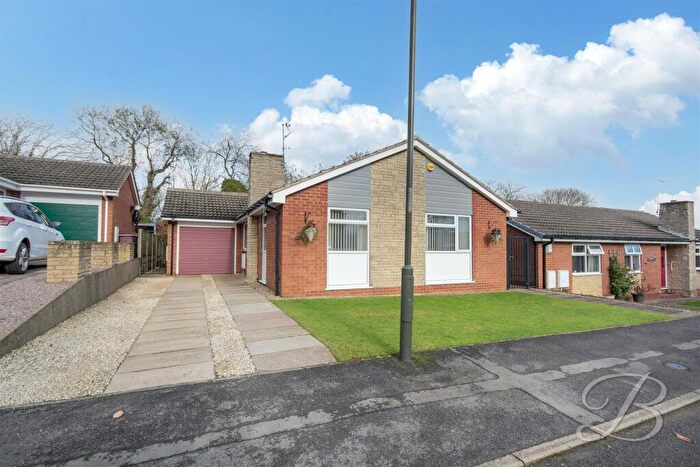
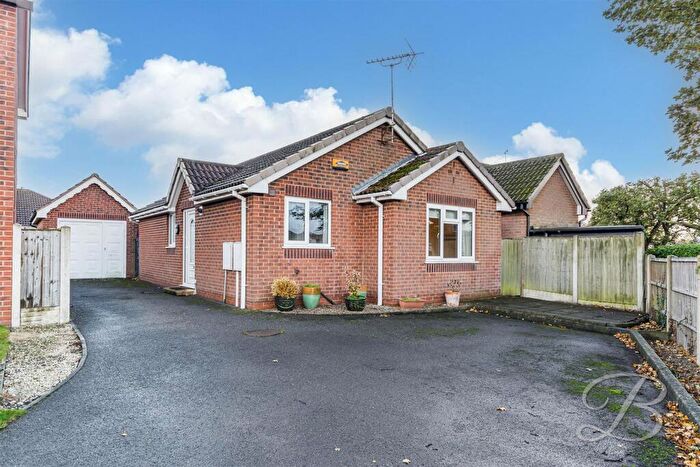
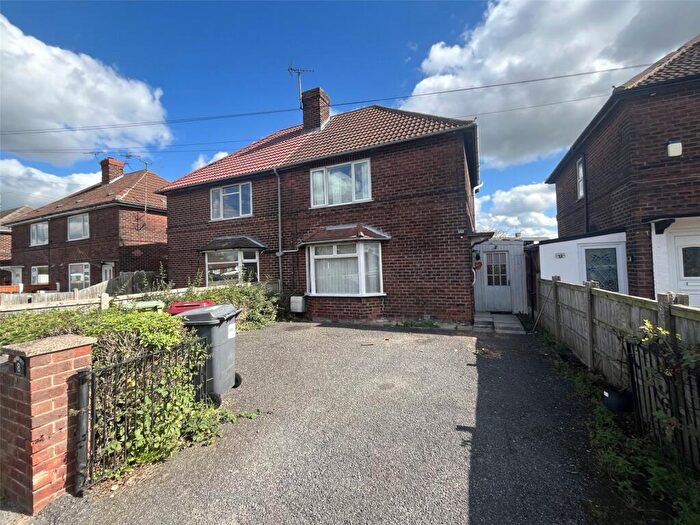
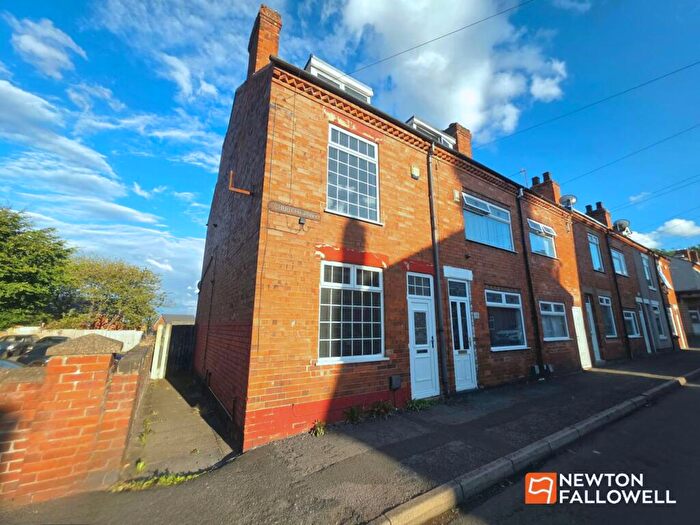
Houses for sale & to rent in Shirebrook East, Mansfield
House Prices in Shirebrook East
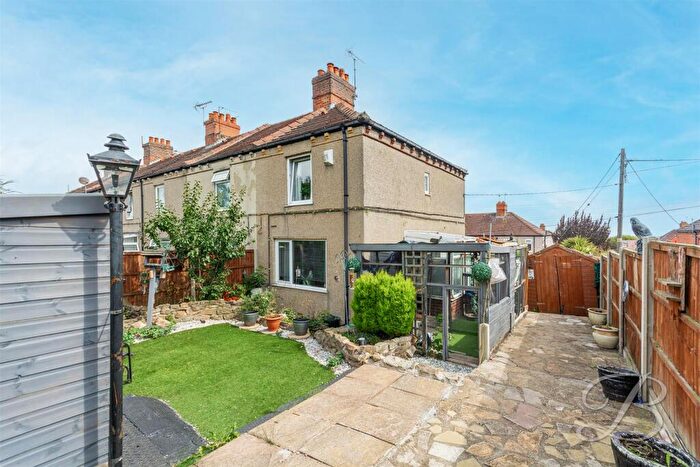
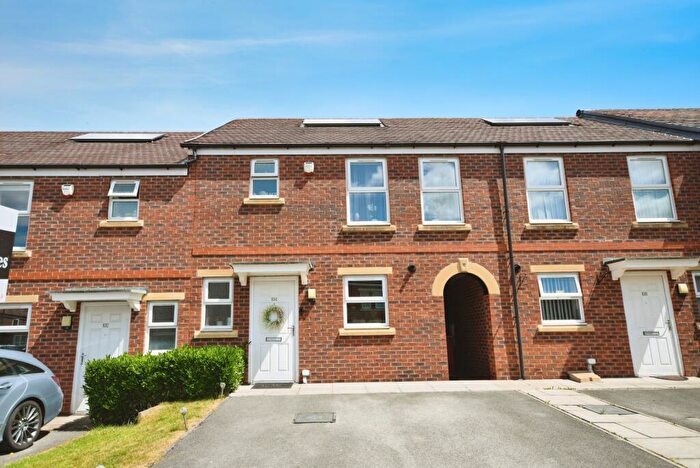
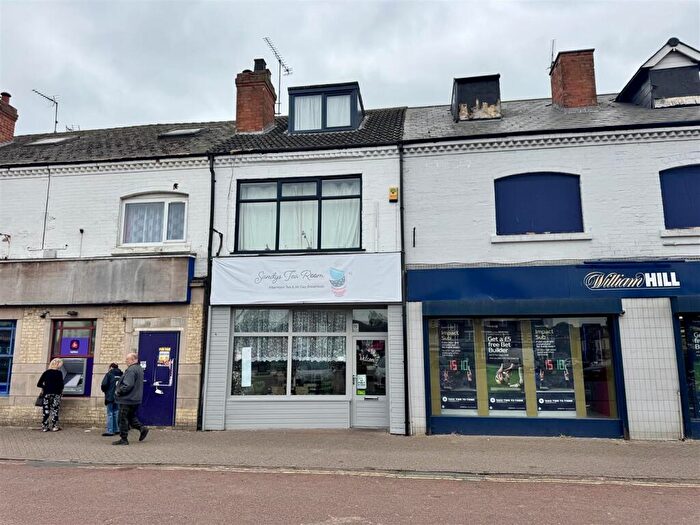
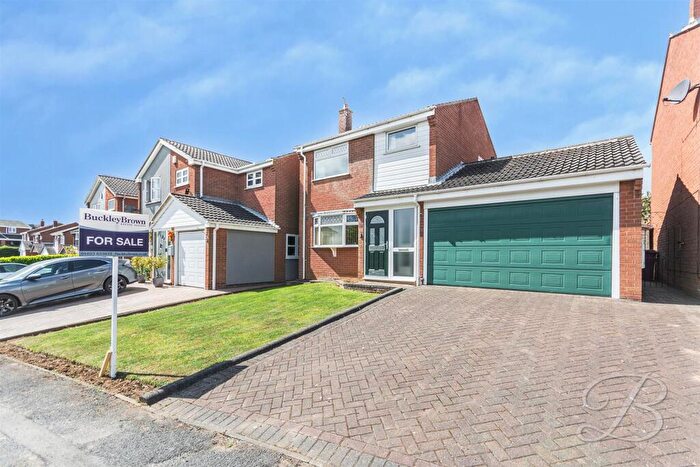
Properties in Shirebrook East have an average house price of £122,092.00 and had 66 Property Transactions within the last 3 years¹.
Shirebrook East is an area in Mansfield, Derbyshire with 614 households², where the most expensive property was sold for £295,000.00.
Properties for sale in Shirebrook East
Previously listed properties in Shirebrook East
Roads and Postcodes in Shirebrook East
Navigate through our locations to find the location of your next house in Shirebrook East, Mansfield for sale or to rent.
| Streets | Postcodes |
|---|---|
| Beech Terrace | NG20 8PQ |
| Byron Street | NG20 8PH |
| Carter Lane | NG20 8PF |
| Central Close | NG20 8BG |
| Central Drive | NG20 8BA NG20 8BE |
| Church Drive | NG20 8DE |
| Division Road | NG20 8PG |
| Embankment Close | NG20 8FL |
| Great Northern Cottages | NG20 8BD |
| Hardwick Street | NG20 8SQ |
| Hereward Close | NG20 8UT NG20 8UU |
| King Edward Street | NG20 8AU |
| Langwith Road | NG20 8TF NG20 8TG NG20 8TH NG20 8TQ |
| Long Lane | NG20 8AZ |
| Main Street | NG20 8AN NG20 8AW NG20 8AX NG20 8DD |
| Market Close | NG20 8AE |
| Market Place | NG20 8AA |
| Market Street | NG20 8AD |
| New Linden Street | NG20 8TJ |
| Nicholsons Row | NG20 8AY |
| Patchwork Row | NG20 8AL |
| Sookholme Road | NG20 8SE NG20 8SF |
| Station Road | NG20 8AF NG20 8SH NG20 8SU NG20 8SY NG20 8SZ NG20 8TA NG20 8UF NG20 8UG |
| The Croft | NG20 8FJ |
| Thickley Close | NG20 8UP NG20 8UR |
| Victoria Street | NG20 8AQ |
| York Road | NG20 8BB |
Transport near Shirebrook East
- FAQ
- Price Paid By Year
- Property Type Price
Frequently asked questions about Shirebrook East
What is the average price for a property for sale in Shirebrook East?
The average price for a property for sale in Shirebrook East is £122,092. This amount is 20% lower than the average price in Mansfield. There are 427 property listings for sale in Shirebrook East.
What streets have the most expensive properties for sale in Shirebrook East?
The streets with the most expensive properties for sale in Shirebrook East are Central Close at an average of £185,000, Division Road at an average of £182,500 and Main Street at an average of £162,500.
What streets have the most affordable properties for sale in Shirebrook East?
The streets with the most affordable properties for sale in Shirebrook East are York Road at an average of £59,525, Victoria Street at an average of £70,000 and King Edward Street at an average of £89,000.
Which train stations are available in or near Shirebrook East?
Some of the train stations available in or near Shirebrook East are Shirebrook (Derbys), Langwith and Mansfield Woodhouse.
Property Price Paid in Shirebrook East by Year
The average sold property price by year was:
| Year | Average Sold Price | Price Change |
Sold Properties
|
|---|---|---|---|
| 2025 | £119,736 | -6% |
19 Properties |
| 2024 | £126,792 | 4% |
14 Properties |
| 2023 | £121,454 | -4% |
33 Properties |
| 2022 | £126,132 | 22% |
28 Properties |
| 2021 | £98,664 | -1% |
31 Properties |
| 2020 | £99,604 | 8% |
26 Properties |
| 2019 | £91,600 | -6% |
18 Properties |
| 2018 | £96,732 | 21% |
20 Properties |
| 2017 | £76,694 | 3% |
18 Properties |
| 2016 | £74,593 | 2% |
16 Properties |
| 2015 | £73,352 | 9% |
20 Properties |
| 2014 | £66,753 | -9% |
15 Properties |
| 2013 | £72,900 | 4% |
15 Properties |
| 2012 | £70,260 | -26% |
23 Properties |
| 2011 | £88,855 | 24% |
26 Properties |
| 2010 | £67,884 | -17% |
13 Properties |
| 2009 | £79,095 | -11% |
10 Properties |
| 2008 | £87,611 | 7% |
13 Properties |
| 2007 | £81,496 | 3% |
40 Properties |
| 2006 | £79,381 | 20% |
30 Properties |
| 2005 | £63,505 | 11% |
27 Properties |
| 2004 | £56,822 | 25% |
39 Properties |
| 2003 | £42,533 | 13% |
33 Properties |
| 2002 | £36,924 | 20% |
38 Properties |
| 2001 | £29,462 | 0,1% |
26 Properties |
| 2000 | £29,433 | 14% |
22 Properties |
| 1999 | £25,236 | -12% |
19 Properties |
| 1998 | £28,326 | 12% |
21 Properties |
| 1997 | £24,845 | -1% |
21 Properties |
| 1996 | £24,997 | 5% |
17 Properties |
| 1995 | £23,673 | - |
17 Properties |
Property Price per Property Type in Shirebrook East
Here you can find historic sold price data in order to help with your property search.
The average Property Paid Price for specific property types in the last three years are:
| Property Type | Average Sold Price | Sold Properties |
|---|---|---|
| Semi Detached House | £139,150.00 | 20 Semi Detached Houses |
| Detached House | £206,250.00 | 4 Detached Houses |
| Terraced House | £105,954.00 | 42 Terraced Houses |

