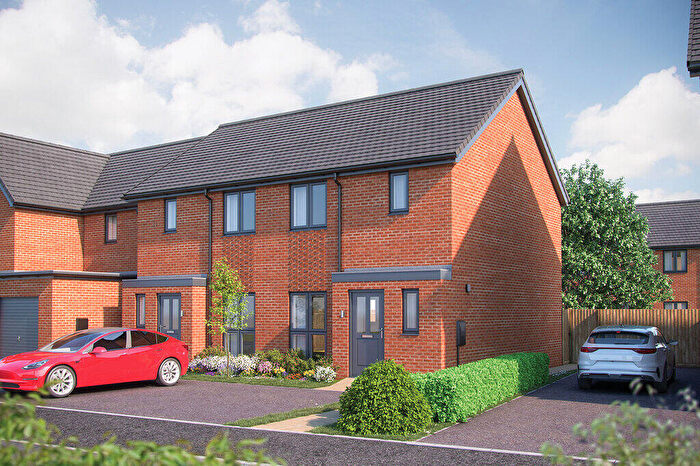
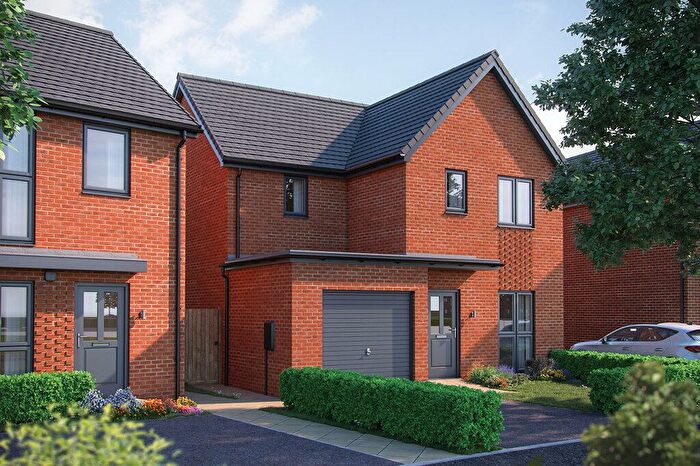
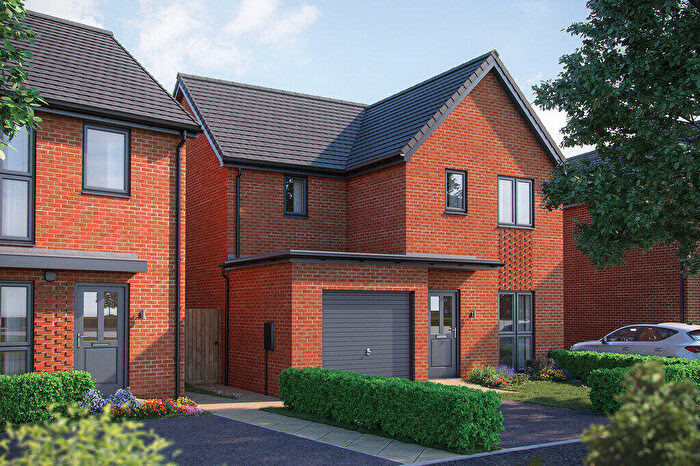
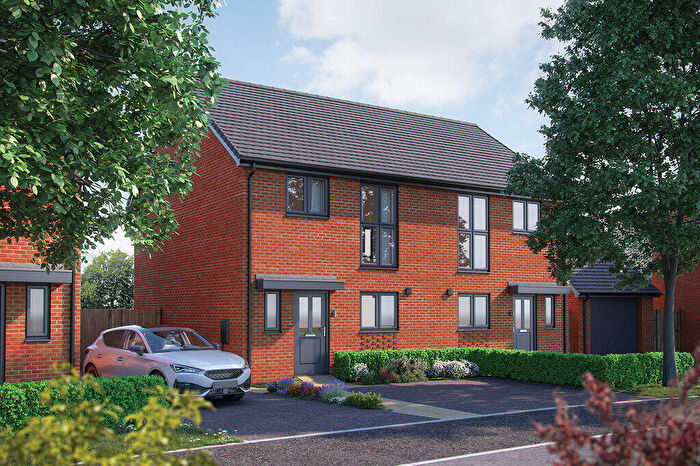
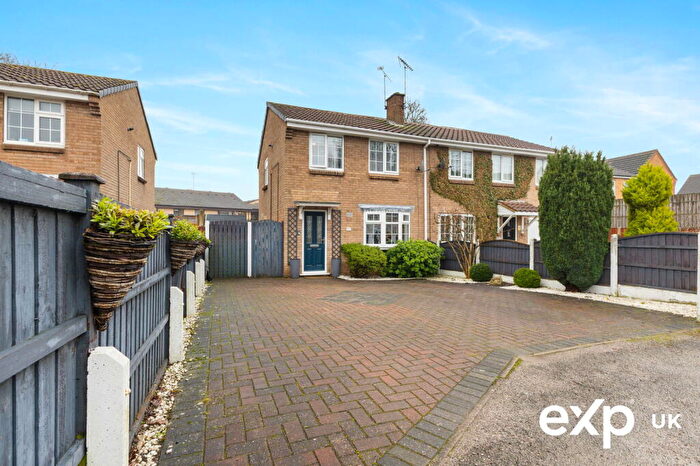
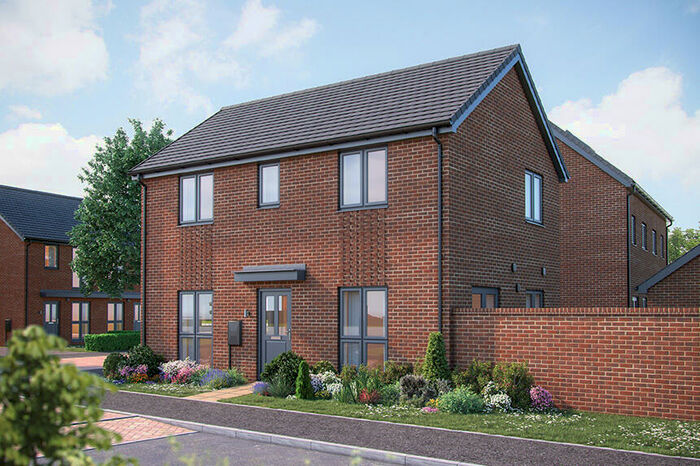
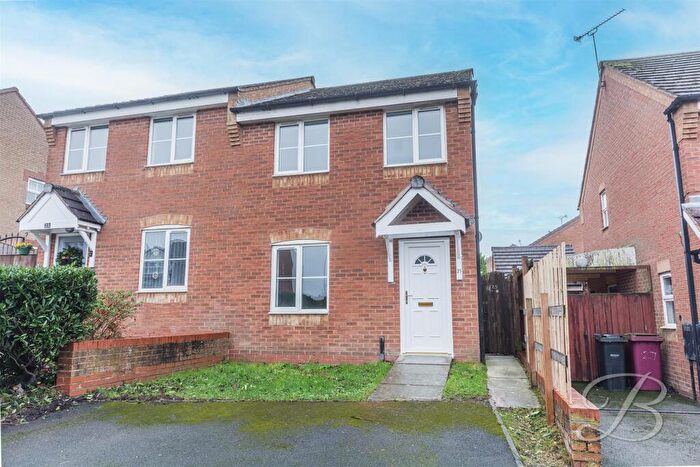
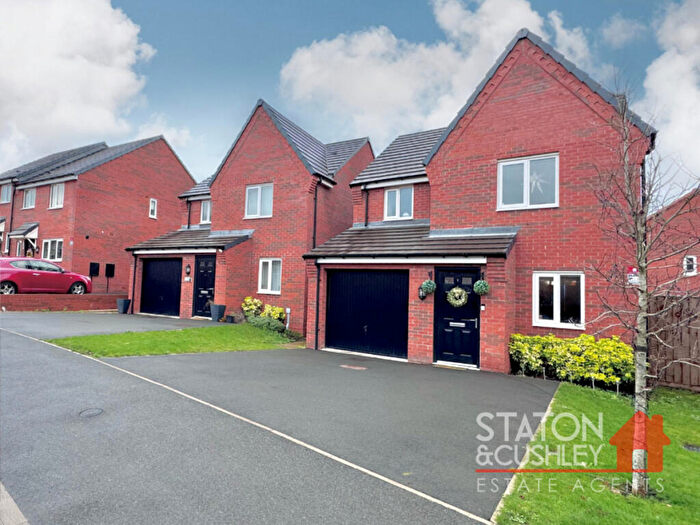
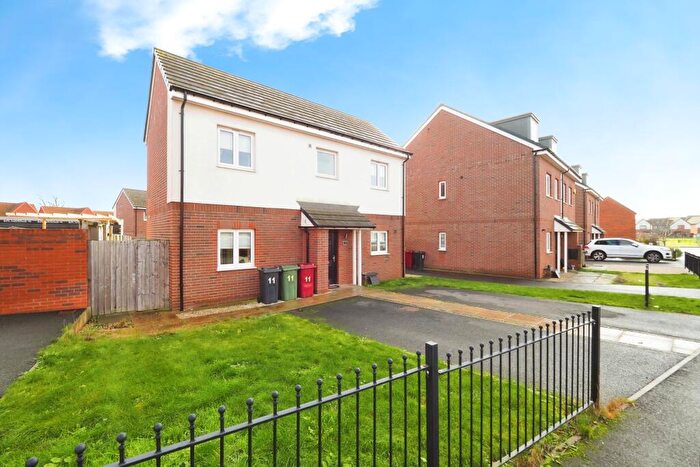
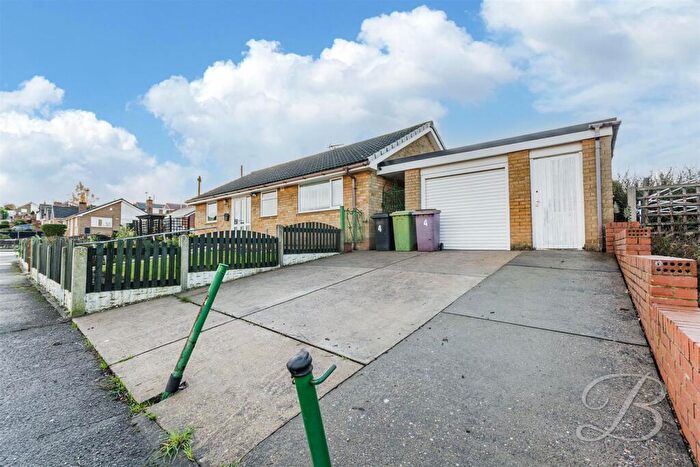
Houses for sale & to rent in Shirebrook South West, Mansfield
House Prices in Shirebrook South West
Properties in Shirebrook South West have an average house price of £157,910.00 and had 92 Property Transactions within the last 3 years¹.
Shirebrook South West is an area in Mansfield, Derbyshire with 1,080 households², where the most expensive property was sold for £270,000.00.
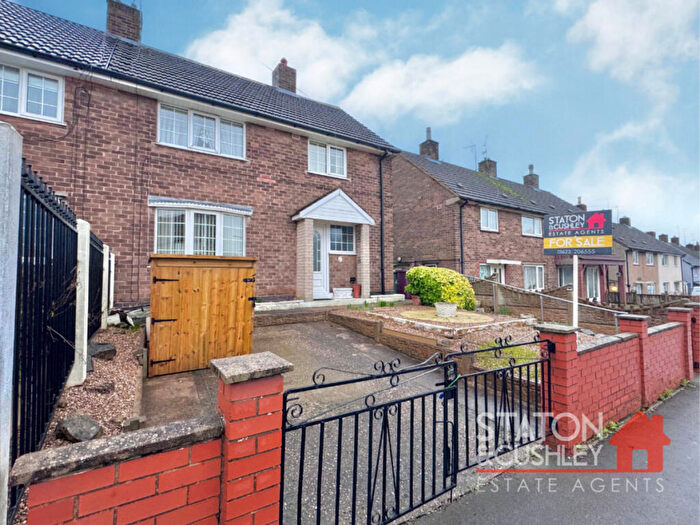
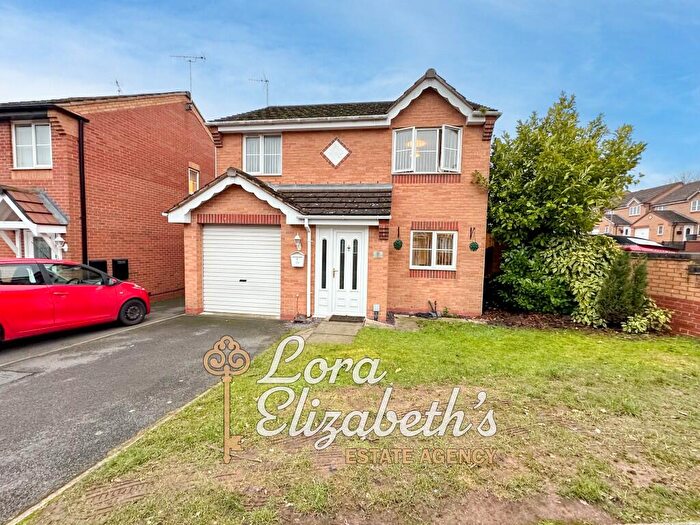
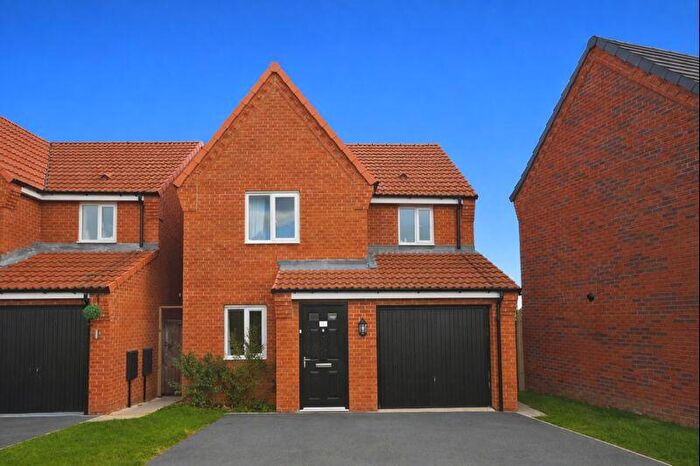
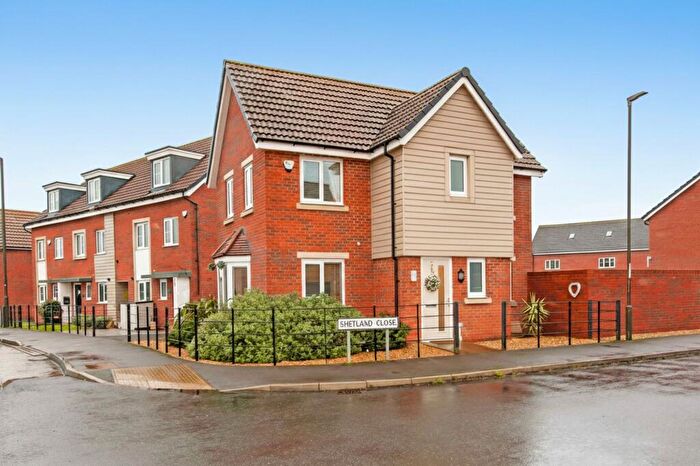
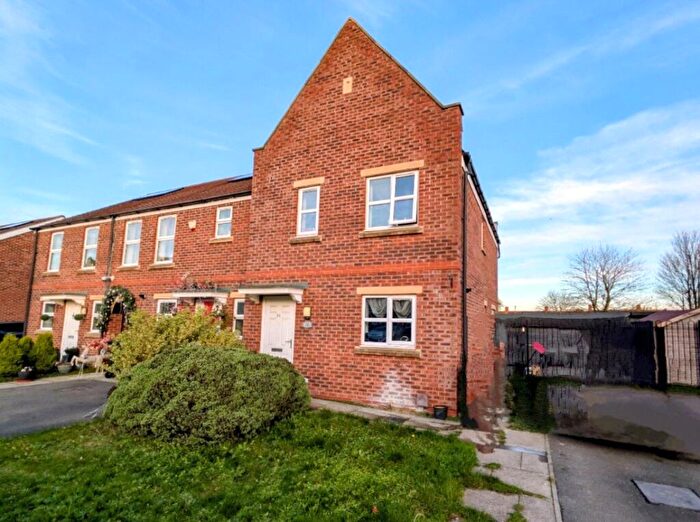
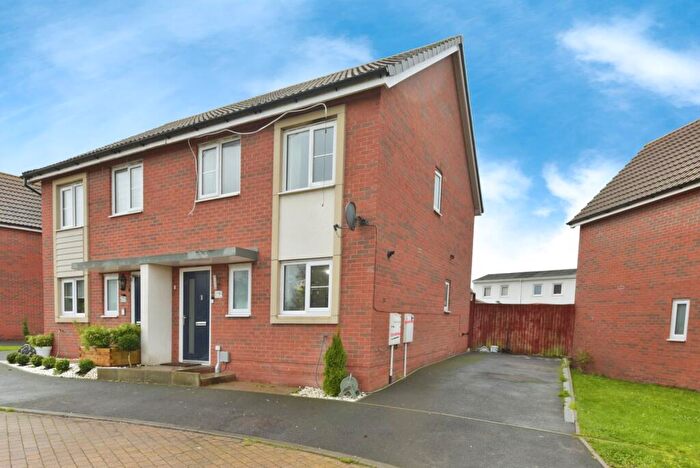
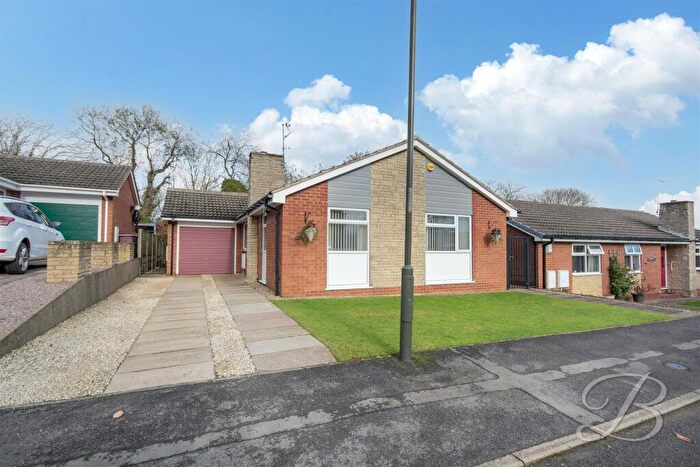
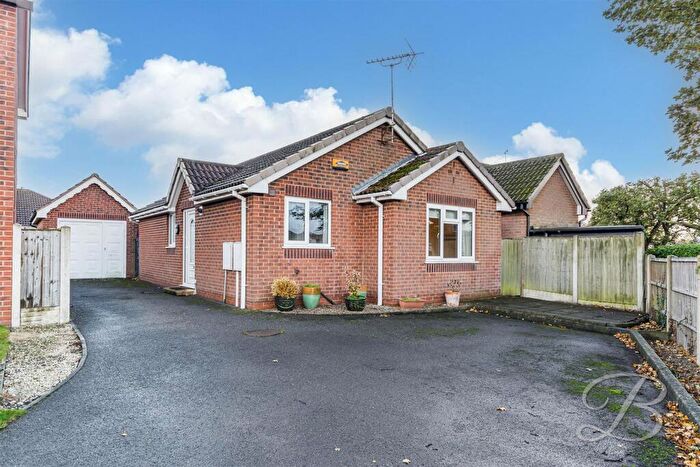
Properties for sale in Shirebrook South West
Roads and Postcodes in Shirebrook South West
Navigate through our locations to find the location of your next house in Shirebrook South West, Mansfield for sale or to rent.
| Streets | Postcodes |
|---|---|
| Acorn Ridge | NG20 8QS |
| Birch Grove | NG20 8QQ |
| Bluebell Close | NG20 8FA |
| Bracken Road | NG20 8FB NG20 8FH |
| Campion Close | NG20 8EX |
| Carnation Road | NG20 8FG |
| Carter Lane | NG20 8NA NG20 8ND |
| Chestnut Drive | NG20 8NH NG20 8NJ NG20 8NL |
| Common Lane | NG20 8NN NG20 8NP NG20 8NW |
| Elm Tree Avenue | NG20 8NU NG20 8NX NG20 8NY |
| Hawthorne Avenue | NG20 8NT |
| Hazel Crescent | NG20 8NE |
| Highcliffe Avenue | NG20 8NB |
| Hill Crest | NG20 8DP |
| Hillsway | NG20 8DZ |
| Larch Avenue | NG20 8NS |
| Lavender Close | NG20 8FE |
| Limes Crescent | NG20 8QL |
| Little Lane | NG20 8DW |
| Lupin Close | NG20 8FF |
| Main Street | NG20 8DL NG20 8DR NG20 8DS NG20 8DT NG20 8DU NG20 8DX |
| Oak Avenue | NG20 8NR |
| Orchid Way | NG20 8ES |
| Poppy Close | NG20 8EU |
| Primula Close | NG20 8EZ |
| Riding Hill Avenue | NG20 8EG |
| Slant Lane | NG20 8NF NG20 8NG NG20 8QN NG20 8QP NG20 8QR NG20 8QW |
| Stinting Lane | NG20 8EE NG20 8EQ |
| Sunflower Close | NG20 8FD |
| The Coppice | NG20 8EF |
| The Knoll | NG20 8EA |
| The Leaway | NG20 8EB |
| The Nook | NG20 8ED |
| The Paddock | NG20 8QT |
| The Spinney | NG20 8DY |
| Violet Close | NG20 8ET |
| Yew Tree Drive | NG20 8QH NG20 8QJ |
Transport near Shirebrook South West
- FAQ
- Price Paid By Year
- Property Type Price
Frequently asked questions about Shirebrook South West
What is the average price for a property for sale in Shirebrook South West?
The average price for a property for sale in Shirebrook South West is £157,910. This amount is 3% higher than the average price in Mansfield. There are 533 property listings for sale in Shirebrook South West.
What streets have the most expensive properties for sale in Shirebrook South West?
The streets with the most expensive properties for sale in Shirebrook South West are Carnation Road at an average of £240,000, The Nook at an average of £232,000 and Stinting Lane at an average of £219,500.
What streets have the most affordable properties for sale in Shirebrook South West?
The streets with the most affordable properties for sale in Shirebrook South West are Main Street at an average of £105,500, Violet Close at an average of £113,250 and Acorn Ridge at an average of £115,750.
Which train stations are available in or near Shirebrook South West?
Some of the train stations available in or near Shirebrook South West are Shirebrook (Derbys), Langwith and Mansfield Woodhouse.
Property Price Paid in Shirebrook South West by Year
The average sold property price by year was:
| Year | Average Sold Price | Price Change |
Sold Properties
|
|---|---|---|---|
| 2025 | £168,200 | 6% |
25 Properties |
| 2024 | £158,925 | 8% |
40 Properties |
| 2023 | £146,879 | -0,2% |
27 Properties |
| 2022 | £147,243 | 11% |
39 Properties |
| 2021 | £131,405 | 7% |
47 Properties |
| 2020 | £122,606 | 3% |
23 Properties |
| 2019 | £119,459 | 1% |
37 Properties |
| 2018 | £118,122 | 14% |
38 Properties |
| 2017 | £101,225 | -2% |
39 Properties |
| 2016 | £102,826 | 2% |
49 Properties |
| 2015 | £100,423 | 0,1% |
26 Properties |
| 2014 | £100,345 | 17% |
47 Properties |
| 2013 | £83,116 | -18% |
32 Properties |
| 2012 | £98,307 | 7% |
28 Properties |
| 2011 | £91,472 | 4% |
22 Properties |
| 2010 | £87,675 | 1% |
28 Properties |
| 2009 | £87,117 | -23% |
26 Properties |
| 2008 | £106,810 | -1% |
27 Properties |
| 2007 | £108,310 | 0,4% |
73 Properties |
| 2006 | £107,841 | 5% |
66 Properties |
| 2005 | £102,629 | 18% |
79 Properties |
| 2004 | £83,900 | 10% |
81 Properties |
| 2003 | £75,753 | 23% |
91 Properties |
| 2002 | £58,684 | 12% |
89 Properties |
| 2001 | £51,882 | 16% |
87 Properties |
| 2000 | £43,412 | -7% |
66 Properties |
| 1999 | £46,312 | -4% |
70 Properties |
| 1998 | £48,055 | 22% |
20 Properties |
| 1997 | £37,607 | 17% |
14 Properties |
| 1996 | £31,119 | -10% |
11 Properties |
| 1995 | £34,154 | - |
21 Properties |
Property Price per Property Type in Shirebrook South West
Here you can find historic sold price data in order to help with your property search.
The average Property Paid Price for specific property types in the last three years are:
| Property Type | Average Sold Price | Sold Properties |
|---|---|---|
| Semi Detached House | £147,488.00 | 67 Semi Detached Houses |
| Detached House | £216,055.00 | 18 Detached Houses |
| Terraced House | £108,142.00 | 7 Terraced Houses |

