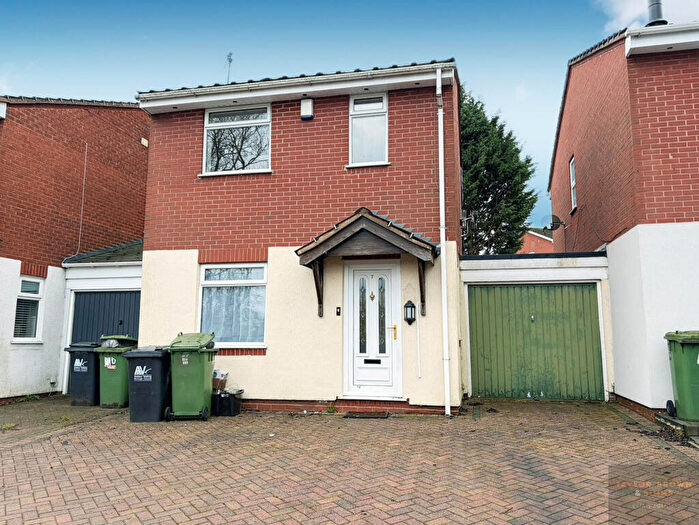
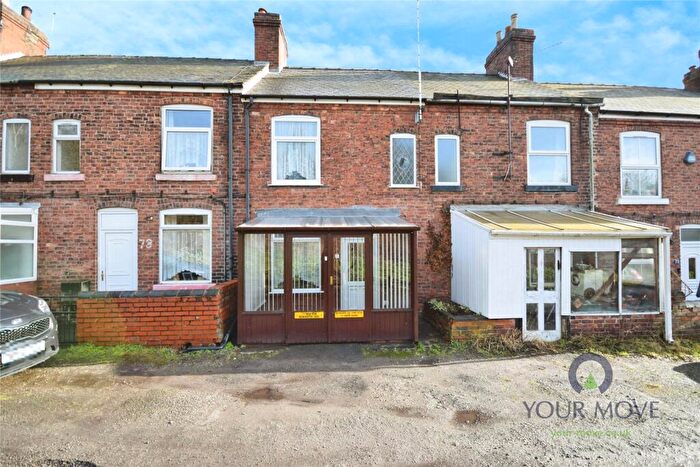
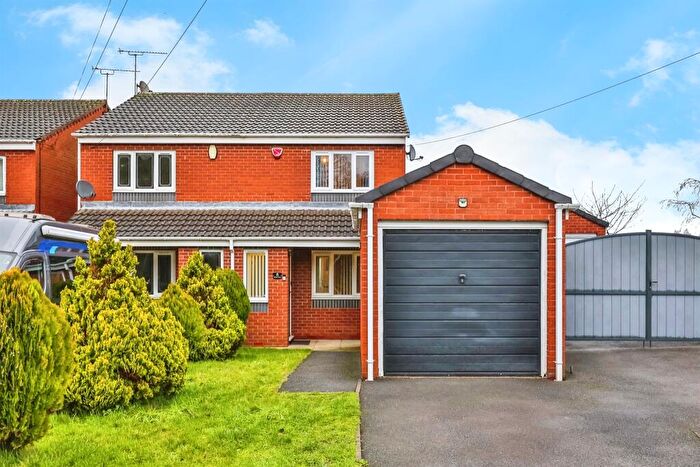
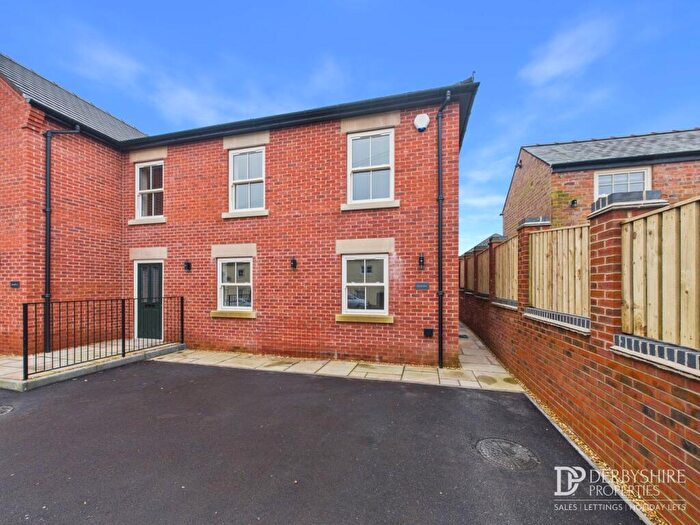
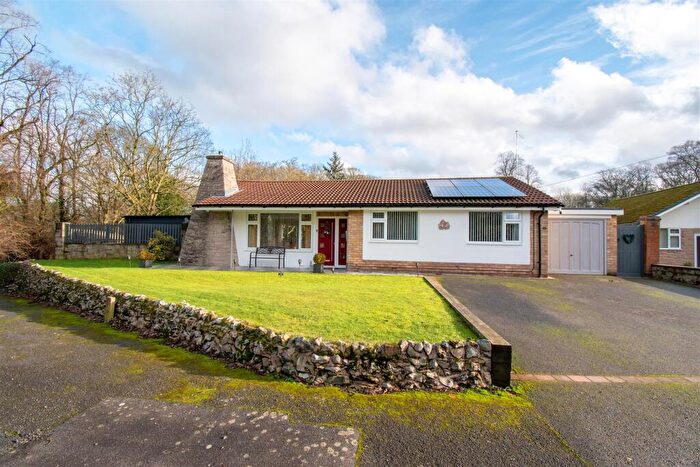
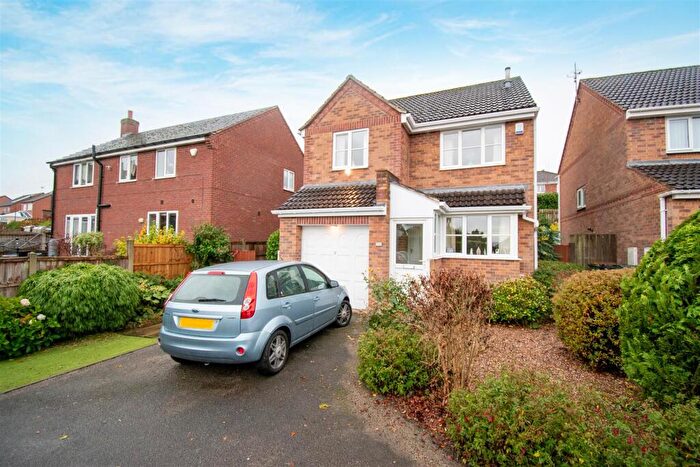
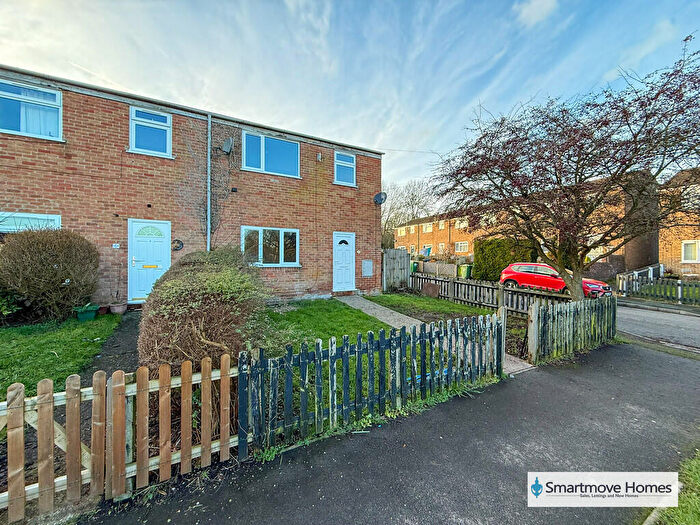
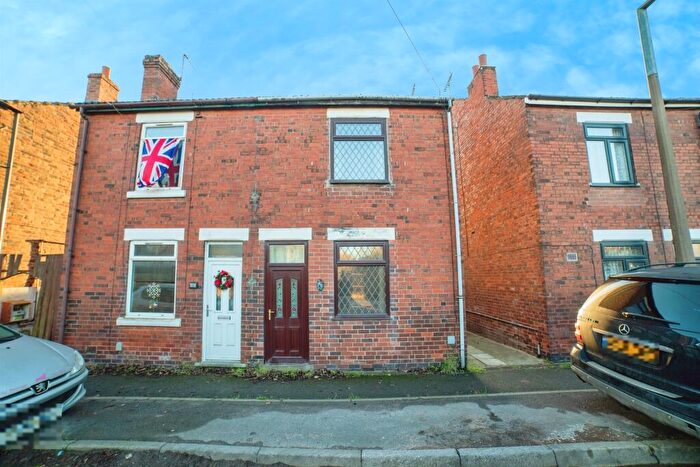
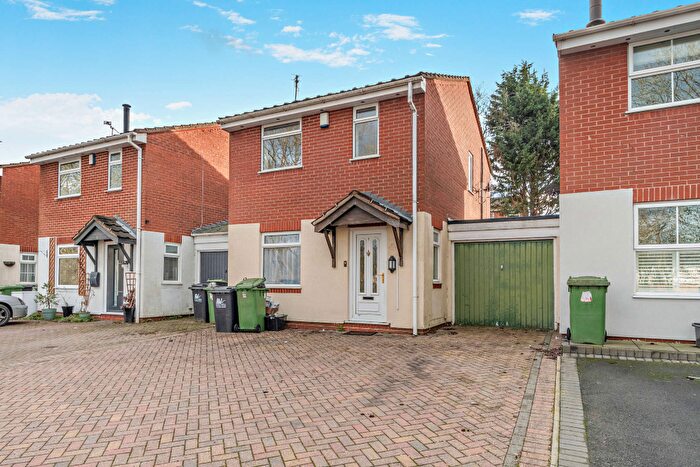
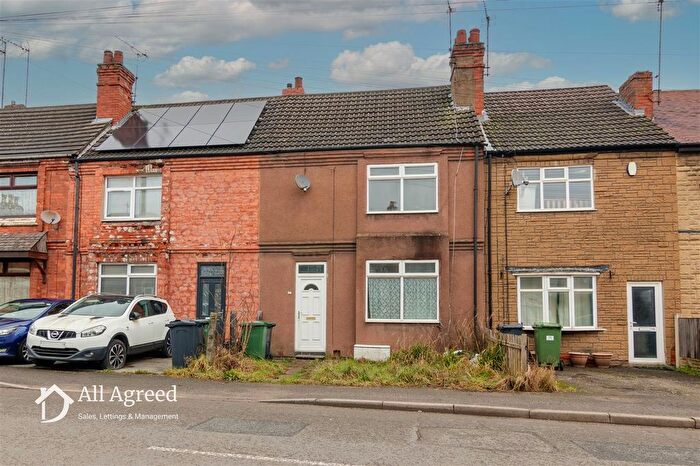
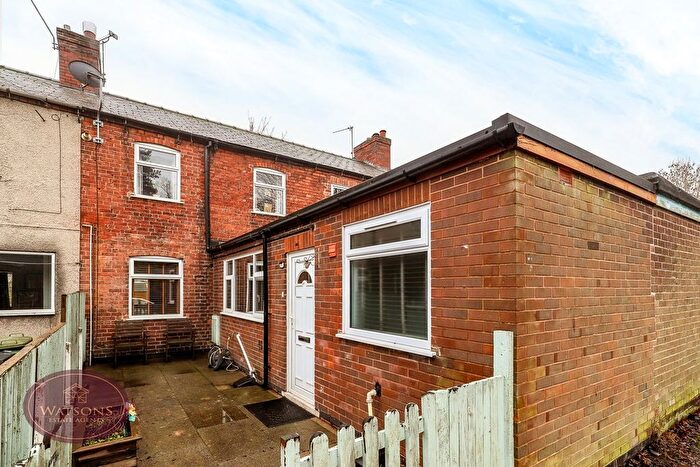
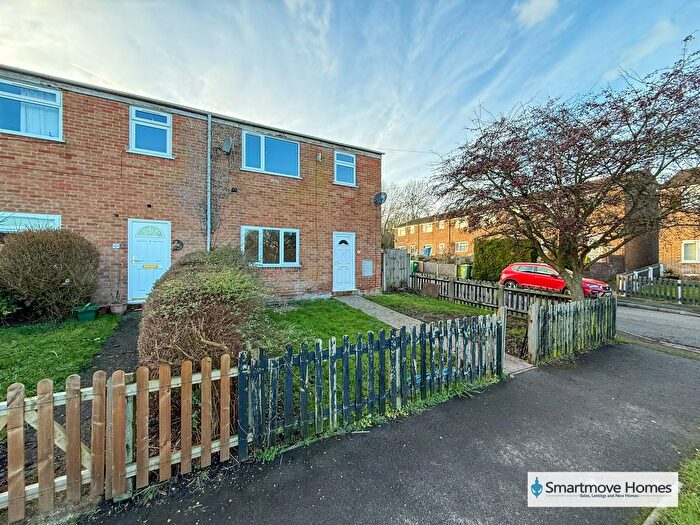
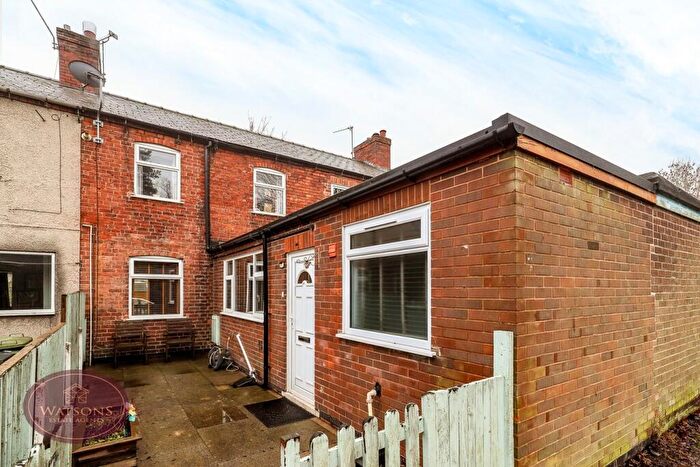
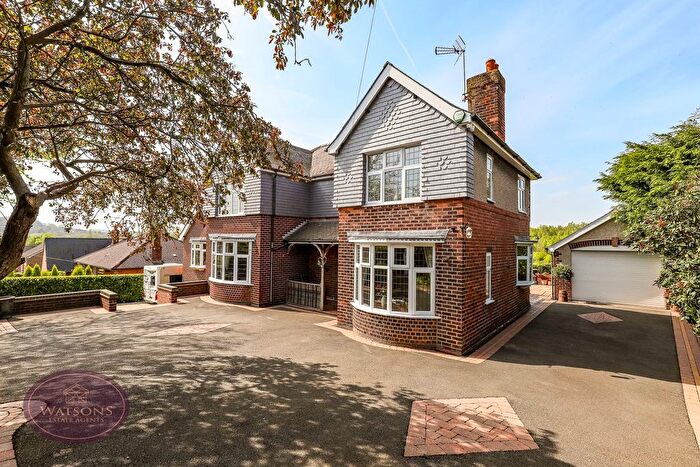
Houses for sale & to rent in Ironville And Riddings, Nottingham
House Prices in Ironville And Riddings
Properties in Ironville And Riddings have an average house price of £170,274.00 and had 66 Property Transactions within the last 3 years¹.
Ironville And Riddings is an area in Nottingham, Derbyshire with 782 households², where the most expensive property was sold for £559,130.00.
Properties for sale in Ironville And Riddings
Previously listed properties in Ironville And Riddings
Roads and Postcodes in Ironville And Riddings
Navigate through our locations to find the location of your next house in Ironville And Riddings, Nottingham for sale or to rent.
| Streets | Postcodes |
|---|---|
| Adelaide Walk | NG16 5QB |
| Albert Street | NG16 5ND NG16 5NS |
| Arthurs View | NG16 5PS |
| Benjamin Court | NG16 5RY |
| Bullock Lane | NG16 5NP |
| Casson Street | NG16 5NN |
| Castlefields | NG16 5QJ |
| Cheviot Avenue | NG16 5QQ |
| Coach Road | NG16 5PX |
| Codnor Park | NG16 5PD NG16 5PE |
| Deepdale | NG16 5QE |
| Elizabeth Park | NG16 5NZ |
| Forge Row | NG16 5PG |
| Jessop Avenue | NG16 5PU |
| Kestrel Heights | NG16 5PW |
| King William Street | NG16 5NG |
| Market Place | NG16 5NH |
| Market Street | NG16 5NJ |
| Meadow Street | NG16 5NU NG16 5NA |
| Monument Lane | NG16 5PJ NG16 5PL |
| New Road | NG16 5PN |
| Nottingham Lane | NG16 5NW |
| Oakes Row | NG16 5NT |
| Old Stone Bridge | NG16 5NE |
| Openacre | NG16 5QA |
| Parkside Close | NG16 5PZ |
| Parkside Drive | NG16 5PY NG16 5QP |
| Pipers Court | NG16 5RZ |
| Pottery Houses | NG16 5PF |
| Queen Street | NG16 5NL |
| Railway Row | NG16 5PH |
| Regent Court | NG16 5QD |
| St Davids Close | NG16 5RW |
| Station Road | NG16 5PP |
| The King William Centre | NG16 5NF |
| The Park | NG16 5PB |
| Thomas Close | NG16 5RX |
| Transport Way | NG16 5DP |
| Vicarage Lane | NG16 5PT |
| Victoria Crescent | NG16 5NX |
| Victoria Street | NG16 5NB |
| Waterside | NG16 5QF |
Transport near Ironville And Riddings
- FAQ
- Price Paid By Year
- Property Type Price
Frequently asked questions about Ironville And Riddings
What is the average price for a property for sale in Ironville And Riddings?
The average price for a property for sale in Ironville And Riddings is £170,274. This amount is 21% lower than the average price in Nottingham. There are 271 property listings for sale in Ironville And Riddings.
What streets have the most expensive properties for sale in Ironville And Riddings?
The streets with the most expensive properties for sale in Ironville And Riddings are Cheviot Avenue at an average of £291,375, Thomas Close at an average of £250,000 and Station Road at an average of £241,250.
What streets have the most affordable properties for sale in Ironville And Riddings?
The streets with the most affordable properties for sale in Ironville And Riddings are Waterside at an average of £88,750, Old Stone Bridge at an average of £91,000 and Market Street at an average of £92,862.
Which train stations are available in or near Ironville And Riddings?
Some of the train stations available in or near Ironville And Riddings are Alfreton, Langley Mill and Kirkby in Ashfield.
Property Price Paid in Ironville And Riddings by Year
The average sold property price by year was:
| Year | Average Sold Price | Price Change |
Sold Properties
|
|---|---|---|---|
| 2025 | £144,242 | -18% |
21 Properties |
| 2024 | £170,437 | -15% |
24 Properties |
| 2023 | £196,120 | 9% |
21 Properties |
| 2022 | £178,081 | -6% |
29 Properties |
| 2021 | £189,580 | 19% |
25 Properties |
| 2020 | £153,111 | 4% |
18 Properties |
| 2019 | £147,166 | 21% |
24 Properties |
| 2018 | £115,851 | -27% |
27 Properties |
| 2017 | £146,552 | -10% |
24 Properties |
| 2016 | £161,330 | 12% |
35 Properties |
| 2015 | £141,530 | -0,1% |
15 Properties |
| 2014 | £141,732 | 17% |
17 Properties |
| 2013 | £117,125 | -18% |
12 Properties |
| 2012 | £137,893 | 33% |
15 Properties |
| 2011 | £92,392 | -33% |
14 Properties |
| 2010 | £123,108 | -12% |
18 Properties |
| 2009 | £137,363 | 22% |
15 Properties |
| 2008 | £107,090 | -73% |
11 Properties |
| 2007 | £185,201 | 27% |
31 Properties |
| 2006 | £134,433 | 3% |
30 Properties |
| 2005 | £131,006 | 8% |
37 Properties |
| 2004 | £120,173 | 19% |
49 Properties |
| 2003 | £97,812 | 31% |
54 Properties |
| 2002 | £67,412 | -7% |
61 Properties |
| 2001 | £72,341 | 23% |
29 Properties |
| 2000 | £55,672 | -29% |
27 Properties |
| 1999 | £71,802 | 34% |
23 Properties |
| 1998 | £47,335 | -11% |
40 Properties |
| 1997 | £52,417 | 9% |
38 Properties |
| 1996 | £47,782 | 6% |
30 Properties |
| 1995 | £44,701 | - |
23 Properties |
Property Price per Property Type in Ironville And Riddings
Here you can find historic sold price data in order to help with your property search.
The average Property Paid Price for specific property types in the last three years are:
| Property Type | Average Sold Price | Sold Properties |
|---|---|---|
| Semi Detached House | £179,543.00 | 22 Semi Detached Houses |
| Detached House | £265,226.00 | 16 Detached Houses |
| Terraced House | £112,478.00 | 22 Terraced Houses |
| Flat | £95,000.00 | 6 Flats |

