
Houses for sale in Nottingham, Derbyshire
House Prices in Nottingham
Properties in Nottingham have an average house price of £217k and had 2,629 Property Transactions within the last 3 years.¹
Nottingham is an area in Derbyshire with 26,732 households², where the most expensive property was sold for £1.18M.
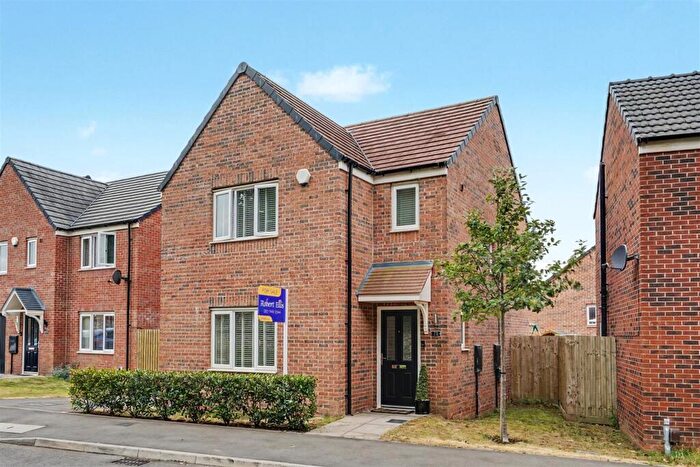
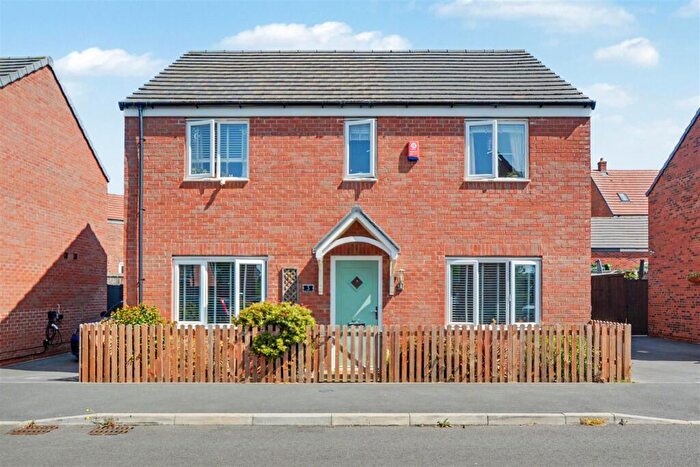
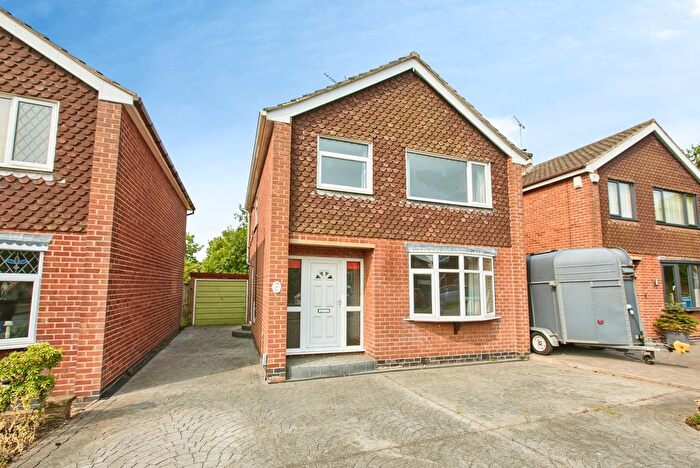
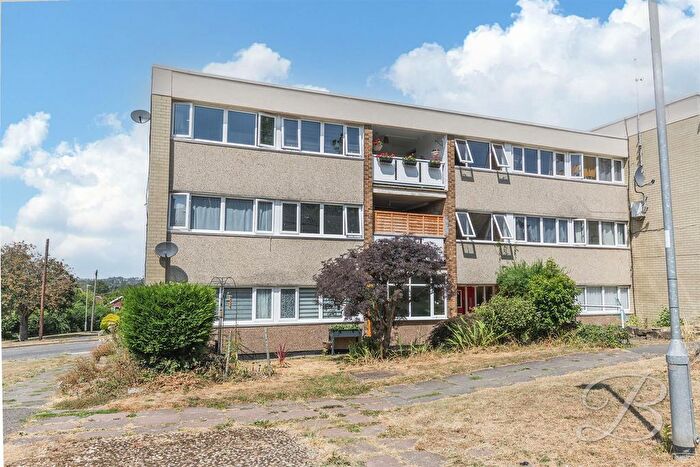
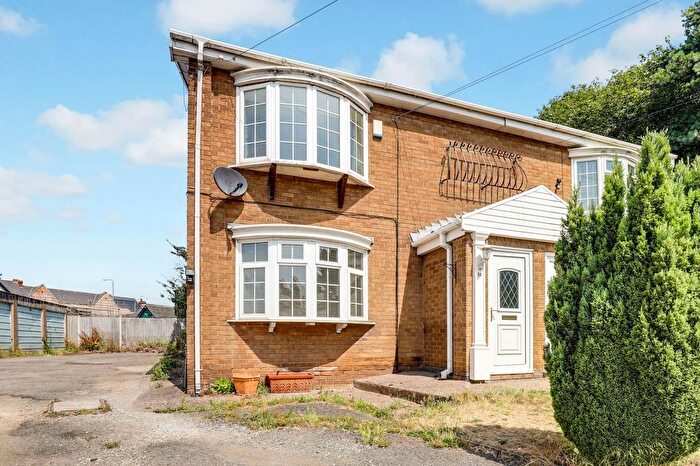
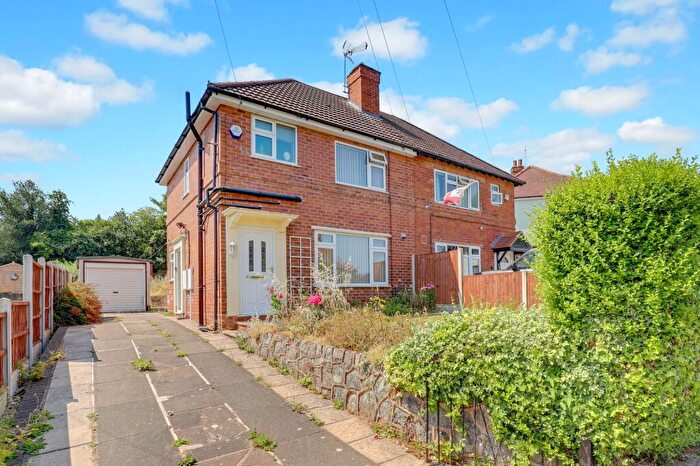
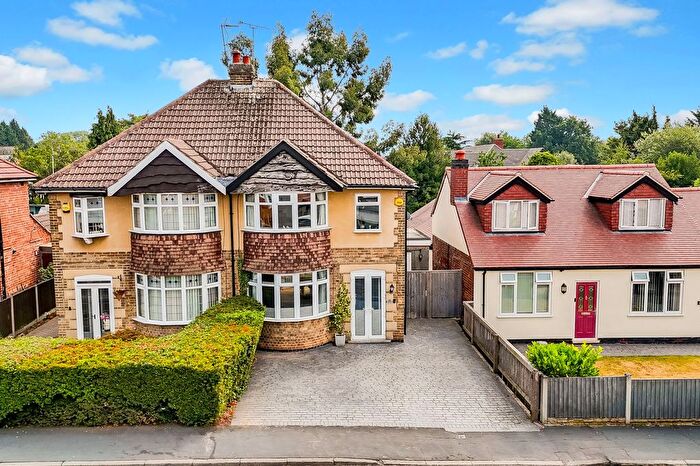
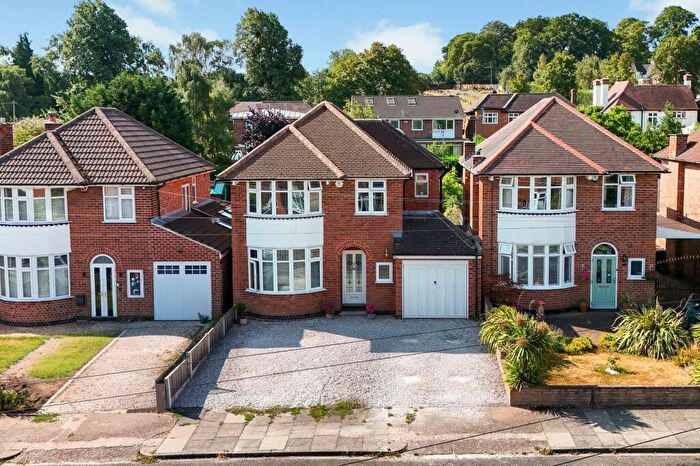
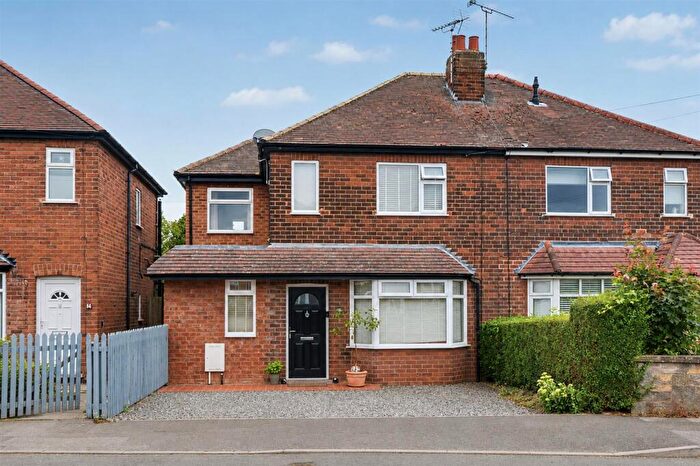
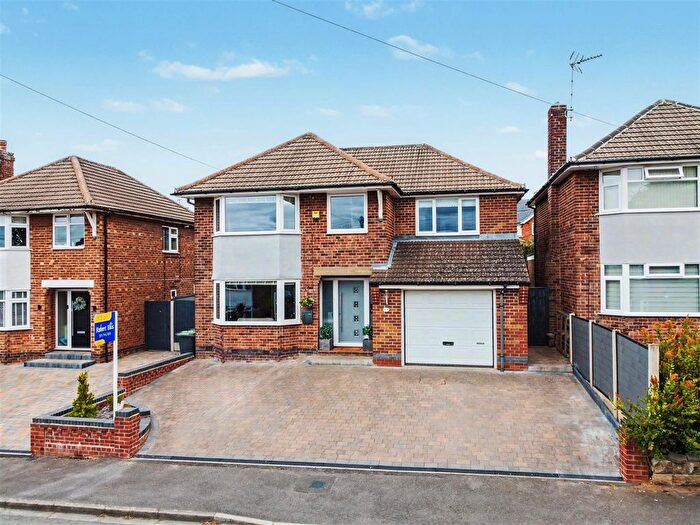
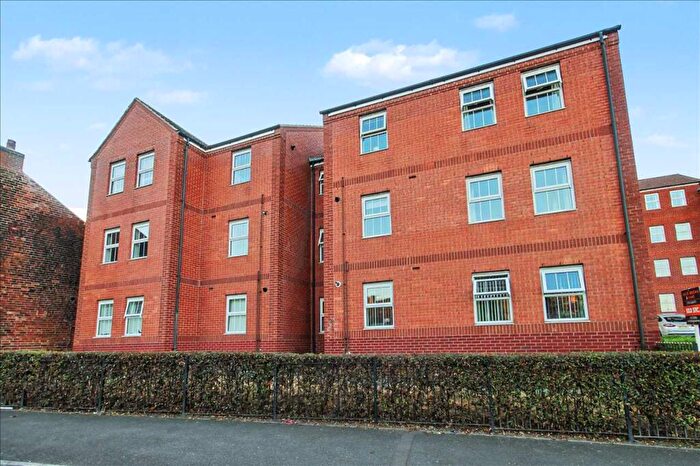
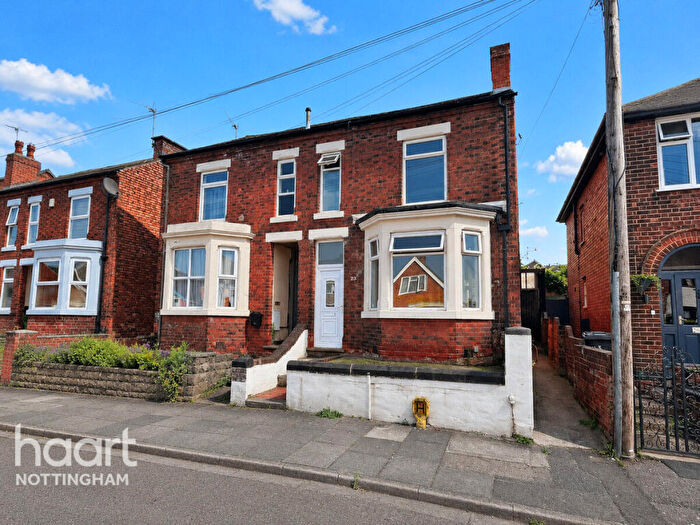
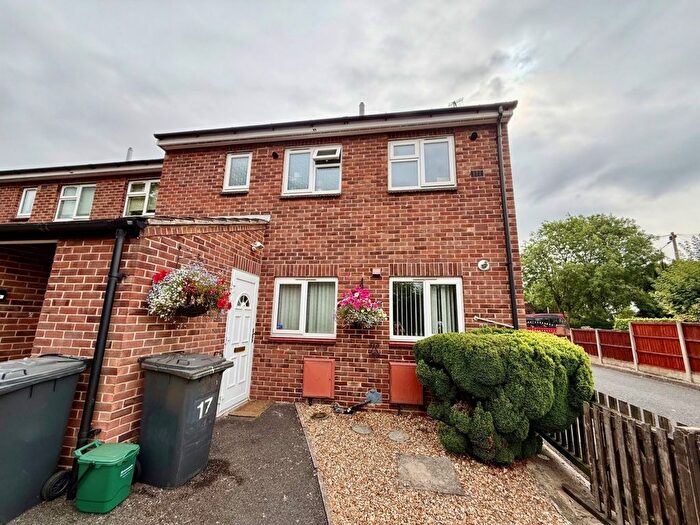
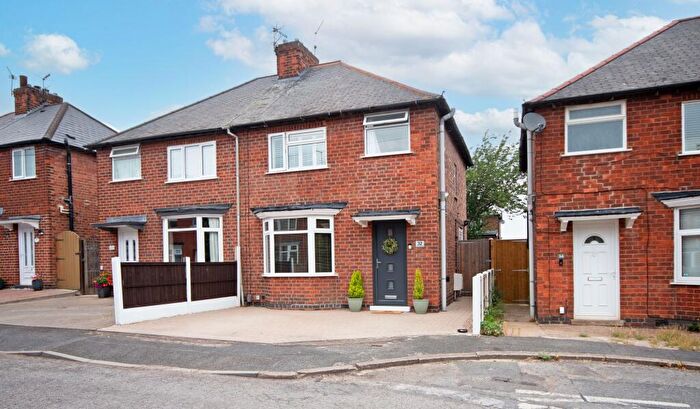
Properties for sale in Nottingham
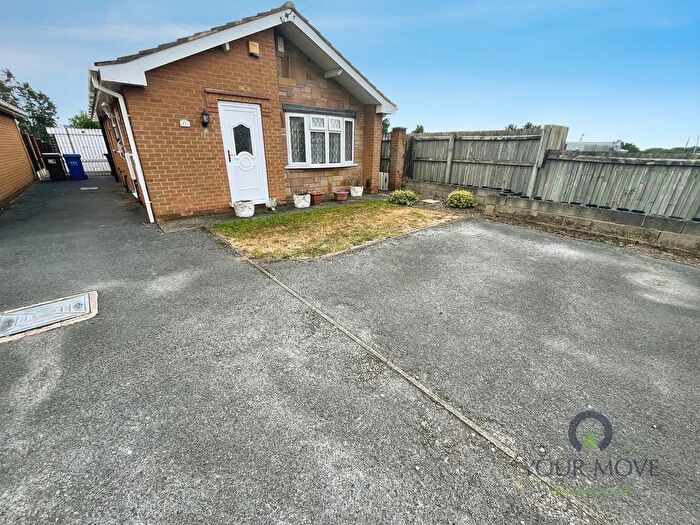
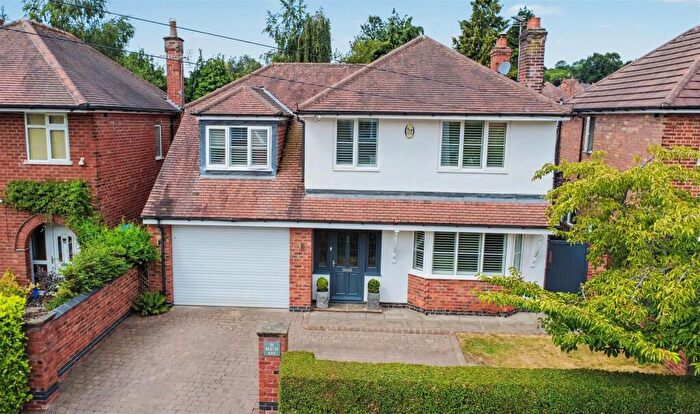
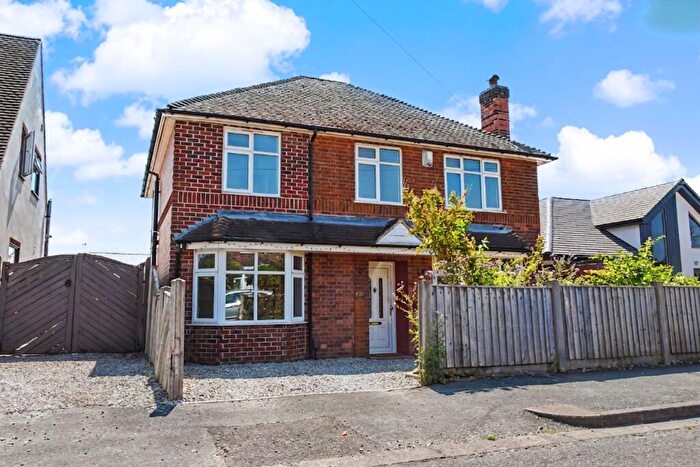
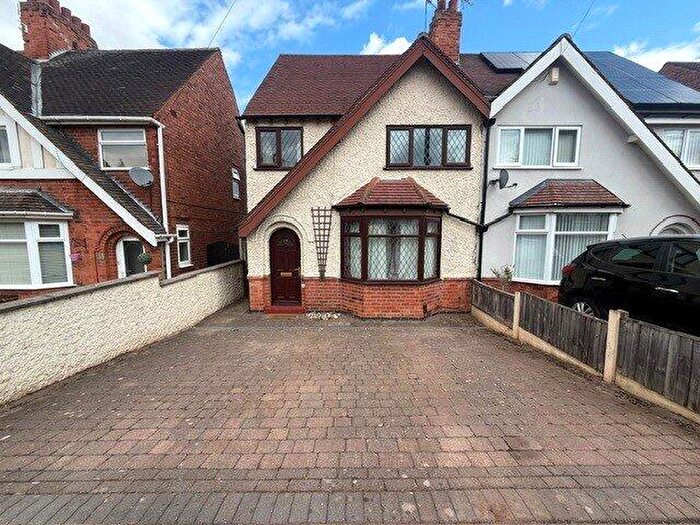
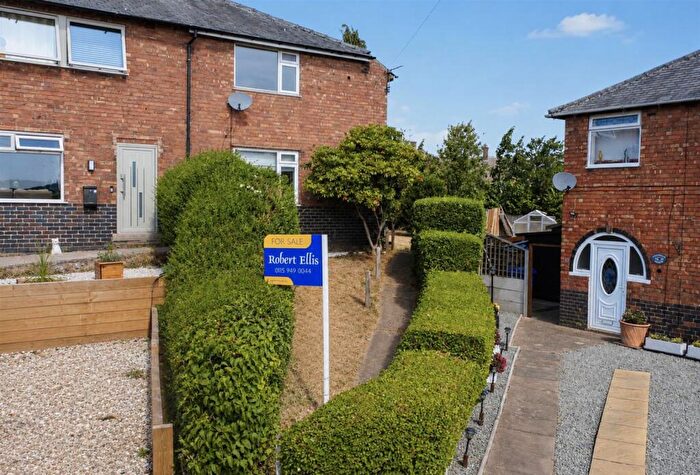
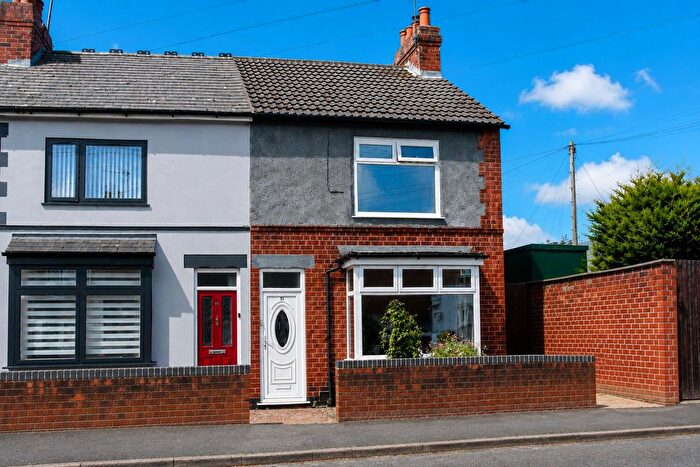
![]()
If you are looking to sell your house, let it out, or receive a property valuation, an expert can help you.
Click the button below to get started.


Neighbourhoods in Nottingham
Navigate through our locations to find the location of your next house in Nottingham, Derbyshire for sale or to rent.
- Codnor And Waingroves
- Derby Road East
- Derby Road West
- Heanor West
- Ironville And Riddings
- Langley Mill And Aldercar
- Long Eaton Central
- Nottingham Road
- Pinxton
- Sandiacre North
- Sandiacre South
- Sawley
- Wilsthorpe
- Toton & Chilwell Meadows
- Daleacre Hill
- Sandiacre
- Draycott & Risley
- Codnor, Langley Mill & Aldercar
Property price trends in Nottingham
According to the latest Land Registry data, the average home in Nottingham sold for £212,044 in 2026. That figure comes from a substantial record of 33,946 sales logged over the past 31 years.
Prices have held fairly steady over the last three years. Compared with 2023, when the typical sale came in around £213,011, values are broadly unchanged.
Looking back five years, average prices are up about 8.4% since 2021, a gain of around £16,439 in cash terms.
Zoom out to the past decade for the fuller picture. Back in 2016, homes here averaged £145,085, so the typical sold price has climbed about 46.2% since then, roughly 3.9% a year. Stretch the view to fifteen years and that annual pace eases back to about 3.6%.
Frequently asked questions about Nottingham
What is the average price for a property for sale in Nottingham?
The average price for a property for sale in Nottingham is £217,215. This amount is 14% lower than the average price in Derbyshire. There are more than 10,000 property listings for sale in Nottingham.
What locations have the most expensive properties for sale in Nottingham?
The locations with the most expensive properties for sale in Nottingham are Codnor And Waingroves at an average of £269,675, Derby Road West at an average of £269,403 and Wilsthorpe at an average of £253,472.
What locations have the most affordable properties for sale in Nottingham?
The locations with the most affordable properties for sale in Nottingham are Langley Mill And Aldercar at an average of £165,702, Pinxton at an average of £168,890 and Ironville And Riddings at an average of £169,942.
Which train stations are available in or near Nottingham?
Some of the train stations available in or near Nottingham are Ilkeston, Attenborough and Long Eaton.
Property Price Paid in Nottingham by Year
The average sold property price by year was:
| Year | Average Sold Price | Price Change |
Sold Properties
|
|---|---|---|---|
| 2026 | £212,044 | -4% |
67 Properties |
| 2025 | £219,597 | 0,4% |
905 Properties |
| 2024 | £218,760 | 3% |
897 Properties |
| 2023 | £213,011 | 1% |
760 Properties |
| 2022 | £210,531 | 7% |
1,078 Properties |
| 2021 | £195,605 | 10% |
1,227 Properties |
| 2020 | £176,711 | 3% |
932 Properties |
| 2019 | £171,049 | 4% |
1,080 Properties |
| 2018 | £163,480 | 6% |
1,084 Properties |
| 2017 | £154,281 | 6% |
1,066 Properties |
Property Price per Property Type in Nottingham
Here you can find historic sold price data in order to help with your property search.
The average Property Paid Price for specific property types in the last three years are:
| Property Type | Average Sold Price | Sold Properties |
|---|---|---|
| Semi Detached House | £207,327.00 | 1,255 Semi Detached Houses |
| Terraced House | £157,749.00 | 618 Terraced Houses |
| Detached House | £314,767.00 | 631 Detached Houses |
| Flat | £118,042.00 | 125 Flats |
Transport in Nottingham
Please see below transportation links in this area:
