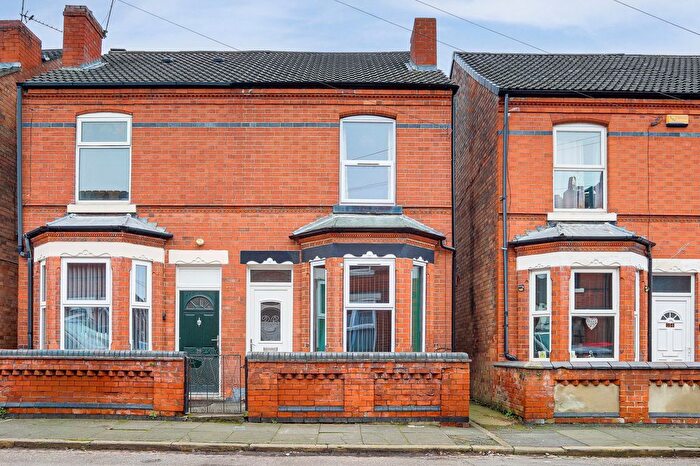
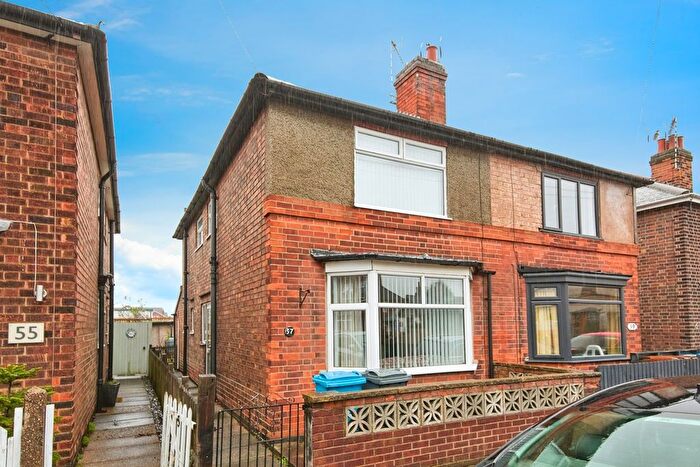
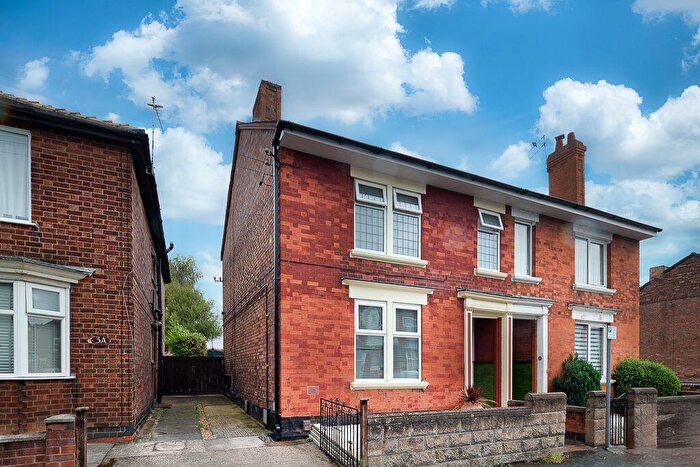
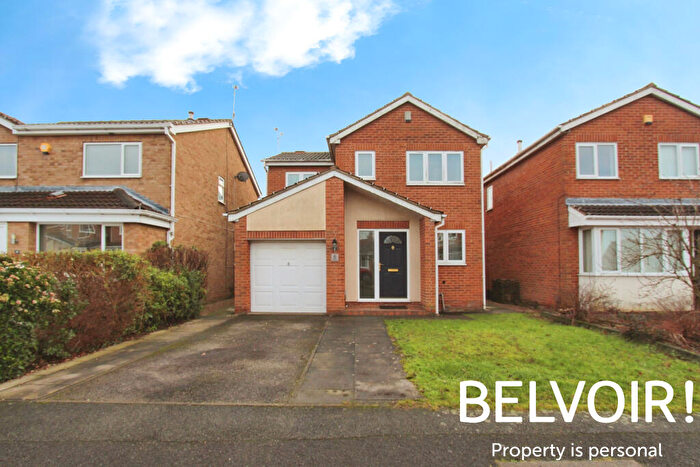
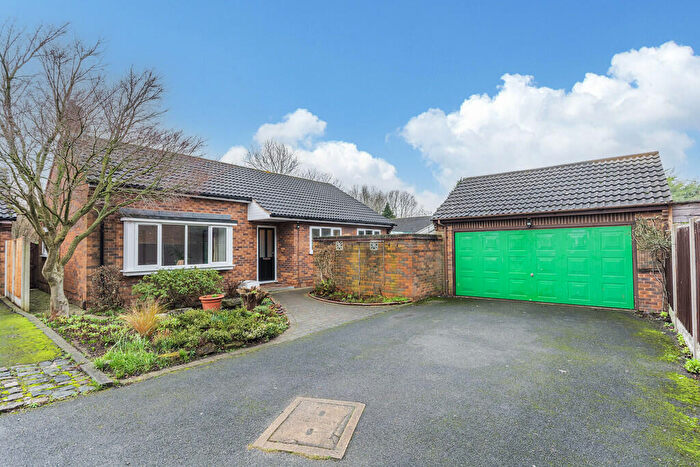
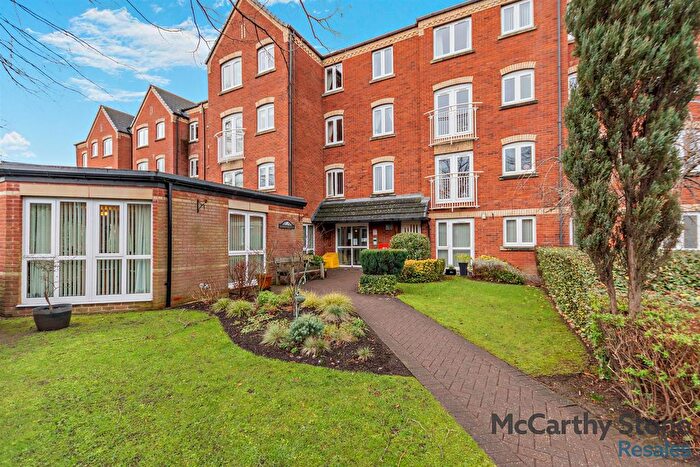
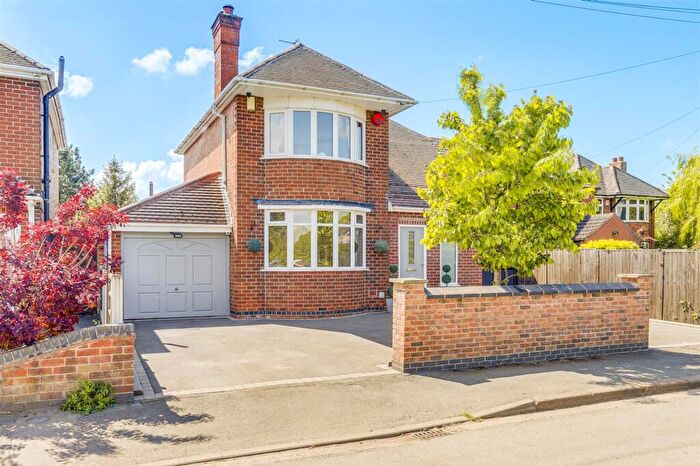
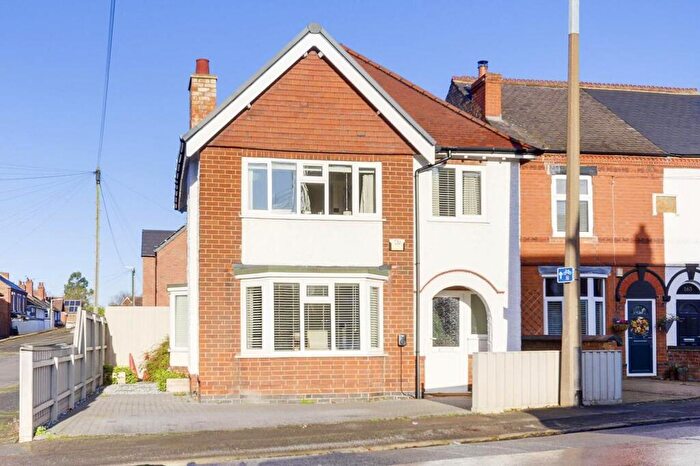
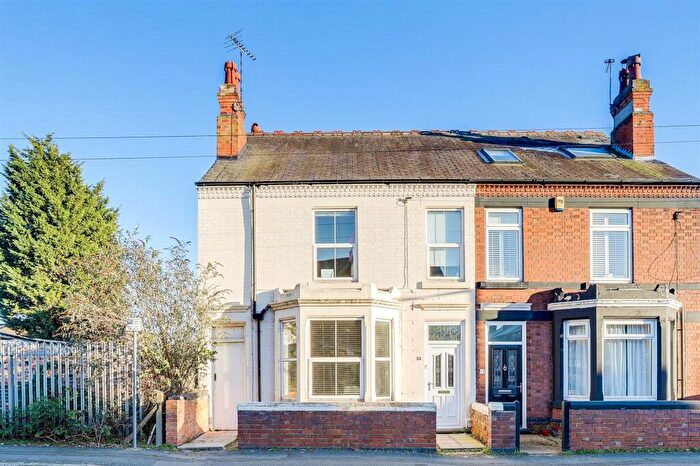
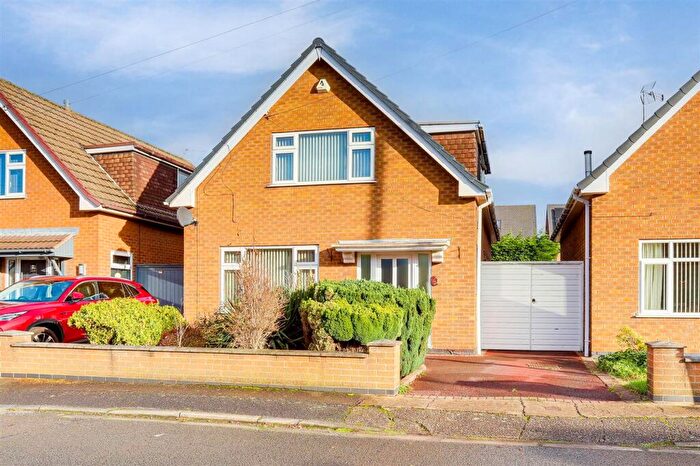
Houses for sale & to rent in Nottingham Road, Nottingham
House Prices in Nottingham Road
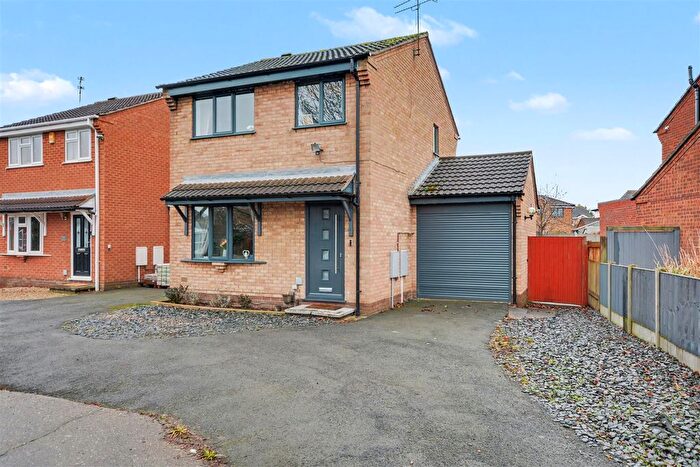
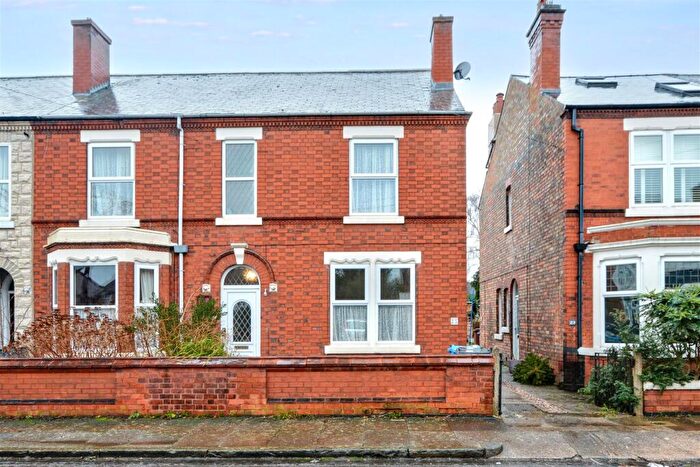
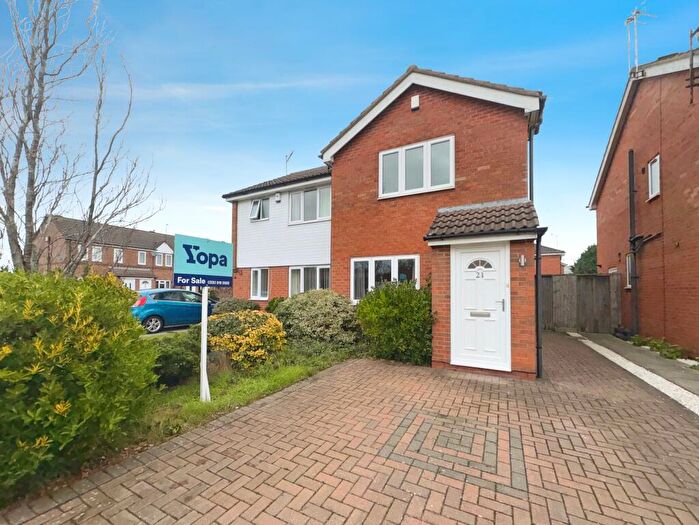
Properties in Nottingham Road have an average house price of £210,082.00 and had 302 Property Transactions within the last 3 years¹.
Nottingham Road is an area in Nottingham, Derbyshire with 2,803 households², where the most expensive property was sold for £650,000.00.
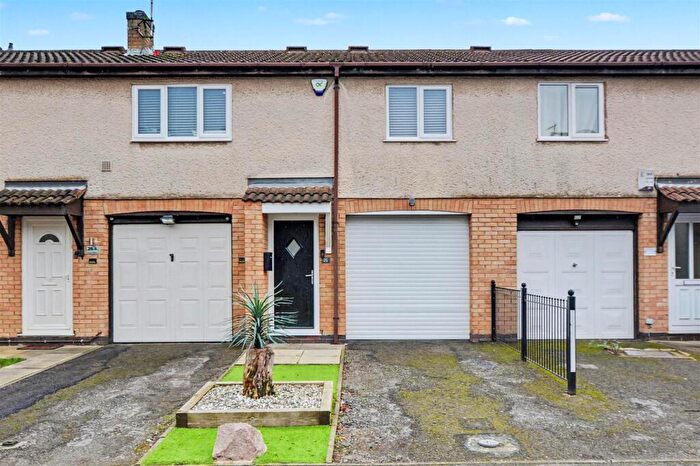
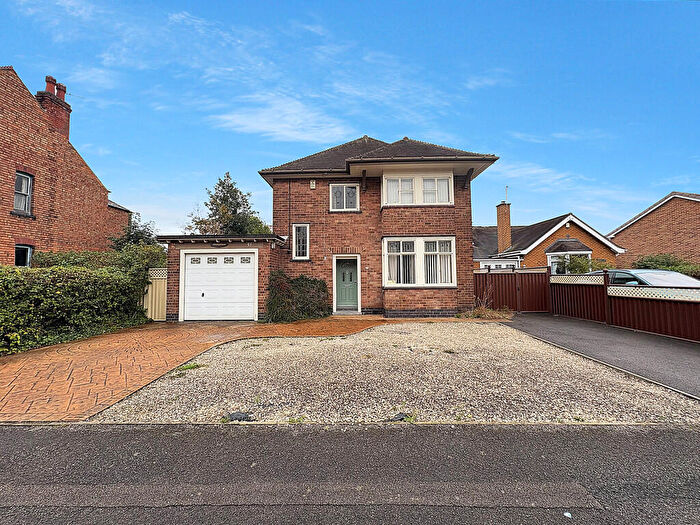
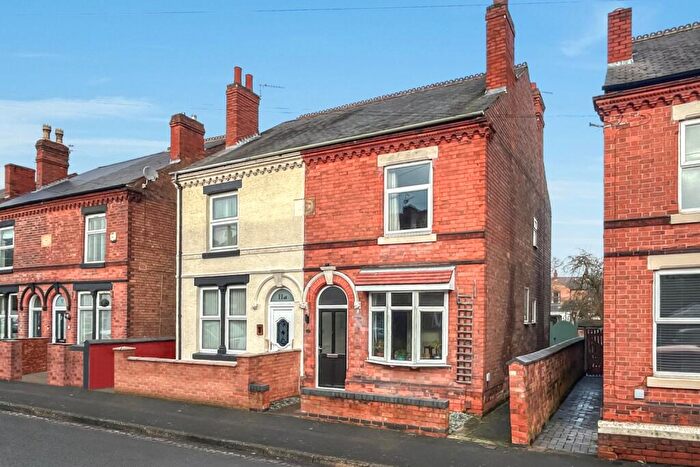
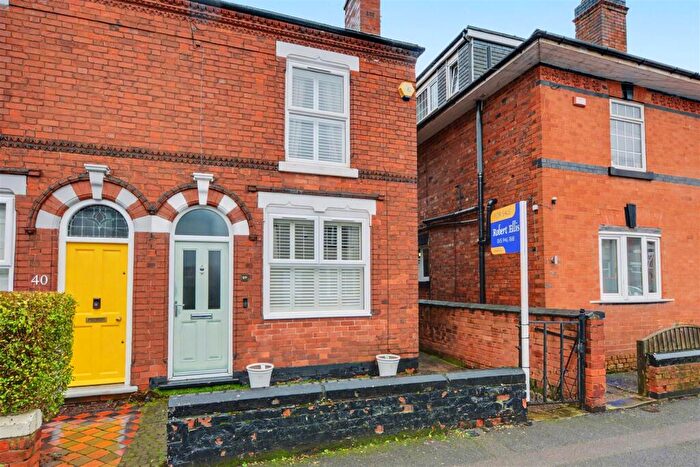
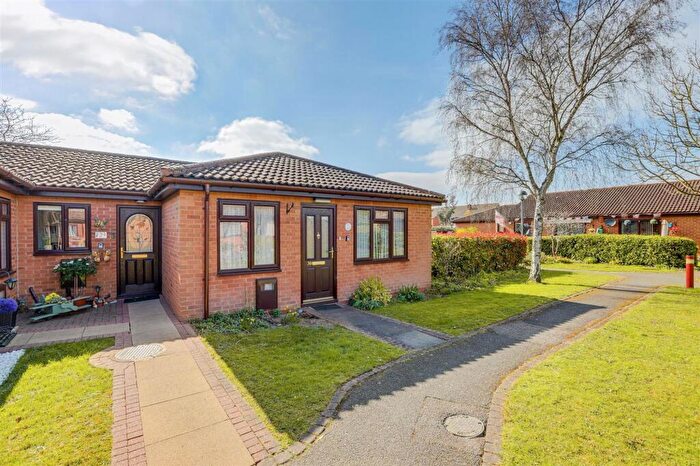
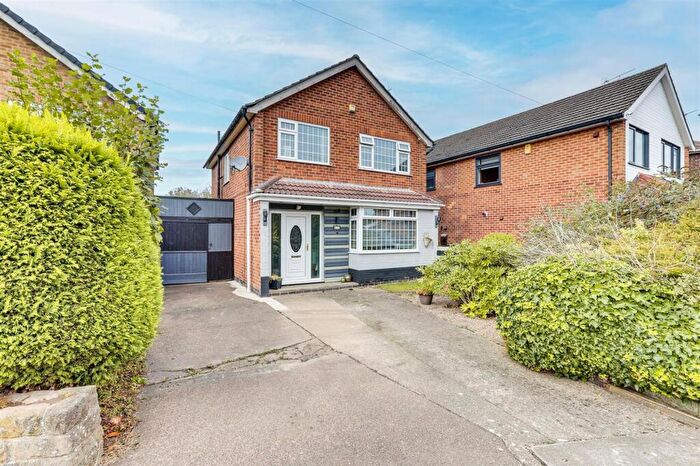
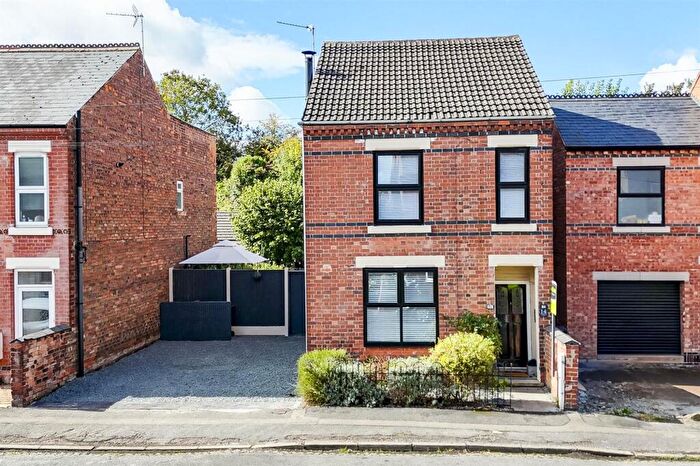
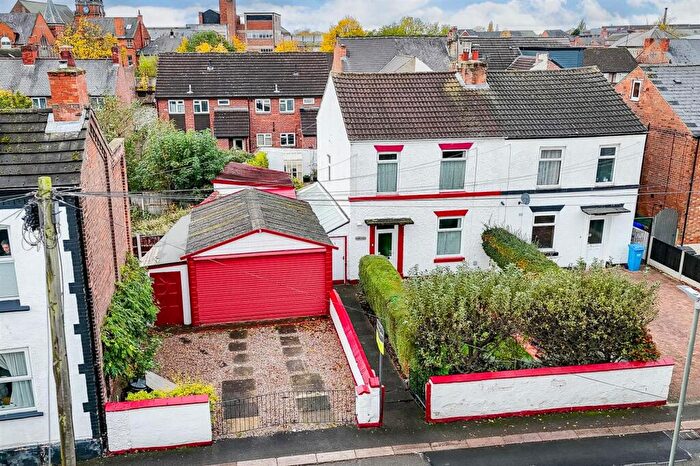
Properties for sale in Nottingham Road
Roads and Postcodes in Nottingham Road
Navigate through our locations to find the location of your next house in Nottingham Road, Nottingham for sale or to rent.
| Streets | Postcodes |
|---|---|
| Albion Road | NG10 2AG |
| Armitage Drive | NG10 2EZ |
| Bale Close | NG10 2GN |
| Barton Road | NG10 2FN |
| Beaconsfield Street | NG10 1AY |
| Beech Avenue | NG10 2AX |
| Belfield Gardens | NG10 1HB |
| Bonsall Court | NG10 2AJ |
| Bonsall Street | NG10 2AH NG10 2AL NG10 2AN |
| Cannock Way | NG10 2EY |
| Carrfield Avenue | NG10 2BW |
| Chapel Street | NG10 1EQ |
| Charlton Avenue | NG10 2BX |
| Chatsworth Avenue | NG10 2FL |
| Chesterfield Avenue | NG10 2DT |
| Circuit Drive | NG10 2GG NG10 2GH |
| Claye Street | NG10 1AZ |
| Cleveland Avenue | NG10 2BT |
| Clifton Avenue | NG10 2GA |
| Conway Street | NG10 2AD NG10 2AE NG10 2AF NG10 2AP |
| Copsey Croft Court | NG10 2FB |
| Cornwall Drive | NG10 2GR |
| Craig Street | NG10 1ET |
| Cranmer Street | NG10 1NJ NG10 1NL NG10 1NQ |
| Dale Avenue | NG10 1NP |
| Denacre Avenue | NG10 2BJ |
| Devonshire Avenue | NG10 2EP |
| Doncaster Grove | NG10 2BA |
| Dunston Close | NG10 2EX |
| East Street | NG10 2DH |
| Florence Avenue | NG10 2BE |
| Frederick Street | NG10 2DR |
| George Avenue | NG10 2BP |
| Gibb Street | NG10 1EE NG10 1EP |
| Grange Drive | NG10 2DQ |
| Grange Park | NG10 2EF |
| Grange Road | NG10 2EH |
| Greenside Close | NG10 1GX |
| Harlaxton Drive | NG10 2ER |
| Hemlock Avenue | NG10 1NS |
| High Street | NG10 1GH NG10 1HY |
| Holyoake Drive | NG10 2FJ |
| Honey Pot Close | NG10 2GS |
| Howard Close | NG10 1NG |
| Invaders Close | NG10 2GJ |
| Landsdown Grove | NG10 2BD NG10 2BH |
| Lichfield Close | NG10 2EW |
| Main Street | NG10 1GN NG10 1GR NG10 1GT NG10 1GU NG10 1GW |
| Margaret Avenue | NG10 2BG |
| Market Place | NG10 1LS |
| Marlborough Road | NG10 2BS |
| Mayfield Grove | NG10 2AY |
| Meadow Lane | NG10 2FD NG10 2FE NG10 2FP NG10 2FQ NG10 2GD |
| Mill Court | NG10 1EL |
| New Tythe Street | NG10 2DL |
| Newbery Avenue | NG10 2FT NG10 2FU |
| Norfolk Road | NG10 2AW NG10 2AZ NG10 2BB NG10 2BL |
| Northcote Street | NG10 1EZ |
| Nottingham Road | NG10 2AA NG10 2AB NG10 2AU NG10 2BN NG10 2BU NG10 2BY NG10 2BZ NG10 2EN NG10 2EQ |
| Olive Avenue | NG10 1NN |
| Orchard Street | NG10 1EW |
| Owen Avenue | NG10 2FR NG10 2FS |
| Pasture Lane | NG10 2FZ |
| Phyllis Grove | NG10 2DS |
| Recreation Street | NG10 2DE NG10 2DW |
| Romorantin Place | NG10 1BB |
| Royal Avenue | NG10 1NU |
| Rugeley Avenue | NG10 2EU |
| Salisbury Street | NG10 1BA |
| Somerset Close | NG10 2ET |
| South Street | NG10 1ER |
| Speedway Close | NG10 2GL |
| Springfield Avenue | NG10 2GQ |
| Stafford Street | NG10 2EA NG10 2ED |
| Stanley Street | NG10 1EY |
| Station Road | NG10 2DF NG10 2DG NG10 2DJ NG10 2DX NG10 2EE NG10 2EJ NG10 2EL NG10 2GP NG10 2DU |
| Tamworth Road | NG10 1JF |
| The Hollows | NG10 2ES |
| Thorneywood Road | NG10 2DY NG10 2DZ |
| Thornfield Square | NG10 2AR |
| Thrumpton Avenue | NG10 2GB |
| Trafalgar Square | NG10 1GQ |
| Trafalgar Terrace | NG10 1GP |
| Trent Cottages | NG10 2FW |
| Trent Lane | NG10 2FX |
| Trenton Drive | NG10 2EG |
| Tudor Close | NG10 1NF |
| Union Street | NG10 1HH |
| Walton Street | NG10 1PA NG10 1PB |
| Warwick Road | NG10 2EB |
| Willow Avenue | NG10 1NT |
| Worrall Avenue | NG10 1NR |
Transport near Nottingham Road
- FAQ
- Price Paid By Year
- Property Type Price
Frequently asked questions about Nottingham Road
What is the average price for a property for sale in Nottingham Road?
The average price for a property for sale in Nottingham Road is £210,082. This amount is 3% lower than the average price in Nottingham. There are 1,267 property listings for sale in Nottingham Road.
What streets have the most expensive properties for sale in Nottingham Road?
The streets with the most expensive properties for sale in Nottingham Road are Cornwall Drive at an average of £365,000, Grange Drive at an average of £360,000 and Nottingham Road at an average of £349,944.
What streets have the most affordable properties for sale in Nottingham Road?
The streets with the most affordable properties for sale in Nottingham Road are Market Place at an average of £56,500, Trafalgar Terrace at an average of £93,450 and High Street at an average of £95,000.
Which train stations are available in or near Nottingham Road?
Some of the train stations available in or near Nottingham Road are Long Eaton, Attenborough and East Midlands Parkway.
Property Price Paid in Nottingham Road by Year
The average sold property price by year was:
| Year | Average Sold Price | Price Change |
Sold Properties
|
|---|---|---|---|
| 2025 | £212,500 | 3% |
97 Properties |
| 2024 | £206,811 | -2% |
113 Properties |
| 2023 | £211,551 | -4% |
92 Properties |
| 2022 | £220,389 | 12% |
127 Properties |
| 2021 | £194,648 | 12% |
170 Properties |
| 2020 | £171,548 | -1% |
117 Properties |
| 2019 | £173,803 | 5% |
158 Properties |
| 2018 | £164,501 | 6% |
143 Properties |
| 2017 | £154,220 | 7% |
126 Properties |
| 2016 | £142,825 | 11% |
118 Properties |
| 2015 | £127,119 | 5% |
150 Properties |
| 2014 | £121,161 | -21% |
118 Properties |
| 2013 | £147,196 | 2% |
125 Properties |
| 2012 | £144,699 | 12% |
112 Properties |
| 2011 | £126,844 | 6% |
74 Properties |
| 2010 | £119,456 | 4% |
86 Properties |
| 2009 | £114,284 | -5% |
87 Properties |
| 2008 | £120,218 | -8% |
82 Properties |
| 2007 | £129,863 | 6% |
146 Properties |
| 2006 | £121,645 | 7% |
185 Properties |
| 2005 | £113,093 | 4% |
131 Properties |
| 2004 | £109,118 | 7% |
158 Properties |
| 2003 | £101,954 | 26% |
153 Properties |
| 2002 | £75,003 | 22% |
204 Properties |
| 2001 | £58,694 | 15% |
179 Properties |
| 2000 | £49,858 | 8% |
186 Properties |
| 1999 | £45,943 | -2% |
169 Properties |
| 1998 | £46,967 | 10% |
147 Properties |
| 1997 | £42,415 | 24% |
133 Properties |
| 1996 | £32,127 | -21% |
213 Properties |
| 1995 | £38,834 | - |
152 Properties |
Property Price per Property Type in Nottingham Road
Here you can find historic sold price data in order to help with your property search.
The average Property Paid Price for specific property types in the last three years are:
| Property Type | Average Sold Price | Sold Properties |
|---|---|---|
| Semi Detached House | £209,758.00 | 165 Semi Detached Houses |
| Detached House | £319,575.00 | 50 Detached Houses |
| Terraced House | £153,242.00 | 74 Terraced Houses |
| Flat | £116,634.00 | 13 Flats |

