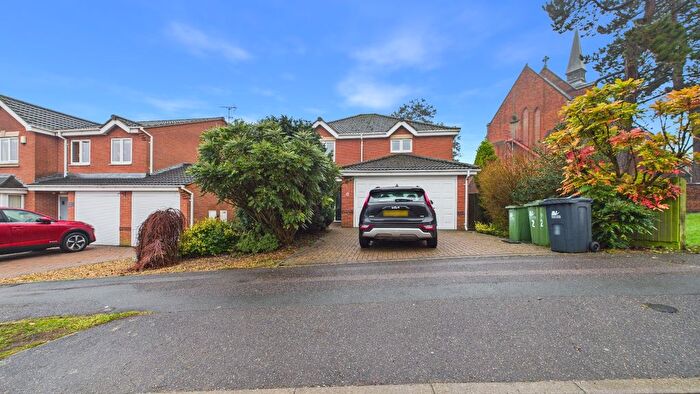
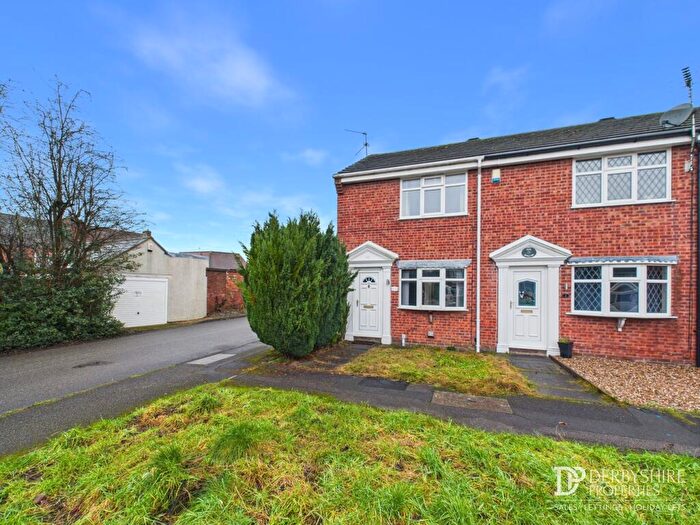
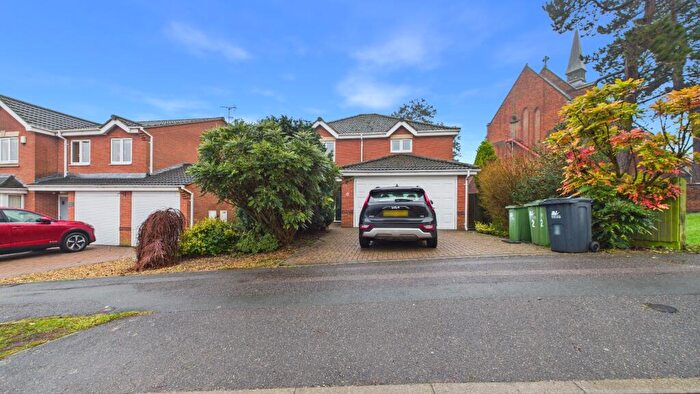
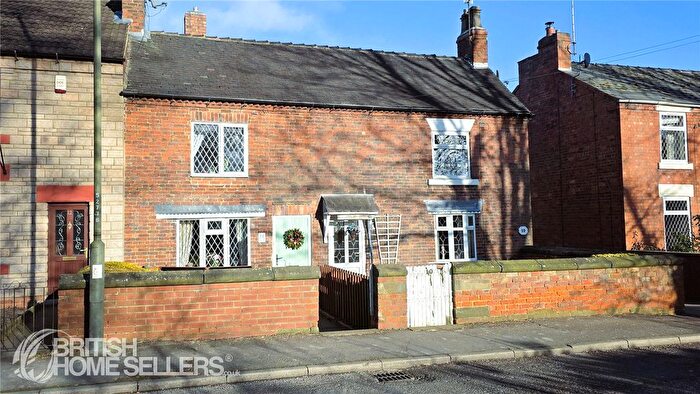
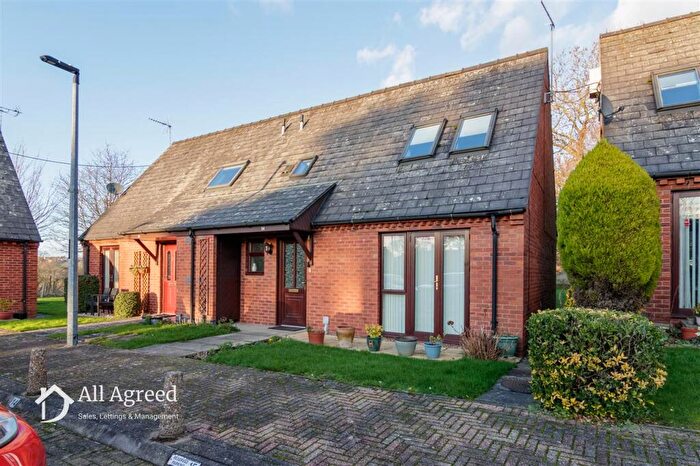
Houses for sale & to rent in Kilburn, Denby And Holbrook, Ripley
House Prices in Kilburn, Denby And Holbrook
Properties in Kilburn, Denby And Holbrook have an average house price of £272,670.00 and had 81 Property Transactions within the last 3 years¹.
Kilburn, Denby And Holbrook is an area in Ripley, Derbyshire with 696 households², where the most expensive property was sold for £660,000.00.
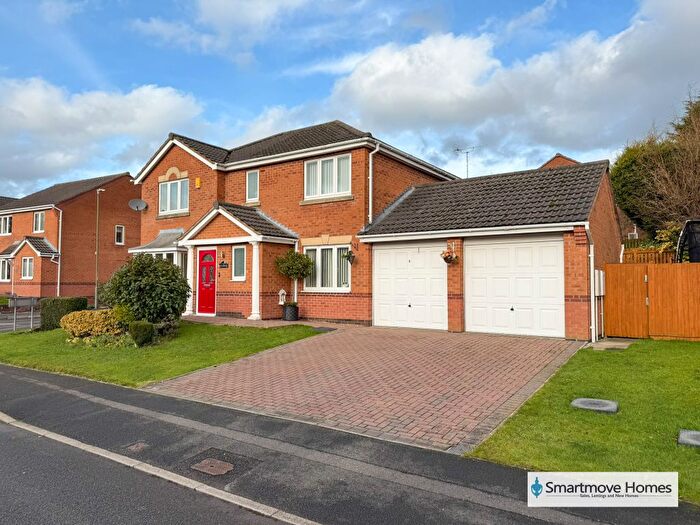
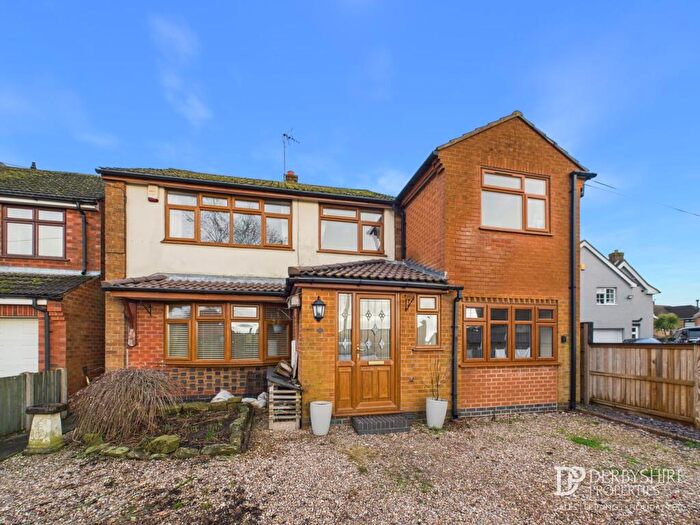
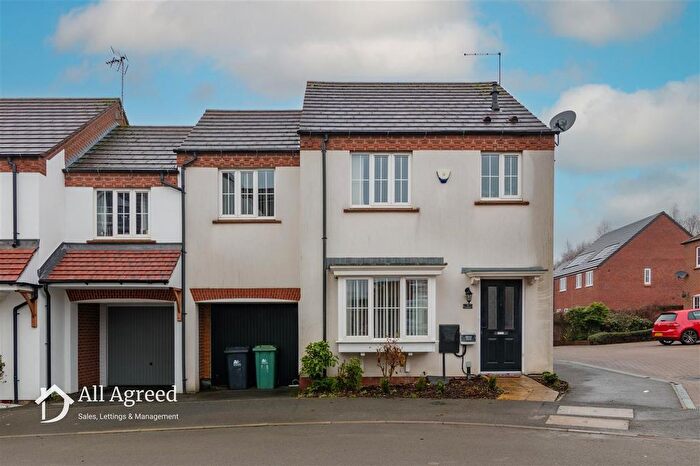
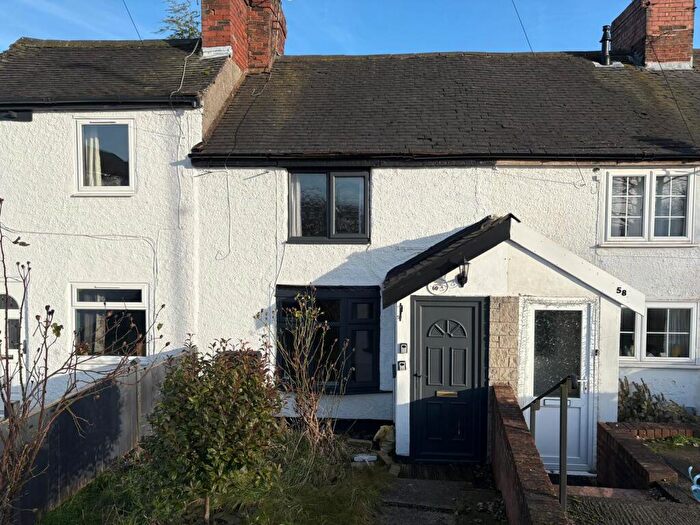
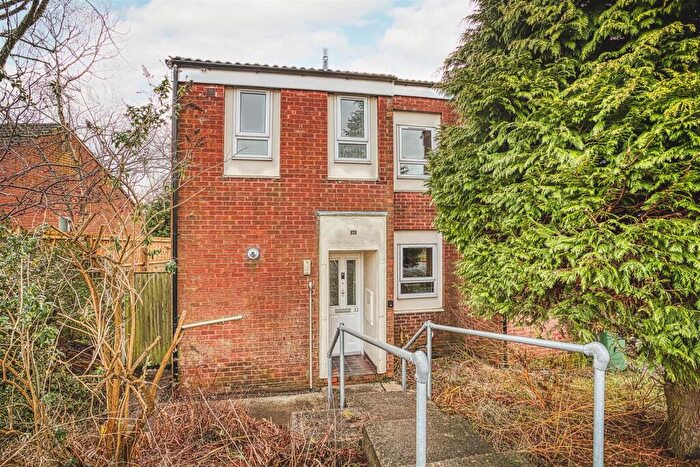
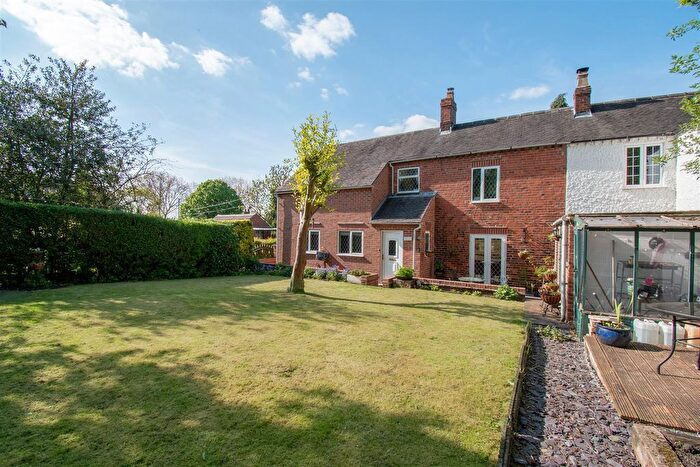
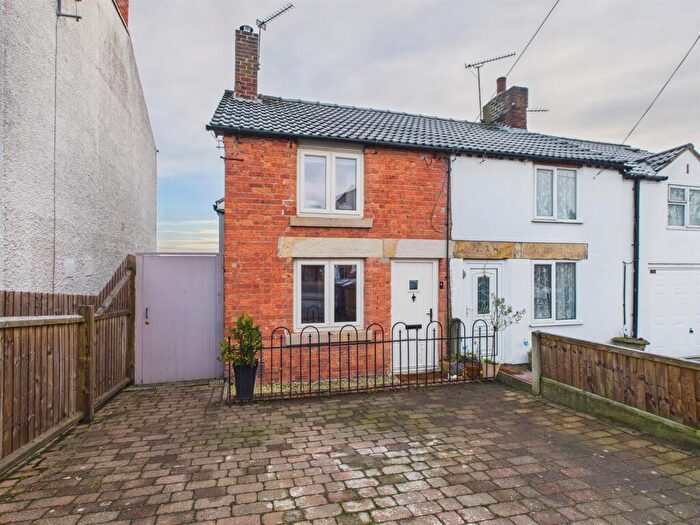
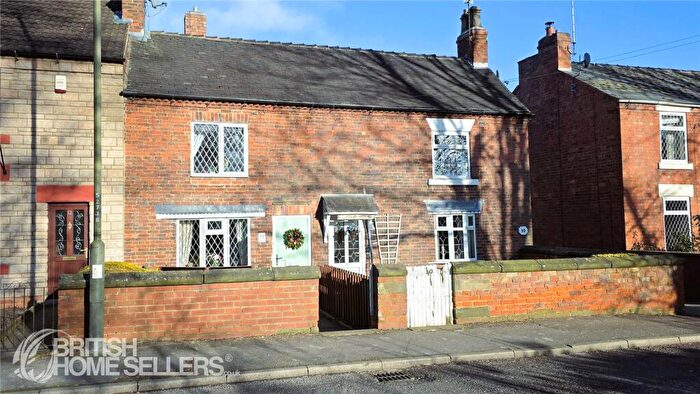
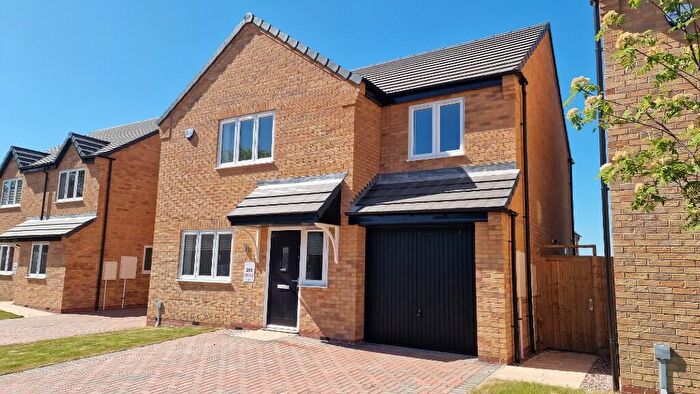
Properties for sale in Kilburn, Denby And Holbrook
Roads and Postcodes in Kilburn, Denby And Holbrook
Navigate through our locations to find the location of your next house in Kilburn, Denby And Holbrook, Ripley for sale or to rent.
| Streets | Postcodes |
|---|---|
| Bottles Farm Close | DE5 8RP |
| Bourne Place | DE5 8RJ |
| Breach Road | DE5 8PS |
| Brookvale Avenue | DE5 8NS |
| Brookvale Rise | DE5 8NT |
| Brookvale Road | DE5 8NR |
| Church Court | DE5 8PG |
| Church Street | DE5 8PA DE5 8PH DE5 8PJ |
| Codnor Denby Lane | DE5 8PT |
| Danesby Crescent | DE5 8RF |
| Danesby Rise | DE5 8RG |
| Denby Bank | DE5 8LA DE5 8LB DE5 8LD |
| Denby Common | DE5 8PW |
| Denby Hall Business Park | DE5 8JX |
| Denby Hall Way | DE5 8JZ |
| Denby Village | DE5 8PF |
| Derby Road | DE5 8NA DE5 8NN DE5 8NQ DE5 8RA DE5 8RB DE5 8RD DE5 8LG DE5 8NP |
| Flamstead Lane | DE5 8PE |
| Heanor Road | DE5 8PN |
| High Bank | DE5 8PL |
| Oaklands Close | DE5 8PB |
| Ormonde Drive Hall Business Park | DE5 8LE |
| Park Hall Road | DE5 8NB DE5 8PX |
| Parsons Grove | DE5 8PY |
| Pippin Hill | DE5 8PD |
| Prospect Road | DE5 8RE DE5 8JS |
| Railway Side | DE5 8RH |
| Ryefields Close | DE5 8LJ |
| Ryknield Hill | DE5 8NW |
| Salterwood Drive | DE5 8JY |
| Salterwood Drive Hall Business Park | DE5 8LH |
| Sapphire Drive | DE5 8NL |
| Station Road | DE5 8ND |
| Sterling Close | DE5 8NU |
| The College | DE5 8NJ |
| DE5 8NX DE5 8RL |
Transport near Kilburn, Denby And Holbrook
- FAQ
- Price Paid By Year
- Property Type Price
Frequently asked questions about Kilburn, Denby And Holbrook
What is the average price for a property for sale in Kilburn, Denby And Holbrook?
The average price for a property for sale in Kilburn, Denby And Holbrook is £272,670. This amount is 30% higher than the average price in Ripley. There are 1,260 property listings for sale in Kilburn, Denby And Holbrook.
What streets have the most expensive properties for sale in Kilburn, Denby And Holbrook?
The streets with the most expensive properties for sale in Kilburn, Denby And Holbrook are Codnor Denby Lane at an average of £441,100, Sapphire Drive at an average of £411,250 and Ryknield Hill at an average of £336,325.
What streets have the most affordable properties for sale in Kilburn, Denby And Holbrook?
The streets with the most affordable properties for sale in Kilburn, Denby And Holbrook are Bourne Place at an average of £110,000, Brookvale Rise at an average of £155,000 and Danesby Rise at an average of £168,428.
Which train stations are available in or near Kilburn, Denby And Holbrook?
Some of the train stations available in or near Kilburn, Denby And Holbrook are Belper, Duffield and Langley Mill.
Property Price Paid in Kilburn, Denby And Holbrook by Year
The average sold property price by year was:
| Year | Average Sold Price | Price Change |
Sold Properties
|
|---|---|---|---|
| 2025 | £307,518 | 24% |
27 Properties |
| 2024 | £235,190 | -19% |
30 Properties |
| 2023 | £280,317 | 14% |
24 Properties |
| 2022 | £240,701 | -5% |
32 Properties |
| 2021 | £252,691 | 23% |
41 Properties |
| 2020 | £195,368 | -29% |
52 Properties |
| 2019 | £252,998 | 23% |
36 Properties |
| 2018 | £195,393 | 6% |
44 Properties |
| 2017 | £184,527 | 4% |
40 Properties |
| 2016 | £176,808 | 7% |
42 Properties |
| 2015 | £165,302 | 3% |
40 Properties |
| 2014 | £160,885 | -0,5% |
62 Properties |
| 2013 | £161,630 | 2% |
58 Properties |
| 2012 | £158,351 | -12% |
31 Properties |
| 2011 | £176,972 | -9% |
20 Properties |
| 2010 | £192,421 | 9% |
16 Properties |
| 2009 | £174,839 | -11% |
19 Properties |
| 2008 | £193,246 | 10% |
15 Properties |
| 2007 | £174,460 | 7% |
36 Properties |
| 2006 | £161,861 | 9% |
42 Properties |
| 2005 | £146,721 | -33% |
33 Properties |
| 2004 | £195,747 | 29% |
34 Properties |
| 2003 | £139,636 | 1% |
42 Properties |
| 2002 | £138,089 | 20% |
66 Properties |
| 2001 | £110,069 | 10% |
45 Properties |
| 2000 | £99,097 | 34% |
17 Properties |
| 1999 | £65,010 | 10% |
34 Properties |
| 1998 | £58,600 | -20% |
10 Properties |
| 1997 | £70,114 | 18% |
17 Properties |
| 1996 | £57,550 | 7% |
22 Properties |
| 1995 | £53,283 | - |
17 Properties |
Property Price per Property Type in Kilburn, Denby And Holbrook
Here you can find historic sold price data in order to help with your property search.
The average Property Paid Price for specific property types in the last three years are:
| Property Type | Average Sold Price | Sold Properties |
|---|---|---|
| Semi Detached House | £261,334.00 | 28 Semi Detached Houses |
| Detached House | £371,036.00 | 26 Detached Houses |
| Terraced House | £204,590.00 | 22 Terraced Houses |
| Flat | £124,200.00 | 5 Flats |

