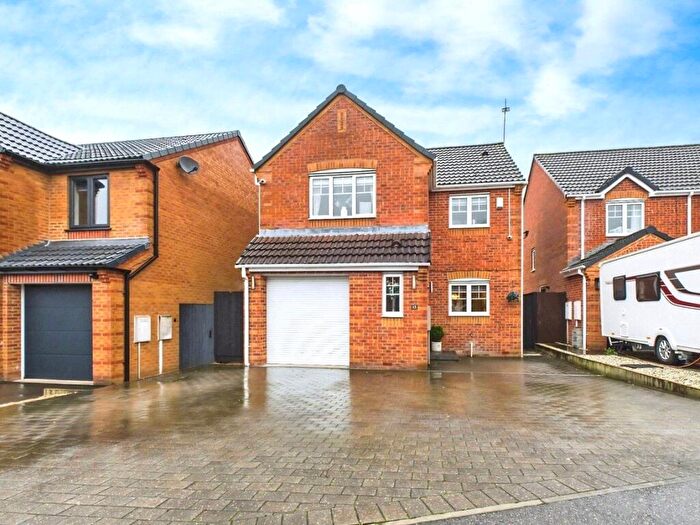
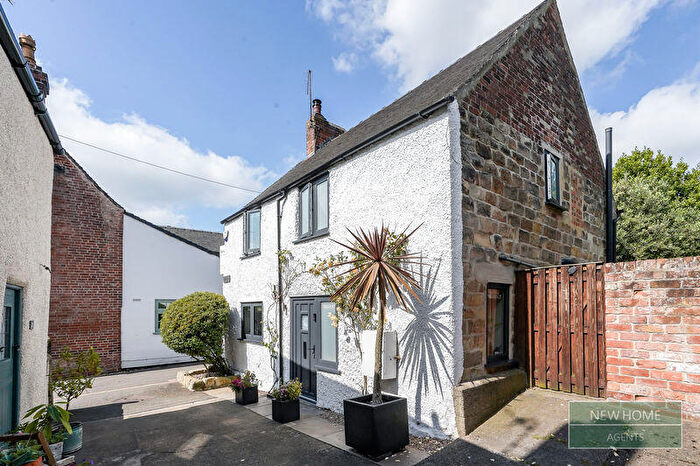
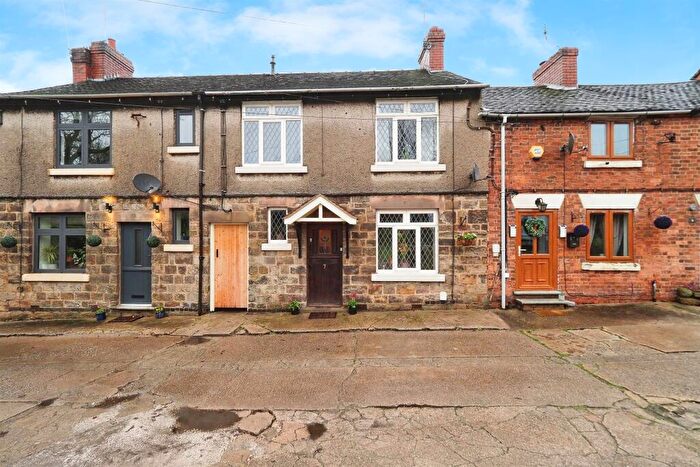
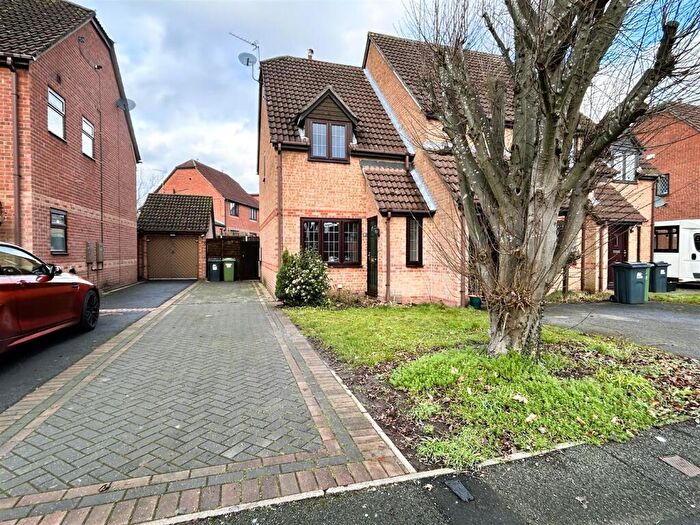
Houses for sale & to rent in Kilburn, Denby And Holbrook, Belper
House Prices in Kilburn, Denby And Holbrook
Properties in Kilburn, Denby And Holbrook have an average house price of £250,780.00 and had 211 Property Transactions within the last 3 years¹.
Kilburn, Denby And Holbrook is an area in Belper, Derbyshire with 2,530 households², where the most expensive property was sold for £660,000.00.
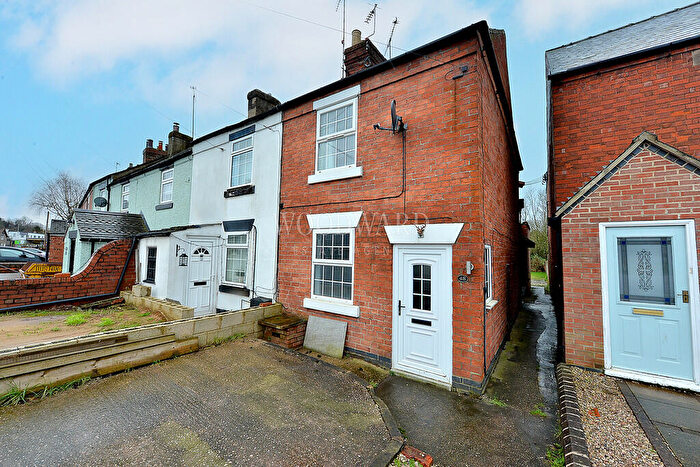
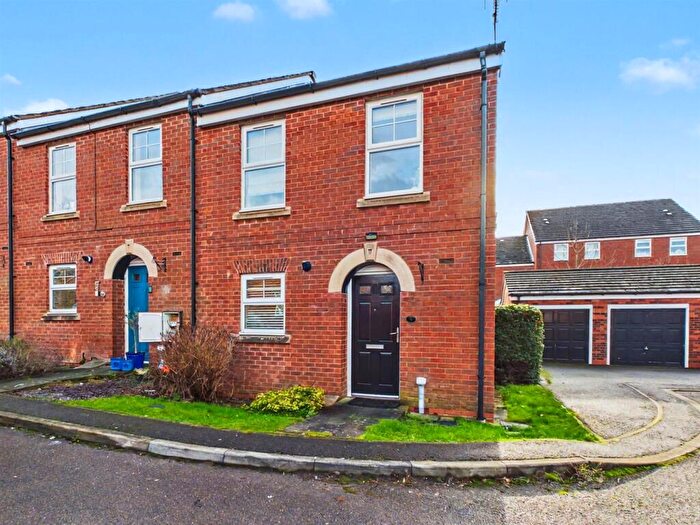
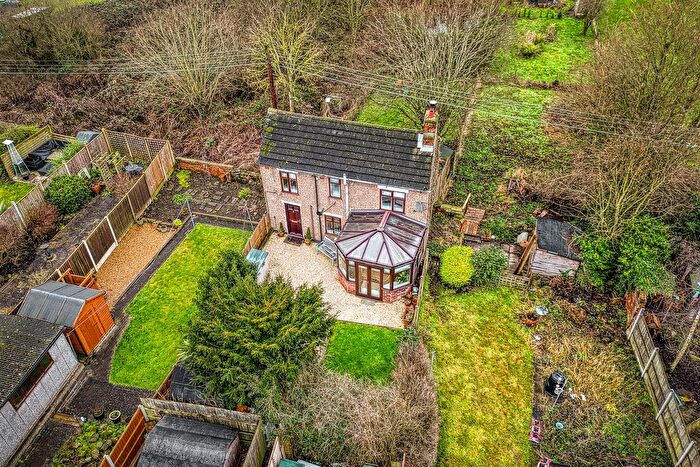
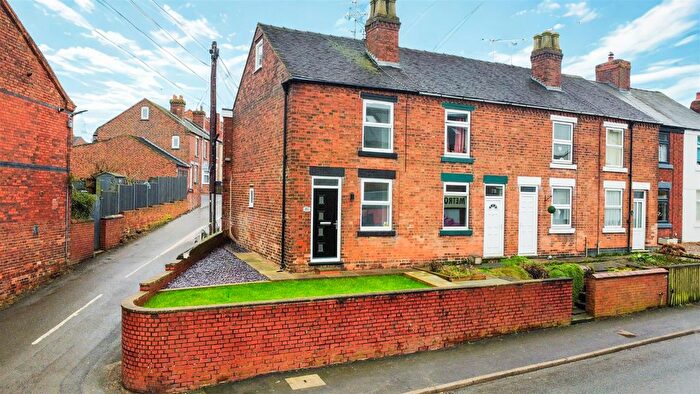
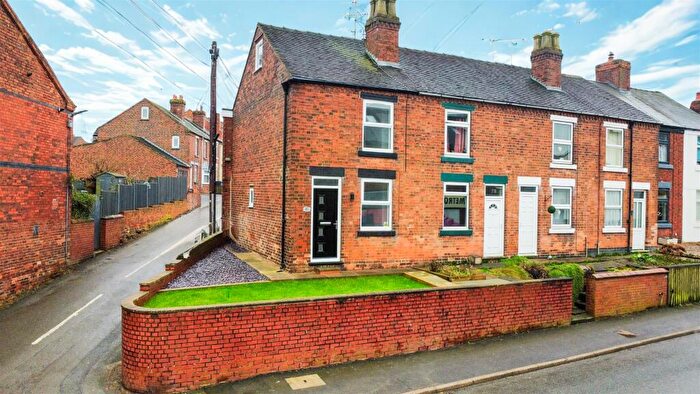
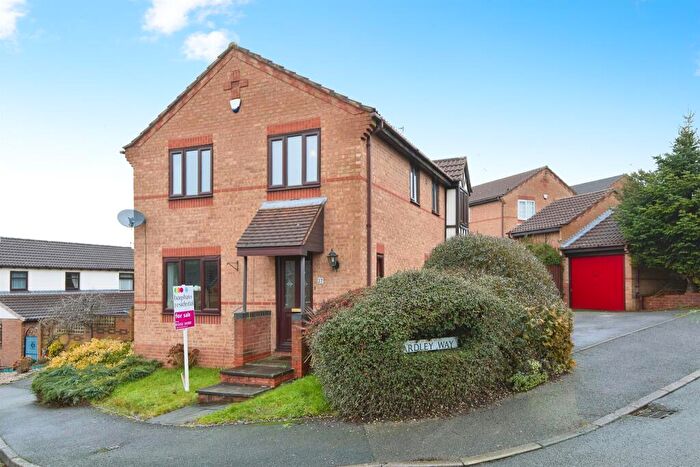
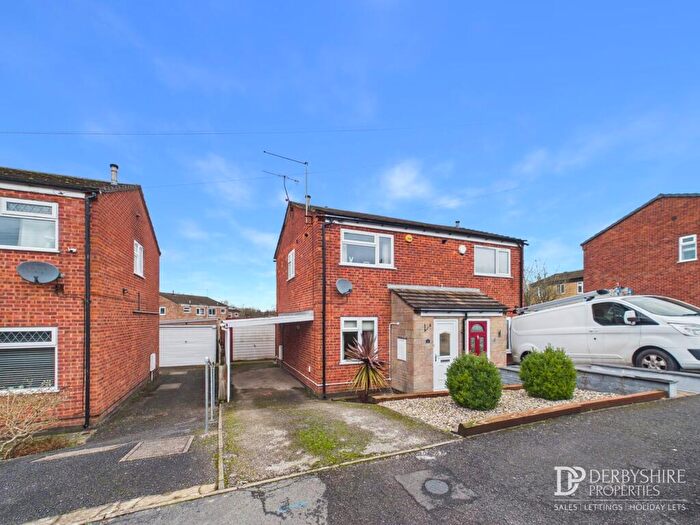
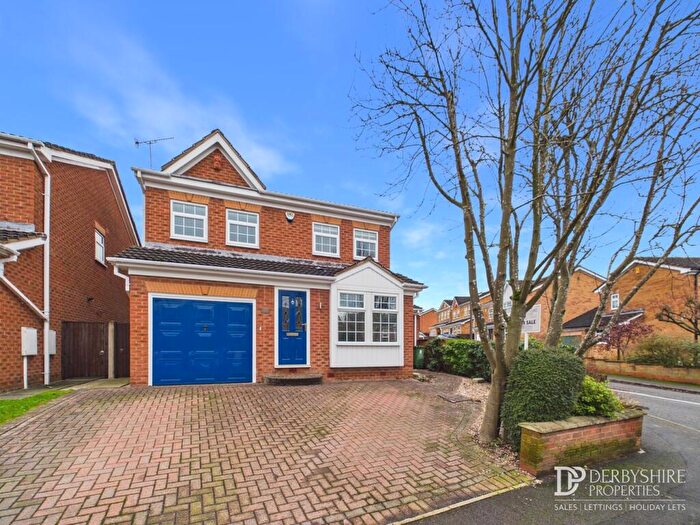
Properties for sale in Kilburn, Denby And Holbrook
Roads and Postcodes in Kilburn, Denby And Holbrook
Navigate through our locations to find the location of your next house in Kilburn, Denby And Holbrook, Belper for sale or to rent.
| Streets | Postcodes |
|---|---|
| Abbey Dale Close | DE56 0PY |
| Alfred Road | DE56 0NQ |
| Beech Close | DE56 0PH |
| Belper Road | DE56 0LP DE56 0SU DE56 0SX DE56 0LQ DE56 0LR |
| Blackberry Way | DE56 0LE |
| Blackbird Row | DE56 0SW |
| Blackthorne Close | DE56 0LF |
| Bottle Brook | DE56 0PD |
| Bowler Drive | DE56 0JR |
| Bown Close | DE56 0NJ |
| Bradshaw Drive | DE56 0SZ |
| Bramble Way | DE56 0LH |
| Brickyard Lane | DE56 0LL |
| Browns Lane | DE56 0UJ |
| Cedar Croft | DE56 0PW |
| Chapel Street | DE56 0NR DE56 0NT DE56 0PB DE56 0TQ |
| Chestnut Avenue | DE56 0UD |
| Church Street | DE56 0LU DE56 0TD |
| Cottage Court | DE56 0SR |
| Dale Court | DE56 0JL |
| Dale Park Avenue | DE56 0PR |
| Dale View Gardens | DE56 0PT |
| Dove Close | DE56 0JW |
| East Crescent | DE56 0TS |
| Edward Crescent | DE56 0NU |
| Elm Tree Avenue | DE56 0NL DE56 0NN DE56 0NW |
| Fairview Close | DE56 0PN |
| Fairview Grange | DE56 0QB |
| Farm Close | DE56 0JX |
| Field Court | DE56 0JZ |
| Glen Avenue | DE56 0UE |
| Hawthorne Close | DE56 0LJ |
| High Street | DE56 0NS |
| Highfield Road | DE56 0LT DE56 0NP |
| Hillcrest | DE56 0JF |
| Hillcrest Drive | DE56 0PA |
| Hilltop Lane | DE56 0LG |
| Holbrook View | DE56 0JS |
| Horsley Crescent | DE56 0UB |
| Horsley Road | DE56 0NE |
| Hunter Drive | DE56 0ND |
| Ireton Close | DE56 0SQ |
| Ireton Houses | DE56 0SE |
| Kerrys Yard | DE56 0LX |
| Kilburn Lane | DE56 0SF |
| Killis Lane | DE56 0LS |
| Kingsway Crescent | DE56 0NX |
| Lapwing Close | DE56 0AB |
| Larch Road | DE56 0PX |
| Linden Close | DE56 0PJ |
| Lower Hall Close | DE56 0TN |
| Makeney Road | DE56 0TF DE56 0TZ |
| Mayfield Avenue | DE56 0NZ |
| Meadow Court | DE56 0JU |
| Mellors Lane | DE56 0SY |
| Mill Close | DE56 0JY |
| Moor Rise | DE56 0TR |
| Moorfield Road | DE56 0UA |
| Moorpool Crescent | DE56 0TY |
| Moorside Lane | DE56 0TW DE56 0TU |
| Nether Lane | DE56 0SS |
| Northfield | DE56 0LW |
| Openwood Road | DE56 0SG |
| Over Lane | DE56 0HW |
| Park Close | DE56 0PS |
| Pickburn Gardens | DE56 0LZ |
| Pond Road | DE56 0TX |
| Portway | DE56 0TE |
| Rawson Green | DE56 0LN |
| Rowan Drive | DE56 0PG |
| Ruffstone Close | DE56 0UF |
| Ryknield Road | DE56 0PE DE56 0PF |
| Shaw Lane | DE56 0TG DE56 0TH |
| Shaws Yard | DE56 0LY |
| Sitwell Drive | DE56 0JP |
| St Johns Drive | DE56 0JN |
| St Michaels Close | DE56 0SB |
| Station Close | DE56 0LB |
| Stoney Lane | DE56 0ST |
| Sycamore Court | DE56 0BA |
| The Chase | DE56 0PL |
| The Flat | DE56 0LA |
| The Nook | DE56 0TT |
| The Paddock | DE56 0UN |
| The Walk | DE56 0PP |
| Top Farm Court | DE56 0PU |
| Town Street | DE56 0TA |
| Upper Hall Close | DE56 0TP |
| Vicarwood Avenue | DE56 0UG |
| Vincent Close | DE56 0JT |
| Well Yard | DE56 0TB |
| Windmill Avenue | DE56 0NY DE56 0PQ |
| Woodhouse Road | DE56 0NA |
Transport near Kilburn, Denby And Holbrook
- FAQ
- Price Paid By Year
- Property Type Price
Frequently asked questions about Kilburn, Denby And Holbrook
What is the average price for a property for sale in Kilburn, Denby And Holbrook?
The average price for a property for sale in Kilburn, Denby And Holbrook is £250,780. This amount is 18% lower than the average price in Belper. There are 950 property listings for sale in Kilburn, Denby And Holbrook.
What streets have the most expensive properties for sale in Kilburn, Denby And Holbrook?
The streets with the most expensive properties for sale in Kilburn, Denby And Holbrook are Lower Hall Close at an average of £585,000, Mellors Lane at an average of £540,000 and Glen Avenue at an average of £510,000.
What streets have the most affordable properties for sale in Kilburn, Denby And Holbrook?
The streets with the most affordable properties for sale in Kilburn, Denby And Holbrook are Top Farm Court at an average of £115,666, Northfield at an average of £147,507 and Field Court at an average of £168,000.
Which train stations are available in or near Kilburn, Denby And Holbrook?
Some of the train stations available in or near Kilburn, Denby And Holbrook are Belper, Duffield and Ambergate.
Property Price Paid in Kilburn, Denby And Holbrook by Year
The average sold property price by year was:
| Year | Average Sold Price | Price Change |
Sold Properties
|
|---|---|---|---|
| 2025 | £249,273 | -5% |
59 Properties |
| 2024 | £262,692 | 10% |
84 Properties |
| 2023 | £237,372 | -8% |
68 Properties |
| 2022 | £256,553 | 4% |
95 Properties |
| 2021 | £246,493 | 9% |
121 Properties |
| 2020 | £224,374 | 11% |
84 Properties |
| 2019 | £199,897 | 2% |
86 Properties |
| 2018 | £196,643 | 10% |
111 Properties |
| 2017 | £176,067 | 3% |
111 Properties |
| 2016 | £169,920 | 6% |
123 Properties |
| 2015 | £159,117 | 1% |
104 Properties |
| 2014 | £157,687 | -4% |
104 Properties |
| 2013 | £163,976 | 7% |
81 Properties |
| 2012 | £152,540 | -14% |
72 Properties |
| 2011 | £173,635 | 12% |
73 Properties |
| 2010 | £153,152 | 4% |
75 Properties |
| 2009 | £146,841 | -2% |
80 Properties |
| 2008 | £149,405 | -10% |
85 Properties |
| 2007 | £164,188 | 5% |
162 Properties |
| 2006 | £156,162 | 7% |
141 Properties |
| 2005 | £144,521 | 3% |
127 Properties |
| 2004 | £139,472 | 15% |
159 Properties |
| 2003 | £119,244 | 22% |
115 Properties |
| 2002 | £93,508 | 26% |
152 Properties |
| 2001 | £69,419 | 4% |
141 Properties |
| 2000 | £66,750 | 13% |
125 Properties |
| 1999 | £58,392 | 1% |
126 Properties |
| 1998 | £57,610 | 11% |
112 Properties |
| 1997 | £50,991 | -2% |
113 Properties |
| 1996 | £52,045 | -1% |
84 Properties |
| 1995 | £52,559 | - |
103 Properties |
Property Price per Property Type in Kilburn, Denby And Holbrook
Here you can find historic sold price data in order to help with your property search.
The average Property Paid Price for specific property types in the last three years are:
| Property Type | Average Sold Price | Sold Properties |
|---|---|---|
| Semi Detached House | £227,528.00 | 87 Semi Detached Houses |
| Detached House | £371,724.00 | 51 Detached Houses |
| Terraced House | £198,282.00 | 70 Terraced Houses |
| Flat | £94,000.00 | 3 Flats |

