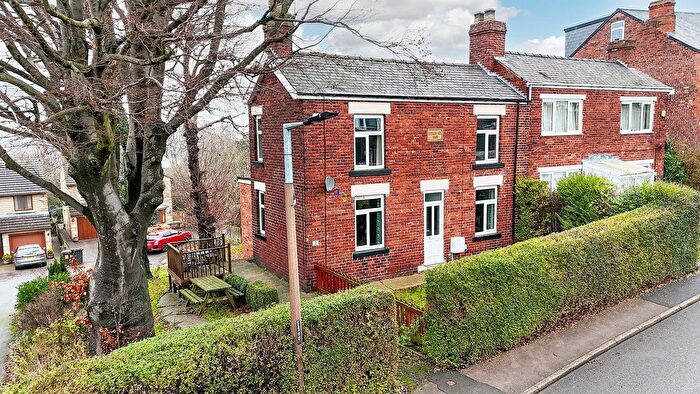
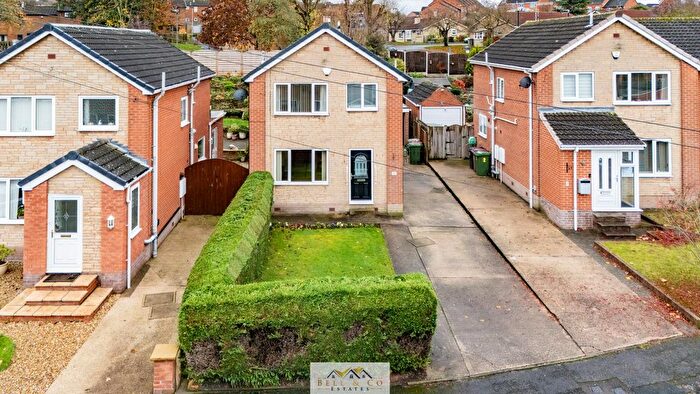
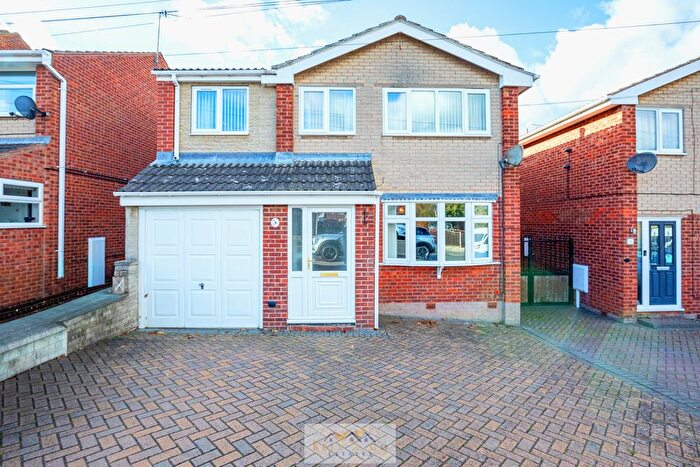
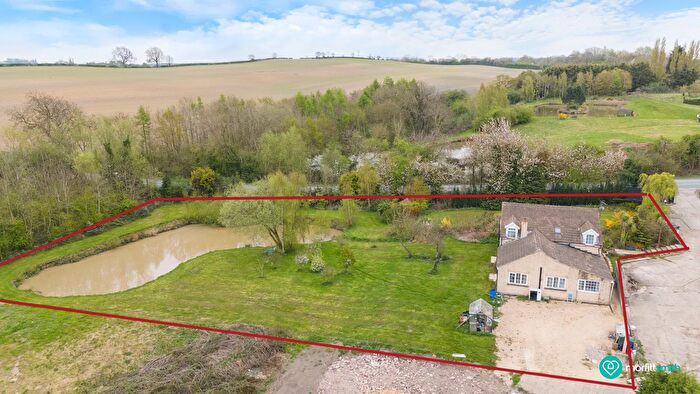
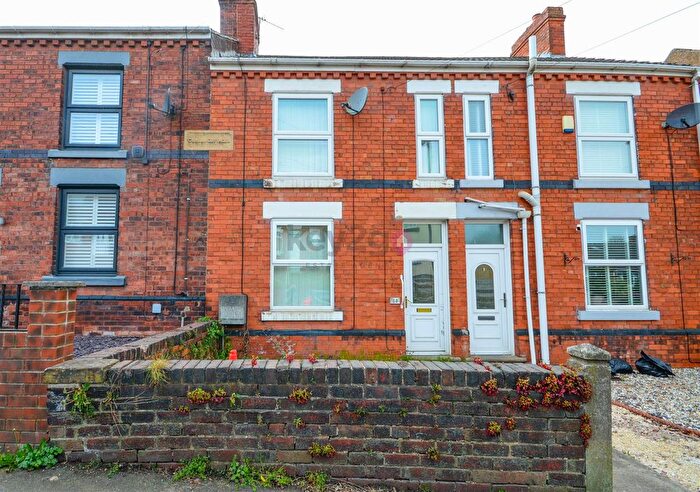
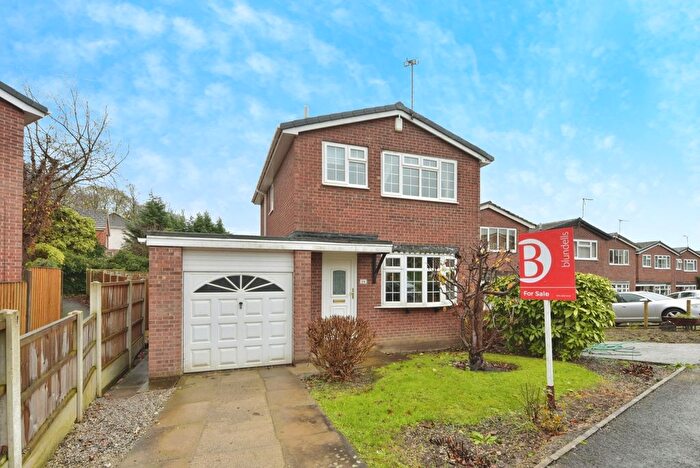
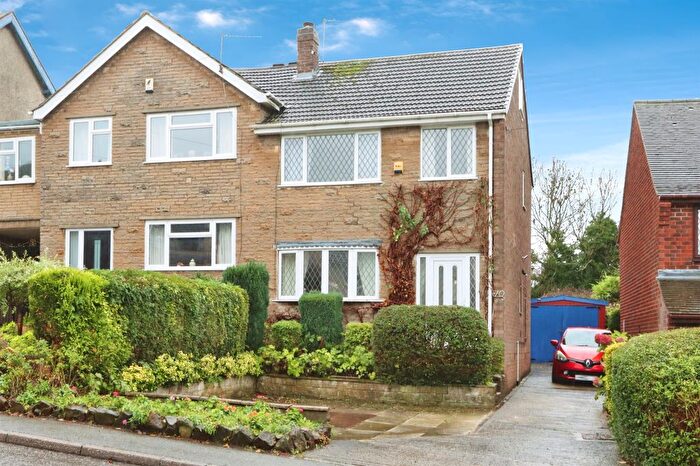
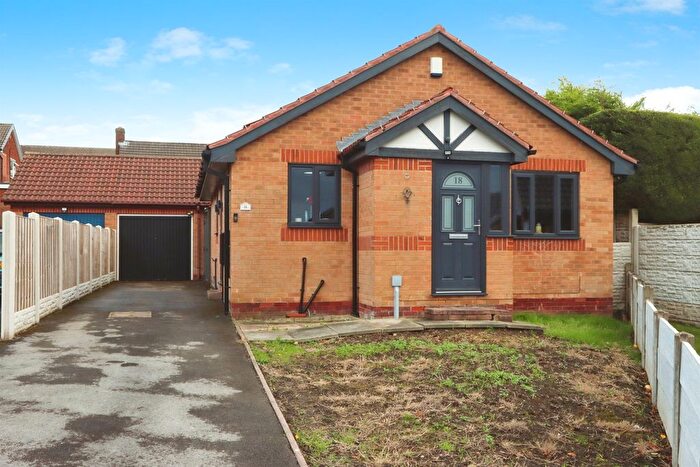
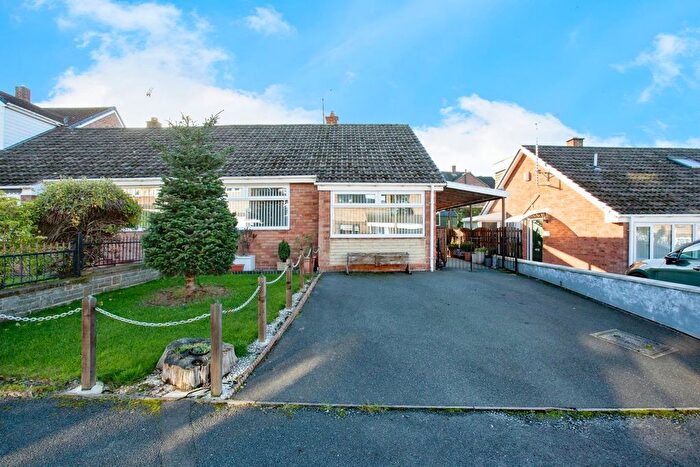
Houses for sale & to rent in Killamarsh East, Sheffield
House Prices in Killamarsh East
Properties in Killamarsh East have an average house price of £216,074.00 and had 114 Property Transactions within the last 3 years¹.
Killamarsh East is an area in Sheffield, Derbyshire with 1,548 households², where the most expensive property was sold for £635,000.00.
Properties for sale in Killamarsh East
Previously listed properties in Killamarsh East
Roads and Postcodes in Killamarsh East
Navigate through our locations to find the location of your next house in Killamarsh East, Sheffield for sale or to rent.
| Streets | Postcodes |
|---|---|
| Aldred Close | S21 2JH |
| Ashley Lane | S21 1AB |
| Bailey Drive | S21 2JF |
| Barbers Lane | S21 1AD |
| Bedgrave Close | S21 2HB |
| Belklane Drive | S21 2EZ |
| Birchlands Drive | S21 1GL |
| Bridge Street | S21 1AH S21 1AL S21 1AJ S21 1DT |
| Bunkers Hill | S21 1AN |
| Church Lane | S21 1AS |
| Church Mews | S21 1JY |
| Church View | S21 2FA |
| Cinder Lane | S21 2AT |
| Curzon Close | S21 1JJ |
| Dale Road | S21 1AU |
| Dumbleton Road | S21 1AX |
| Ellisons Road | S21 2JG |
| Fanny Avenue | S21 1AY |
| Farriers Way | S21 1DE |
| Gannow Close | S21 2BB |
| High Street | S21 1BB S21 1BJ S21 1BL |
| Hillside View | S21 1JZ |
| Holme Meadows | S21 1JG |
| Hut Lane | S21 1BQ |
| Ivy Side Close | S21 1JT |
| Ivy Side Gardens | S21 1JW |
| Jubilee Crescent | S21 1BR |
| Kirkcroft Avenue | S21 1GX |
| Kirkcroft Drive | S21 1GY |
| Kirkcroft Lane | S21 1BS |
| Long Lane | S21 1BT |
| Mallinder Close | S21 1TD |
| Manor Road | S21 1BU |
| Mansfield Road | S21 2BW S21 2BX S21 2BY S21 2BU |
| Meadowgate Park | S21 1EE |
| Munro Close | S21 1DG |
| Murray Road | S21 1JD |
| Nether Green Avenue | S21 1FF |
| Nethergreen Court | S21 1EA |
| Nethergreen Gardens | S21 1FX |
| Nethermoor Avenue | S21 1FH |
| Nethermoor Close | S21 1HY |
| Nethermoor Drive | S21 1HR |
| Nethermoor Lane | S21 1BZ |
| North Crescent | S21 2DD |
| Norwood Crescent | S21 2DE |
| Norwood Place | S21 2DF |
| Parkside Shopping Centre | S21 1FY |
| Peacock Close | S21 1BF |
| Peatfield Road | S21 2DJ |
| Pingle Road | S21 1JE |
| Primrose Close | S21 1JQ |
| Primrose Lane | S21 2DL |
| Rotherham Close | S21 2JU S21 2JW |
| Rotherham Road | S21 2DR S21 2DS |
| Rotherwood Road | S21 2DT |
| Sheepcote Hill | S21 1JF |
| Sheffield Road | S21 1DX S21 1DY S21 1EB S21 1ED S21 2DX S21 2EA |
| Sherwood Road | S21 2EG |
| South Crescent | S21 2EH |
| Stanley Street | S21 1EL |
| The Meadows | S21 1DD |
| Upperthorpe Road | S21 1EQ |
| Upperthorpe Villas | S21 1EW |
| Valley Drive | S21 1GZ |
| Valley Road | S21 1JB |
| Walkers Lane | S21 1ER |
| Woodall Road | S21 2EW |
| Woodall Way | S21 2AB |
| Woodside Avenue | S21 2EX |
Transport near Killamarsh East
- FAQ
- Price Paid By Year
- Property Type Price
Frequently asked questions about Killamarsh East
What is the average price for a property for sale in Killamarsh East?
The average price for a property for sale in Killamarsh East is £216,074. This amount is 2% lower than the average price in Sheffield. There are 339 property listings for sale in Killamarsh East.
What streets have the most expensive properties for sale in Killamarsh East?
The streets with the most expensive properties for sale in Killamarsh East are Holme Meadows at an average of £410,000, Ivy Side Gardens at an average of £365,000 and Upperthorpe Road at an average of £356,350.
What streets have the most affordable properties for sale in Killamarsh East?
The streets with the most affordable properties for sale in Killamarsh East are Norwood Place at an average of £129,333, Bridge Street at an average of £130,000 and Rotherham Road at an average of £142,750.
Which train stations are available in or near Killamarsh East?
Some of the train stations available in or near Killamarsh East are Kiveton Bridge, Kiveton Park and Woodhouse.
Property Price Paid in Killamarsh East by Year
The average sold property price by year was:
| Year | Average Sold Price | Price Change |
Sold Properties
|
|---|---|---|---|
| 2025 | £223,086 | 3% |
34 Properties |
| 2024 | £216,151 | 3% |
43 Properties |
| 2023 | £209,540 | 5% |
37 Properties |
| 2022 | £199,525 | 13% |
54 Properties |
| 2021 | £173,284 | -3% |
69 Properties |
| 2020 | £177,729 | 13% |
56 Properties |
| 2019 | £154,512 | 0,2% |
40 Properties |
| 2018 | £154,256 | 5% |
51 Properties |
| 2017 | £147,153 | -7% |
60 Properties |
| 2016 | £156,943 | - |
46 Properties |
| 2015 | £156,901 | 9% |
58 Properties |
| 2014 | £142,092 | 4% |
46 Properties |
| 2013 | £137,022 | 9% |
34 Properties |
| 2012 | £124,813 | -1% |
28 Properties |
| 2011 | £125,690 | 5% |
44 Properties |
| 2010 | £119,886 | -14% |
37 Properties |
| 2009 | £136,166 | 8% |
36 Properties |
| 2008 | £124,962 | -15% |
34 Properties |
| 2007 | £143,878 | 5% |
99 Properties |
| 2006 | £137,003 | 9% |
76 Properties |
| 2005 | £124,312 | 13% |
51 Properties |
| 2004 | £108,468 | 16% |
65 Properties |
| 2003 | £90,708 | 26% |
68 Properties |
| 2002 | £67,240 | 18% |
66 Properties |
| 2001 | £55,155 | 9% |
66 Properties |
| 2000 | £50,007 | -6% |
70 Properties |
| 1999 | £52,795 | -2% |
65 Properties |
| 1998 | £53,711 | 7% |
61 Properties |
| 1997 | £50,004 | 4% |
66 Properties |
| 1996 | £47,783 | 12% |
59 Properties |
| 1995 | £42,190 | - |
43 Properties |
Property Price per Property Type in Killamarsh East
Here you can find historic sold price data in order to help with your property search.
The average Property Paid Price for specific property types in the last three years are:
| Property Type | Average Sold Price | Sold Properties |
|---|---|---|
| Semi Detached House | £175,222.00 | 54 Semi Detached Houses |
| Detached House | £327,068.00 | 36 Detached Houses |
| Terraced House | £142,909.00 | 22 Terraced Houses |
| Flat | £126,000.00 | 2 Flats |

