
Houses for sale in Killamarsh West, Sheffield
House Prices in Killamarsh West
Properties in Killamarsh West have an average house price of £224k and had 178 Property Transactions within the last 3 years¹.
Killamarsh West is an area in Sheffield, Derbyshire with 2,369 households², where the most expensive property was sold for £690k.
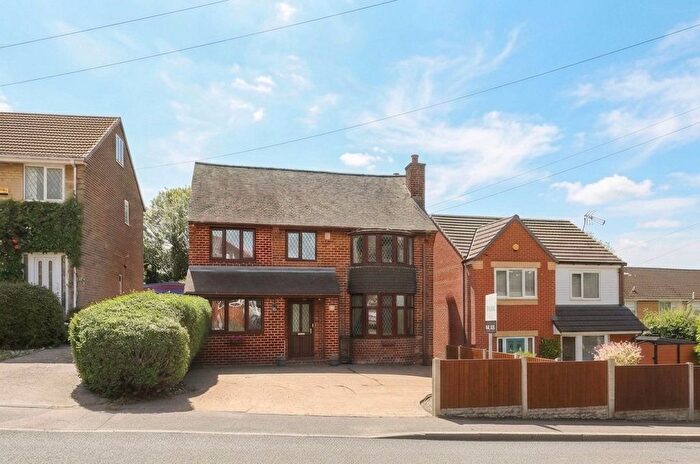
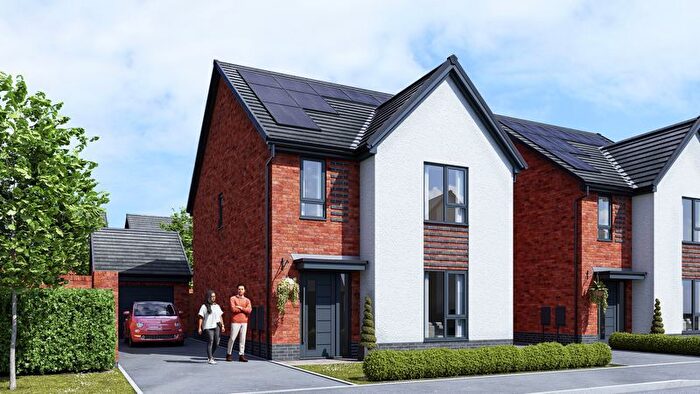
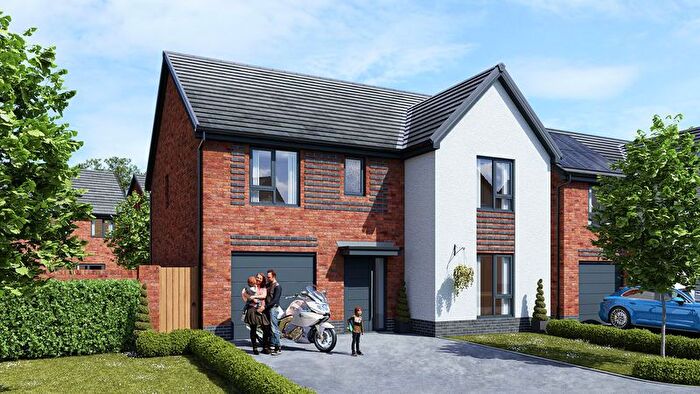
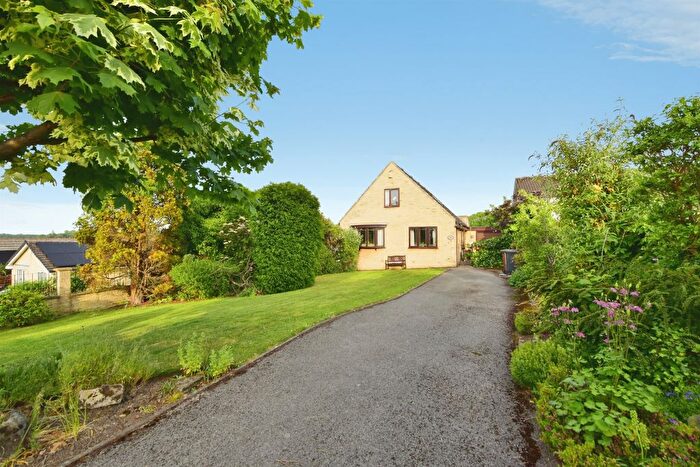
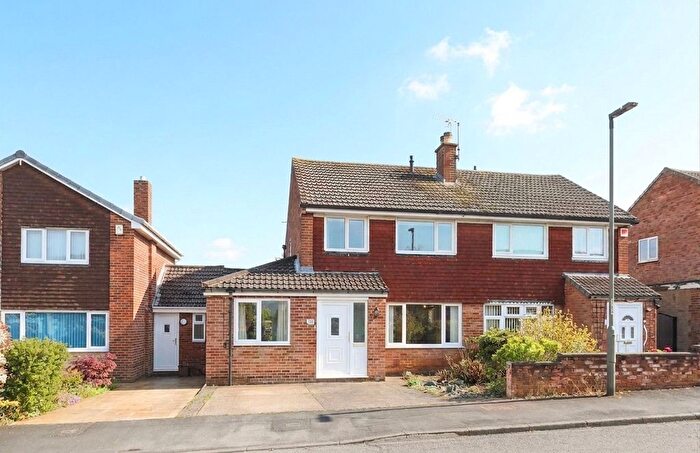
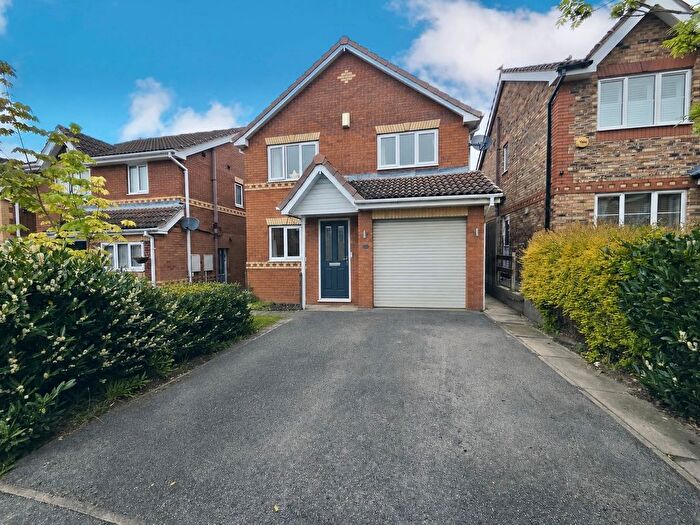
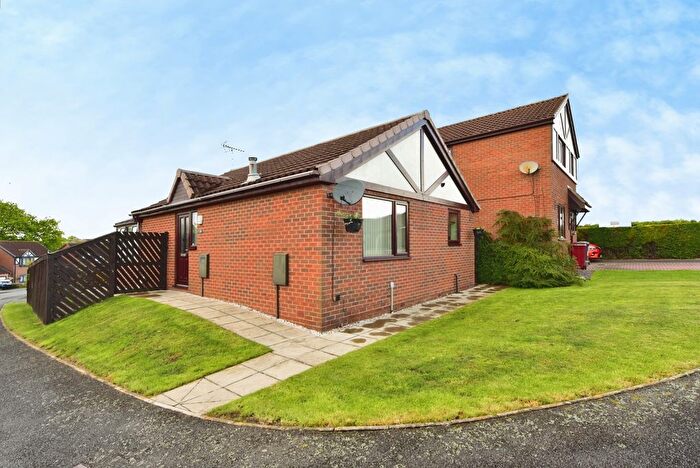
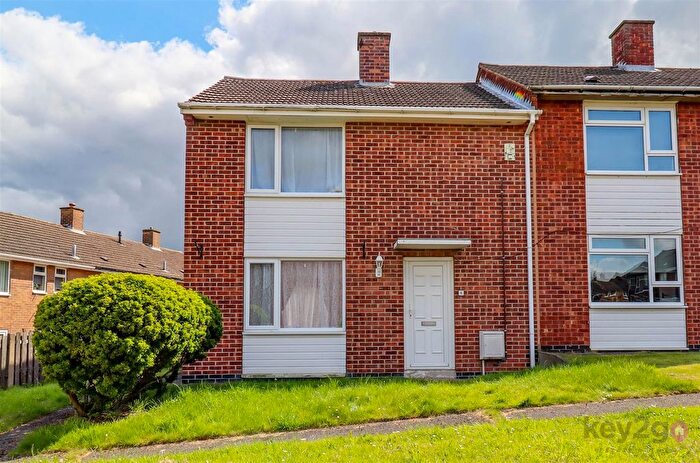
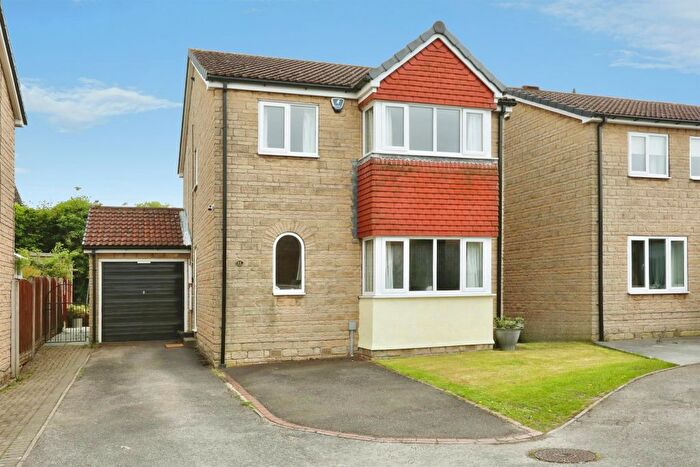
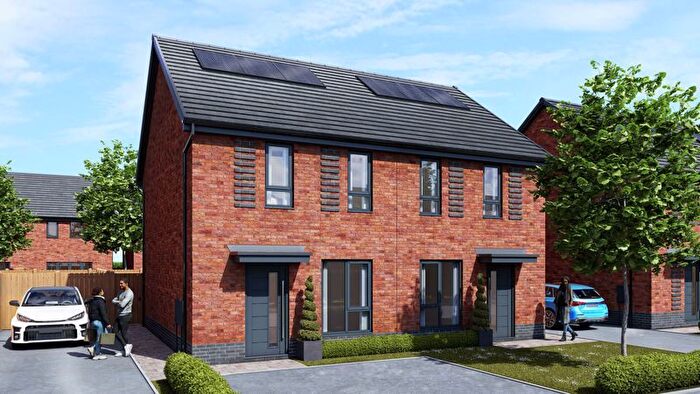
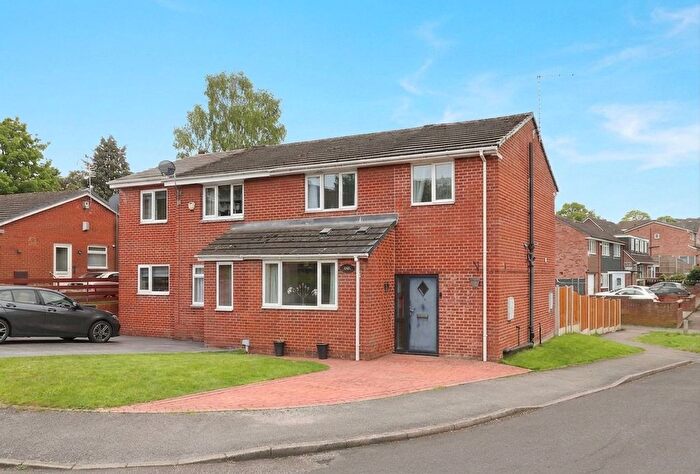
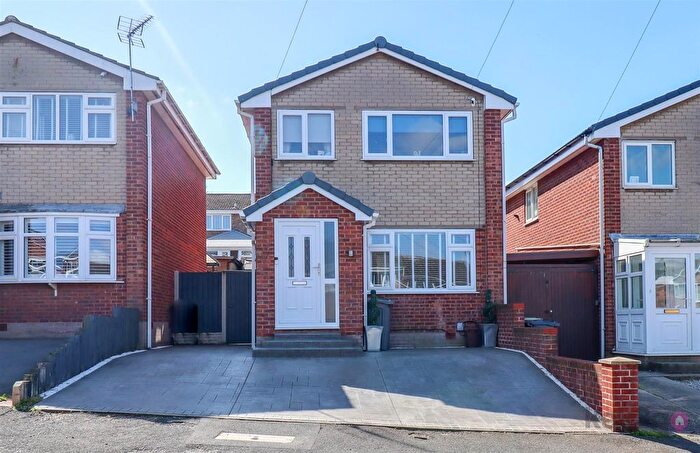
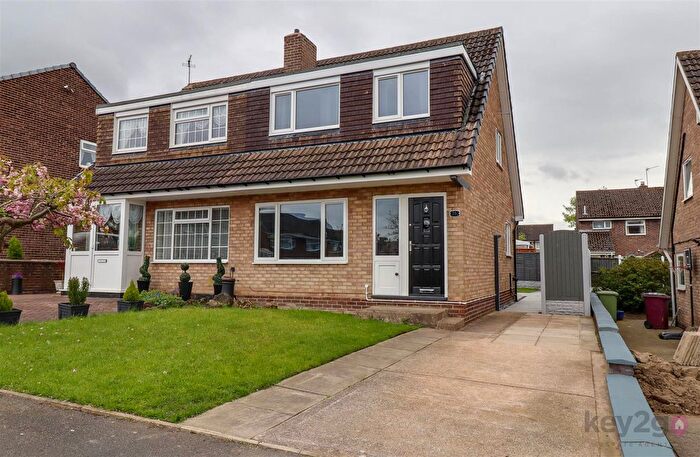
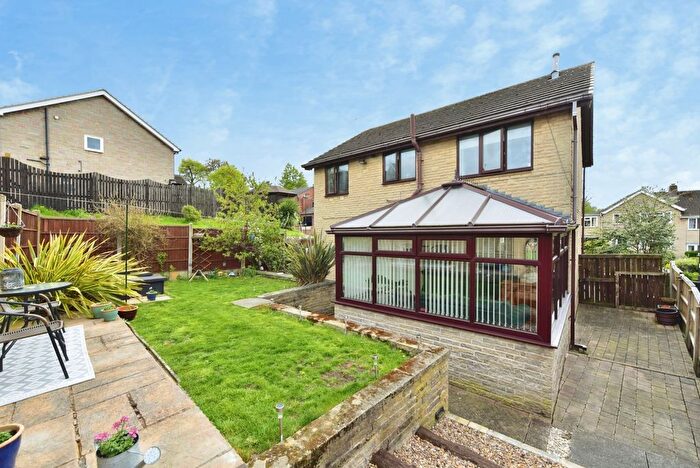
Properties for sale in Killamarsh West
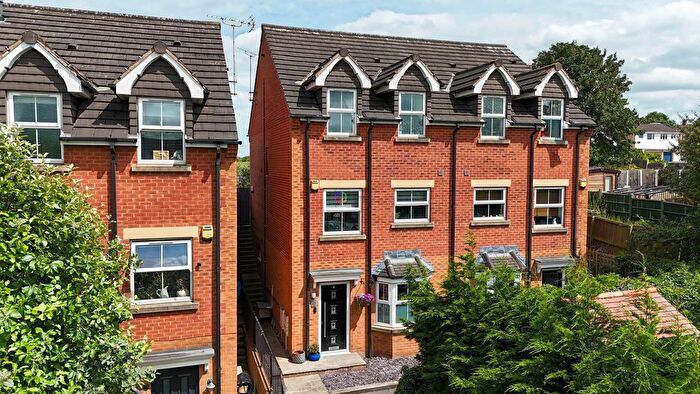
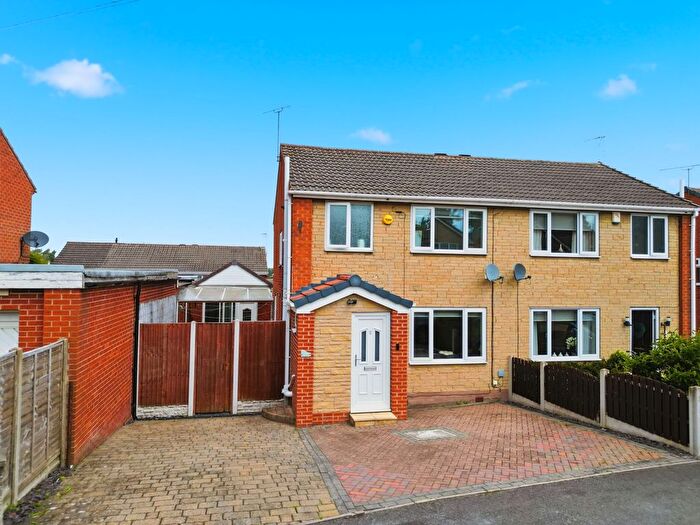
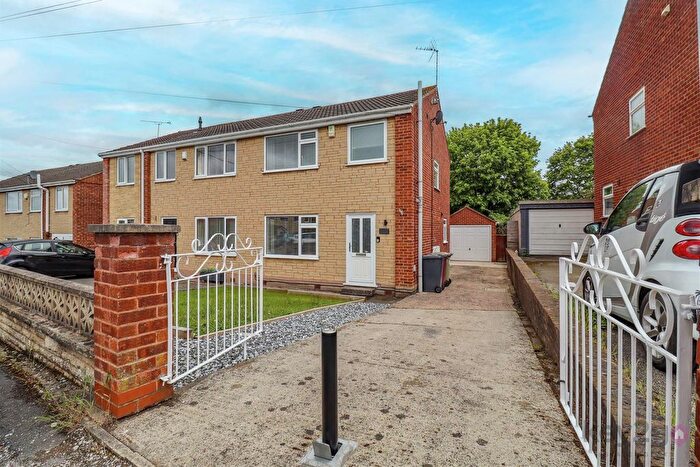
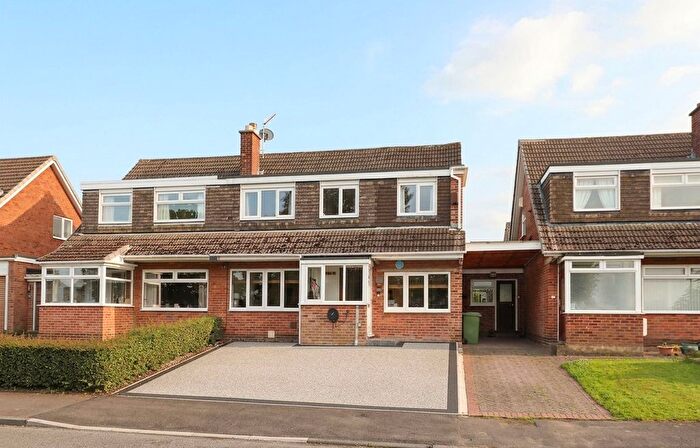
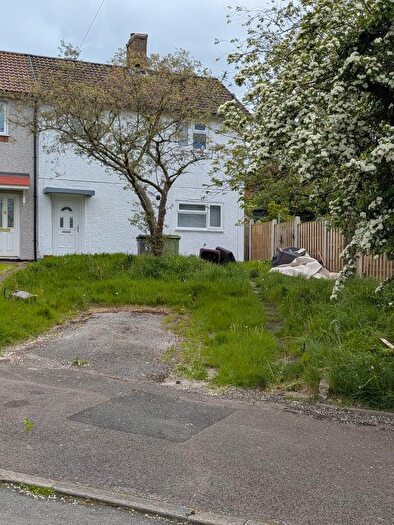
Previously listed properties in Killamarsh West
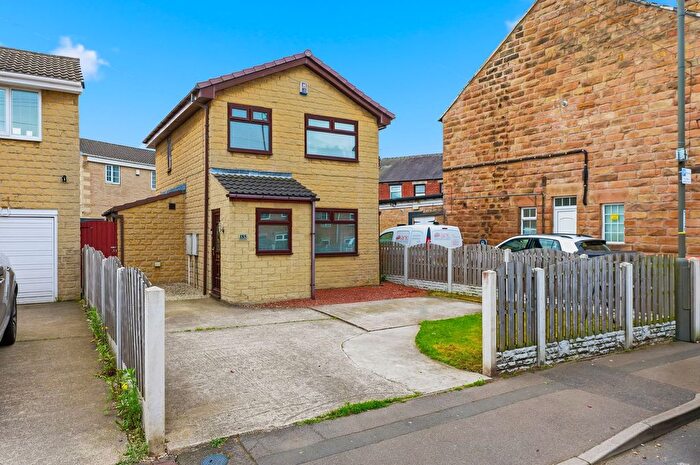
![]()
If you are looking to sell your house, let it out, or receive a property valuation, an expert can help you.
Click the button below to get started.
Roads and Postcodes in Killamarsh West
Navigate through our locations to find the location of your next house in Killamarsh West, Sheffield for sale or to rent.
| Streets | Postcodes |
|---|---|
| Acacia Crescent | S21 1HZ |
| Acer Close | S21 1HP |
| Almond Drive | S21 1HA |
| Ash Close | S21 1GU |
| Ashley Close | S21 1AA |
| Ashton Close | S21 1HS |
| Aspen Close | S21 1TA |
| Baker Drive | S21 1HD |
| Bay Court | S21 1HL |
| Beech Crescent | S21 1AE S21 1AF |
| Betony Close | S21 1TH |
| Birch Close | S21 1FW |
| Boiley Lane | S21 1AG |
| Briars Close | S21 1EP |
| Brindley Court | S21 1HE |
| Bryony Close | S21 1TF |
| Butler Way | S21 1HT |
| Campion Drive | S21 1TG |
| Canal Bridge | S21 1DJ |
| Cedar Close | S21 1GG |
| Chandos Crescent | S21 1AP |
| Cherry Tree Drive | S21 1AQ S21 1AR S21 1AT S21 1JU |
| Chestnut Avenue | S21 1HN |
| Colliery Drive | S21 1DF |
| Crofters Close | S21 1JH |
| Cutler Close | S21 1TE |
| Cypress Close | S21 1FP |
| Delves Road | S21 1AW |
| Dobbs Close | S21 1HB |
| Elder Court | S21 1HQ |
| Elm Close | S21 1FU |
| Elm Drive | S21 1FT |
| Field Lane | S21 1AZ |
| Fir Place | S21 1GT |
| Forge Lane | S21 1BW S21 1BA |
| Foxcroft Chase | S21 1JL |
| Foxcroft Drive | S21 1JN |
| Foxcroft Grove | S21 1JP |
| Gaunt Close | S21 1SW |
| Gorse Drive | S21 1FG |
| Green Lane | S21 1BD |
| Havercroft Place | S21 1BE |
| Havercroft Terrace | S21 1BG |
| Hawthorne Close | S21 1BH |
| Hazel Avenue | S21 1GD |
| Heath Avenue | S21 1GW |
| High Street | S21 1BN S21 1BP S21 1BX |
| Holly Close | S21 1GN |
| Juniper Rise | S21 1GS |
| Kemp Close | S21 1SX |
| Kestrel Close | S21 1TN |
| Laburnum Grove | S21 1DR S21 1GR |
| Larch Avenue | S21 1FJ |
| Laurel Drive | S21 1FZ |
| Lime Tree Avenue | S21 1FQ |
| Lipp Avenue | S21 1HU |
| Mallard Drive | S21 1ES |
| Maple Drive | S21 1GA |
| Marrison Drive | S21 1HF |
| Metcalfe Avenue | S21 1HW |
| Meynell Way | S21 1HG |
| Moss Drive | S21 1FE |
| Mulberry Way | S21 1JA |
| Musard Way | S21 1HJ |
| Nether Avenue | S21 1BY |
| Netherthorpe Close | S21 1JS |
| Netherthorpe Lane | S21 1DA |
| Netherthorpe Villas | S21 1DZ |
| Norburn Drive | S21 1DB |
| Oak Close | S21 1FB |
| Orchard Place | S21 1DH |
| Pear Tree Close | S21 1FR |
| Pine Close | S21 1GJ |
| Poplar Close | S21 1GB |
| Powell Drive | S21 1JX |
| Quarry Road | S21 1DN |
| Rectory Gardens | S21 1TB |
| Rectory Road | S21 1DP S21 1DQ |
| Redwood Avenue | S21 1GH |
| Robinson Way | S21 1HH |
| Rose Way | S21 1TL S21 1TQ |
| Ross Court | S21 1DL |
| Rowan Tree Close | S21 1JR |
| Rowan Tree Road | S21 1FA S21 1FS S21 1GP S21 1SP |
| Sackerville Terrace | S21 1EZ |
| Sheepcote Road | S21 1DS S21 1DU S21 1DW |
| Shepherds Close | S21 1LB |
| Simcrest Avenue | S21 1FD |
| Spinkhill Road | S21 1EH |
| Spooner Drive | S21 1SH |
| Spruce Rise | S21 1GQ |
| Station Road | S21 1EN |
| Sycamore Drive | S21 1FN |
| The Bungalows | S21 1EF |
| Upperthorpe Road | S21 1EG S21 1EJ |
| Walford Road | S21 1HX |
| Walnut Drive | S21 1GE |
| Westfield Road | S21 1EY |
| Westthorpe Fields Road | S21 1TW S21 1TZ |
| Westthorpe Green | S21 1EX |
| Westthorpe Road | S21 1ET S21 1EU |
| Willow Road | S21 1FL |
| Yew Tree Drive | S21 1GF |
Property price trends in Killamarsh West
According to the latest Land Registry data, the average home in Killamarsh West sold for £167,750 in 2026. That figure comes from 2,342 sales logged over the past 31 years.
Prices have fallen back over the last three years. Compared with 2023, when the typical sale came in around £224,536, that's a fall of roughly 25.3%.
Looking back five years, average prices are down about 21.3% since 2021, a drop of around £45,279 in cash terms.
Zoom out to the past decade for the fuller picture. Back in 2016, homes here averaged £155,431, so the typical sold price has climbed about 7.9% since then, roughly 0.8% a year. Stretch the view to fifteen years and that annual pace edges up closer to 1.6%.
Frequently asked questions about Killamarsh West
What is the average price for a property for sale in Killamarsh West?
The average price for a property for sale in Killamarsh West is £223,605. This amount is 0.5% higher than the average price in Sheffield. There are 404 property listings for sale in Killamarsh West.
What streets have the most expensive properties for sale in Killamarsh West?
The streets with the most expensive properties for sale in Killamarsh West are Ross Court at an average of £690,000, Gorse Drive at an average of £516,000 and Shepherds Close at an average of £458,333.
What streets have the most affordable properties for sale in Killamarsh West?
The streets with the most affordable properties for sale in Killamarsh West are Nether Avenue at an average of £60,000, Rectory Road at an average of £94,000 and Chandos Crescent at an average of £96,500.
Which train stations are available in or near Killamarsh West?
Some of the train stations available in or near Killamarsh West are Kiveton Bridge, Woodhouse and Kiveton Park.
Property Price Paid in Killamarsh West by Year
The average sold property price by year was:
| Year | Average Sold Price | Price Change |
Sold Properties
|
|---|---|---|---|
| 2026 | £167,750 | -32% |
4 Properties |
| 2025 | £221,904 | -2% |
53 Properties |
| 2024 | £227,046 | 1% |
80 Properties |
| 2023 | £224,536 | 7% |
41 Properties |
| 2022 | £207,892 | -2% |
70 Properties |
| 2021 | £213,029 | 9% |
91 Properties |
| 2020 | £194,818 | 19% |
69 Properties |
| 2019 | £157,640 | -7% |
72 Properties |
| 2018 | £168,133 | 6% |
59 Properties |
| 2017 | £157,407 | 1% |
69 Properties |
Property Price per Property Type in Killamarsh West
Here you can find historic sold price data in order to help with your property search.
The average Property Paid Price for specific property types in the last three years are:
| Property Type | Average Sold Price | Sold Properties |
|---|---|---|
| Semi Detached House | £192,004.00 | 81 Semi Detached Houses |
| Detached House | £302,249.00 | 54 Detached Houses |
| Terraced House | £184,368.00 | 43 Terraced Houses |
