
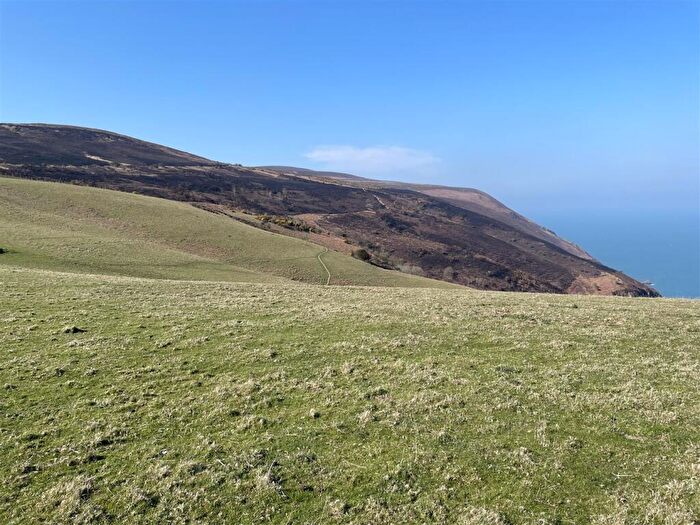
Houses for sale in Lynton & Lynmouth, Barnstaple
House Prices in Lynton & Lynmouth
Properties in Lynton & Lynmouth have an average house price of £561k and had 2 Property Transactions within the last 3 years¹.
Lynton & Lynmouth is an area in Barnstaple, Devon with 33 households², where the most expensive property was sold for £750k.
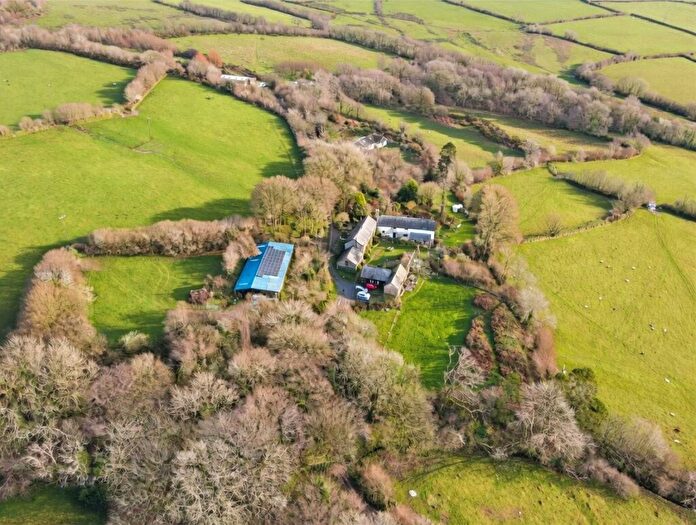
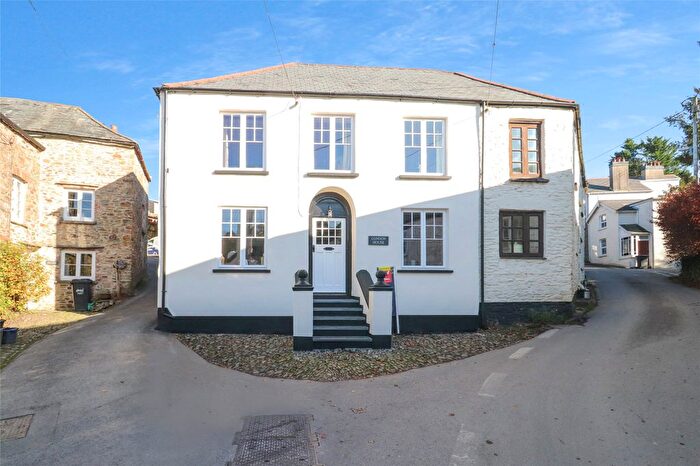
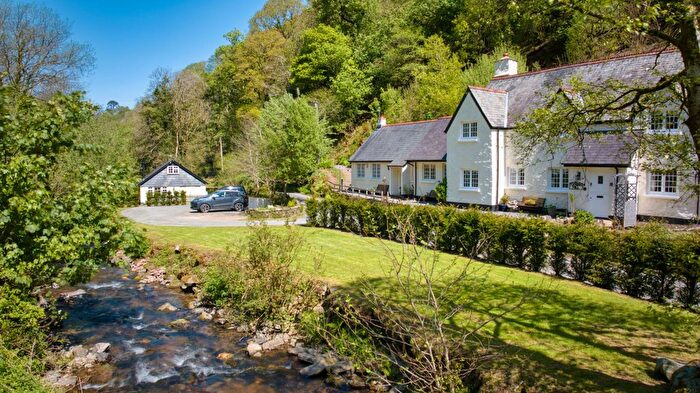
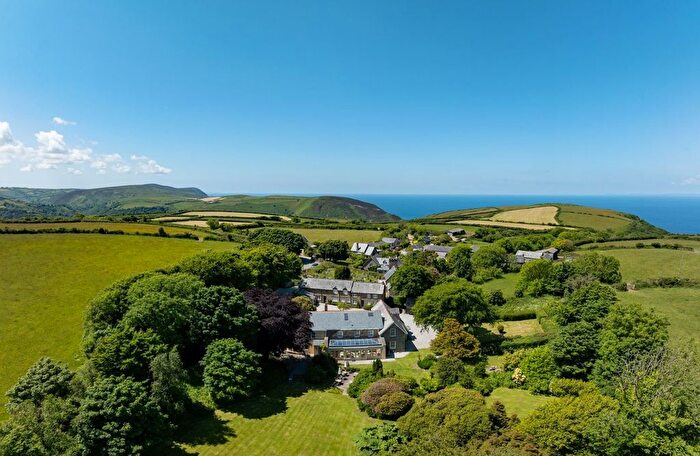
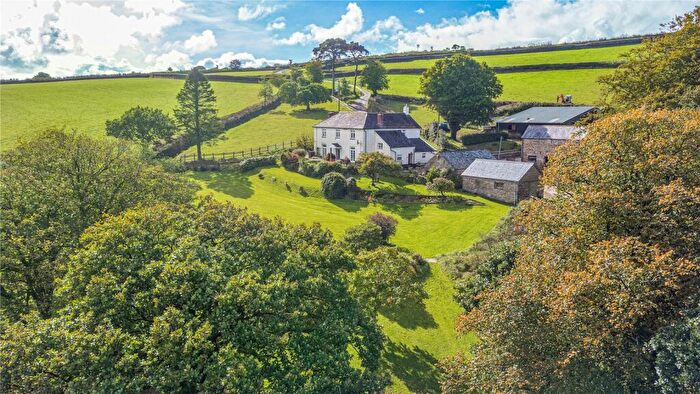
Properties for sale in Lynton & Lynmouth
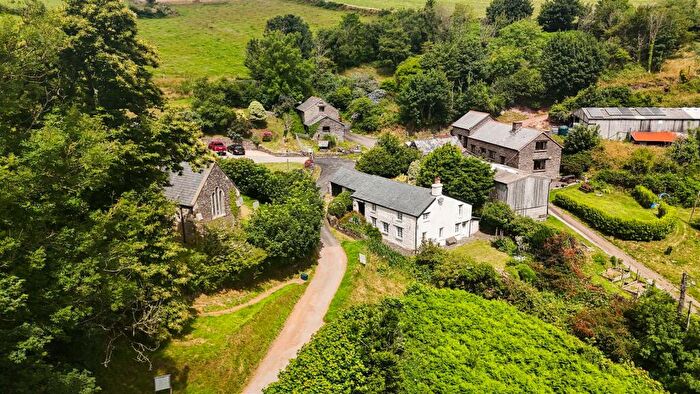
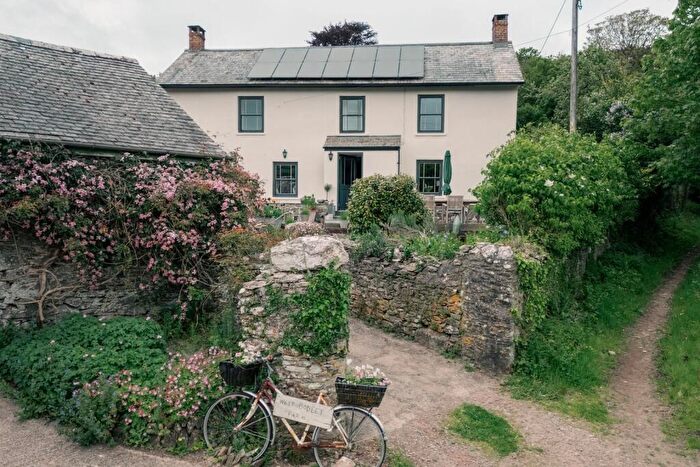
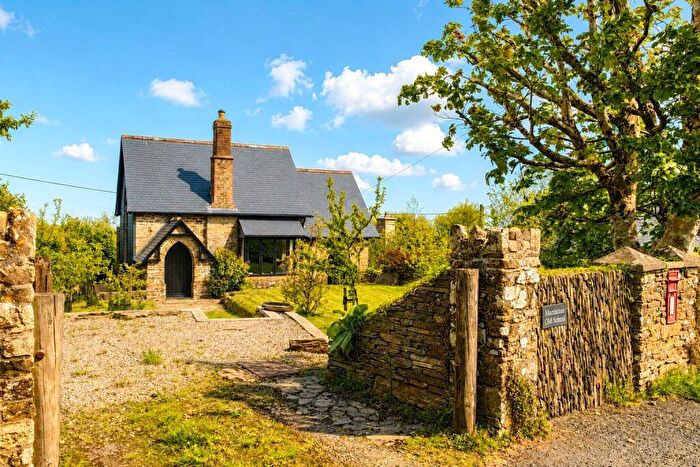
![]()
If you are looking to sell your house, let it out, or receive a property valuation, an expert can help you.
Click the button below to get started.

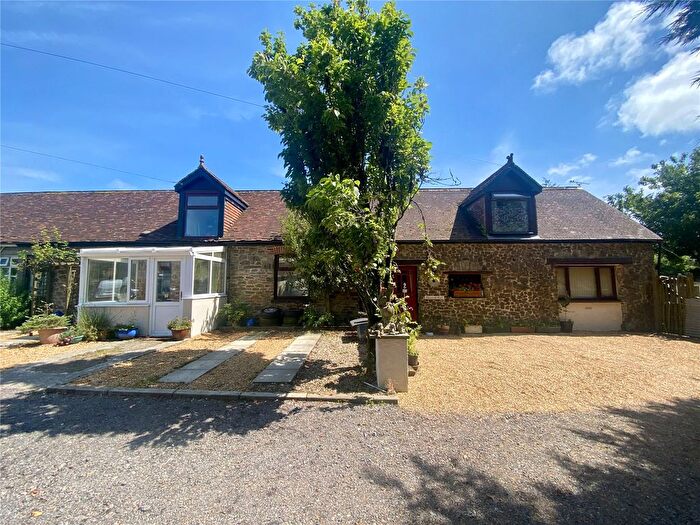
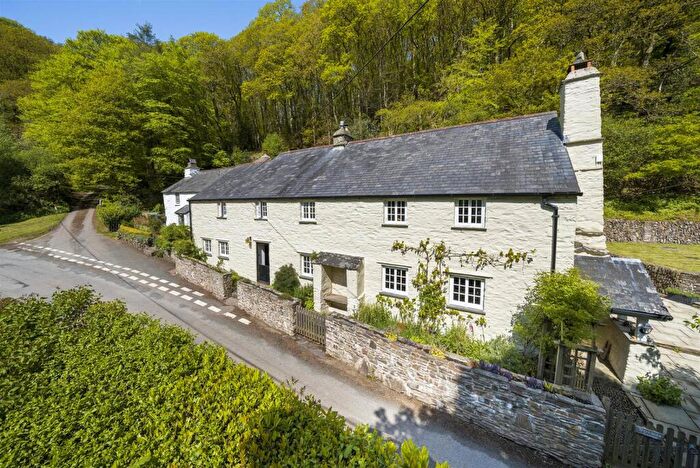
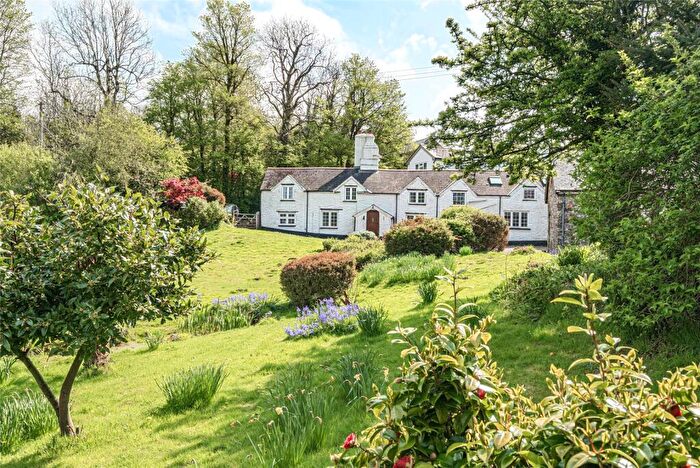
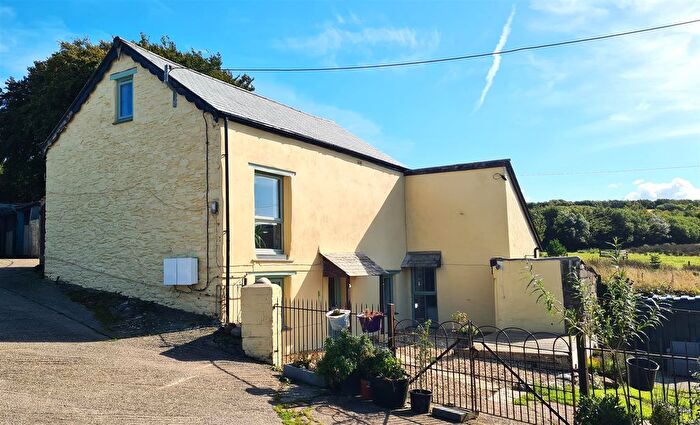
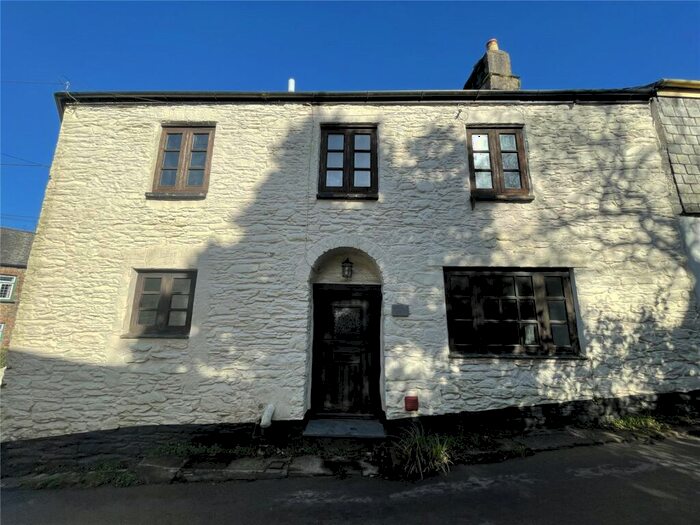
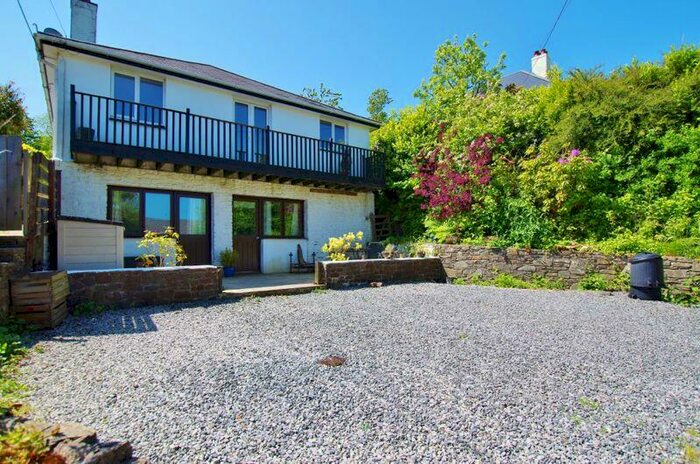
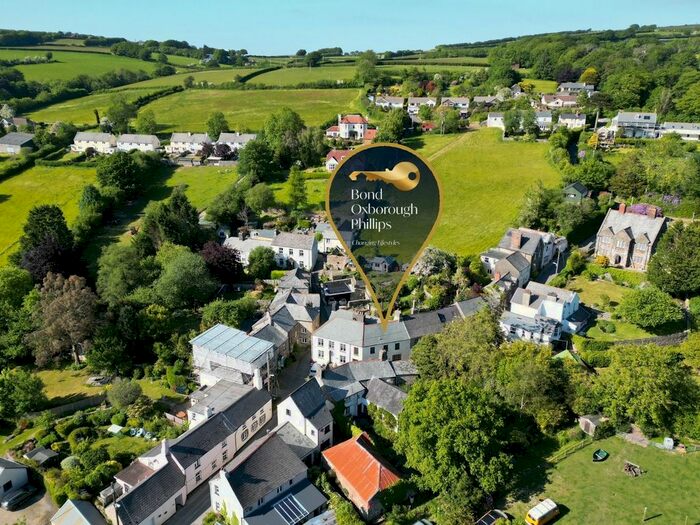
Previously listed properties in Lynton & Lynmouth
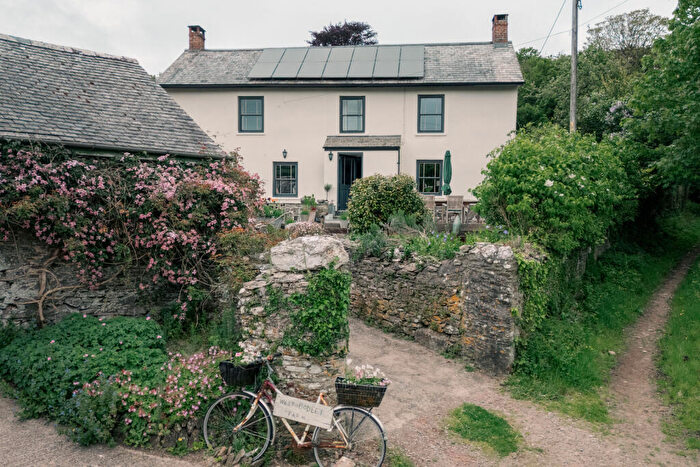
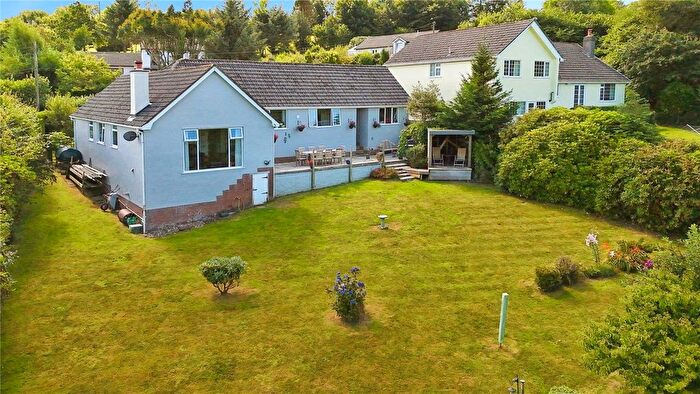
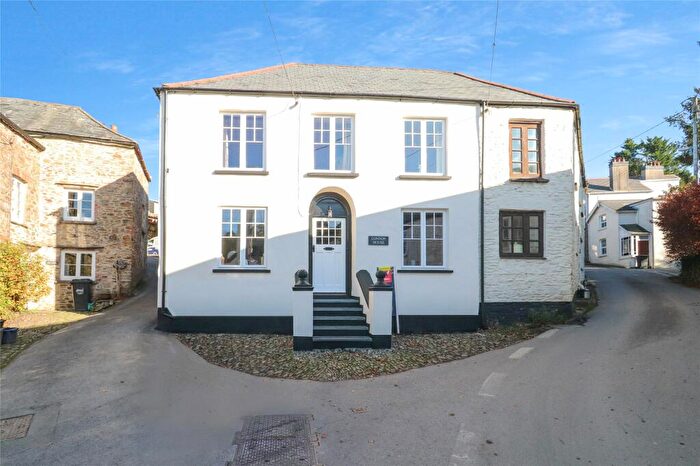
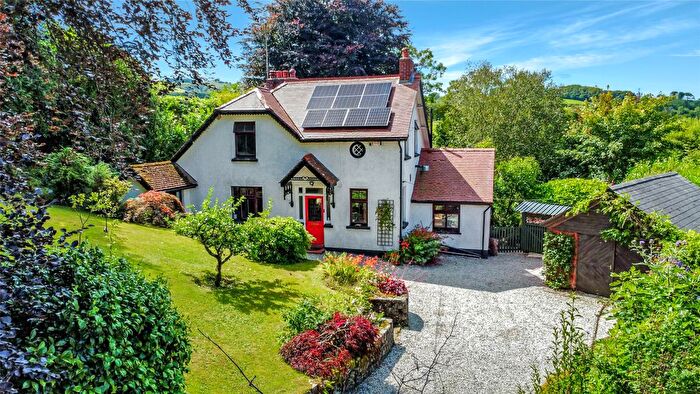
![]()
If you are looking to sell your house, let it out, or receive a property valuation, an expert can help you.
Click the button below to get started.
Roads and Postcodes in Lynton & Lynmouth
Navigate through our locations to find the location of your next house in Lynton & Lynmouth, Barnstaple for sale or to rent.
| Streets | Postcodes |
|---|---|
| Martinhoe | EX31 4PZ EX31 4QS |
| Trentishoe | EX31 4PH |
| EX31 4PY EX31 4WB EX31 4ZQ EX31 4NP EX31 4PG EX31 4PS EX31 4PT EX31 4QH EX31 4QL EX31 4QN EX31 4RG |
Property price trends in Lynton & Lynmouth
According to the latest Land Registry data, the average home in Lynton & Lynmouth sold for £561,000 in 2023. That figure comes from 10 sales logged over the past 24 years.
Prices have moved up over the last three years. Compared with 2020, when the typical sale came in around £548,333, that's a rise of roughly 2.3%.
Looking back five years, average prices are up about 15.2% since 2018, a gain of around £74,000 in cash terms.
Frequently asked questions about Lynton & Lynmouth
What is the average price for a property for sale in Lynton & Lynmouth?
The average price for a property for sale in Lynton & Lynmouth is £561,000. This amount is 86% higher than the average price in Barnstaple. There are 38 property listings for sale in Lynton & Lynmouth.
Which train stations are available in or near Lynton & Lynmouth?
Some of the train stations available in or near Lynton & Lynmouth are Barnstaple, Chapelton and Umberleigh.
Property Price Paid in Lynton & Lynmouth by Year
The average sold property price by year was:
| Year | Average Sold Price | Price Change |
Sold Properties
|
|---|---|---|---|
| 2023 | £561,000 | 43% |
2 Properties |
| 2021 | £320,000 | -71% |
1 Property |
| 2020 | £548,333 | 51% |
3 Properties |
| 2019 | £269,950 | -80% |
1 Property |
| 2018 | £487,000 | 15% |
1 Property |
| 2006 | £415,000 | 77% |
1 Property |
| 1999 | £95,000 | - |
1 Property |
Property Price per Property Type in Lynton & Lynmouth
Here you can find historic sold price data in order to help with your property search.
The average Property Paid Price for specific property types in the last three years are:
| Property Type | Average Sold Price | Sold Properties |
|---|---|---|
| Detached House | £561,000.00 | 2 Detached Houses |
