
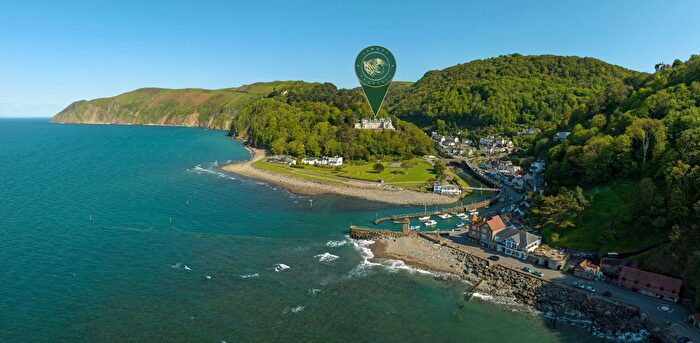
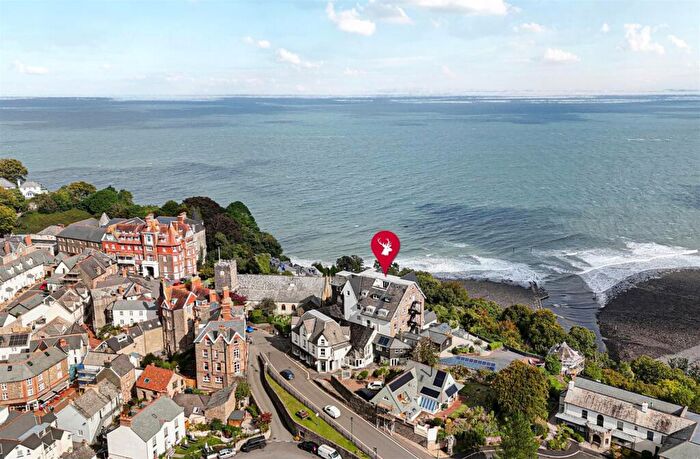
Houses for sale in Lynton & Lynmouth, Lynmouth
House Prices in Lynton & Lynmouth
Properties in Lynton & Lynmouth have an average house price of £552k and had 34 Property Transactions within the last 3 years¹.
Lynton & Lynmouth is an area in Lynmouth, Devon with 97 households², where the most expensive property was sold for £1.15M.
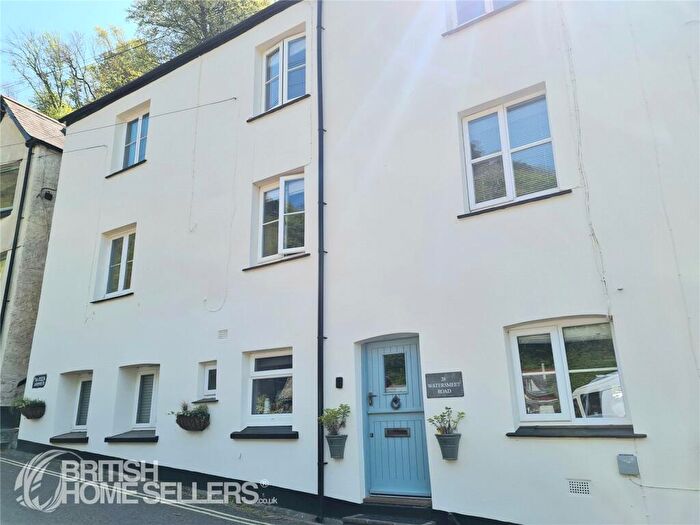
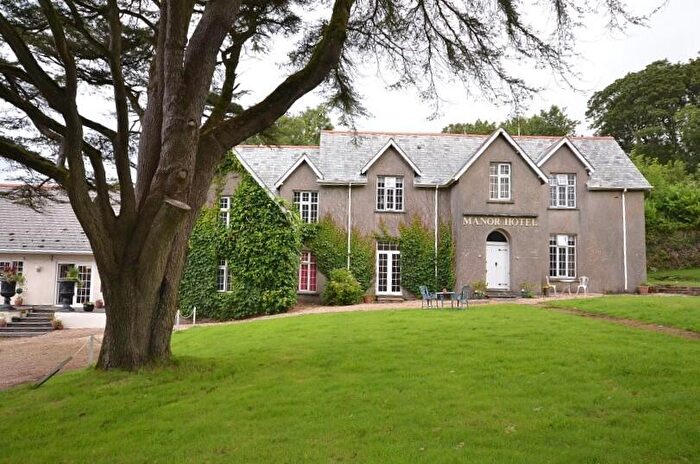
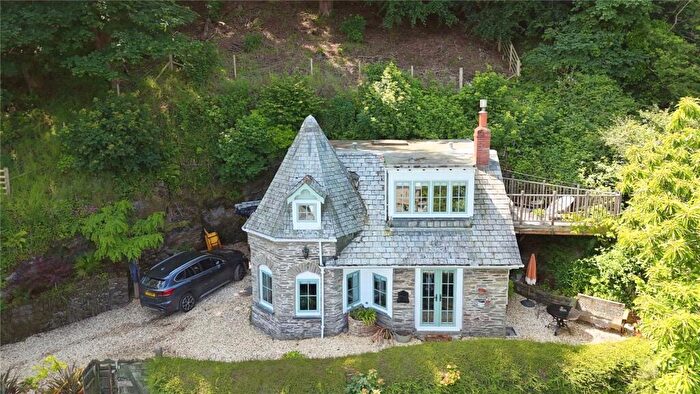
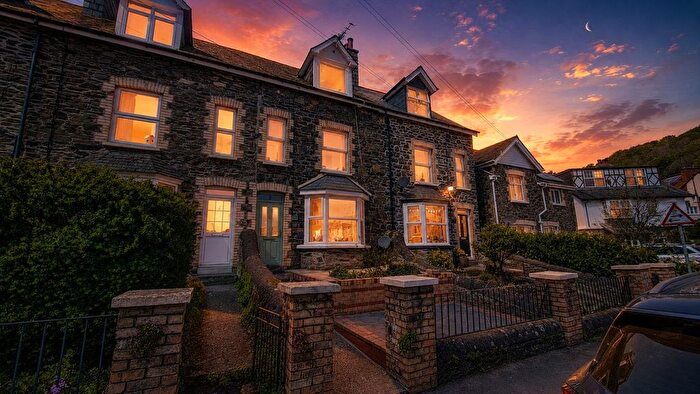
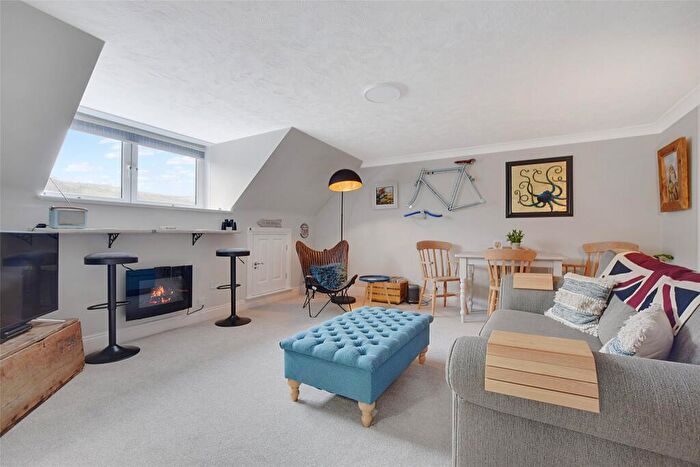
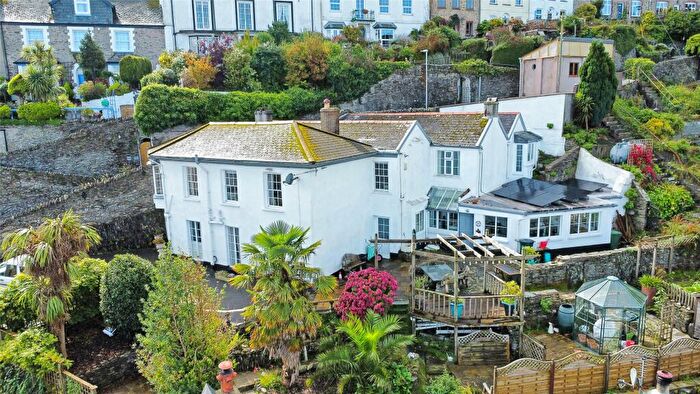
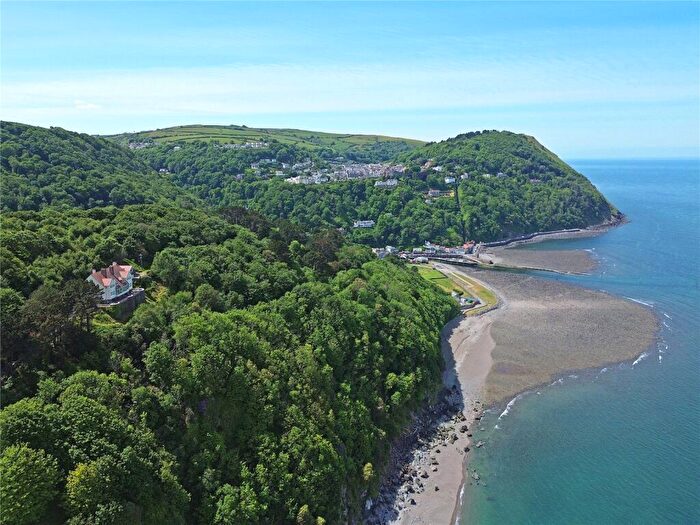
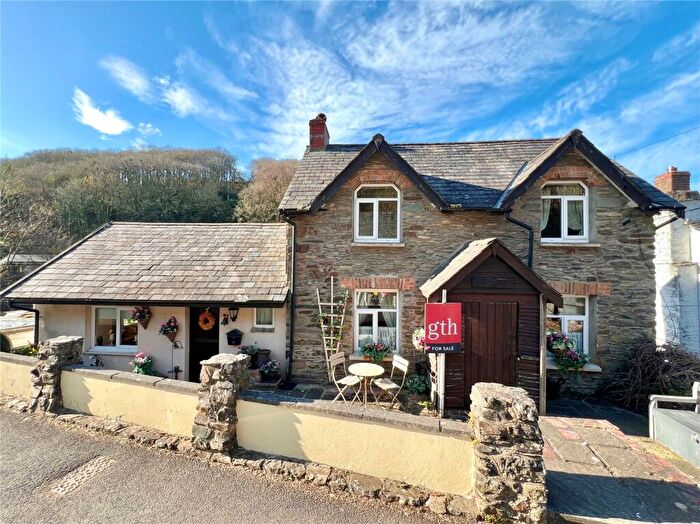
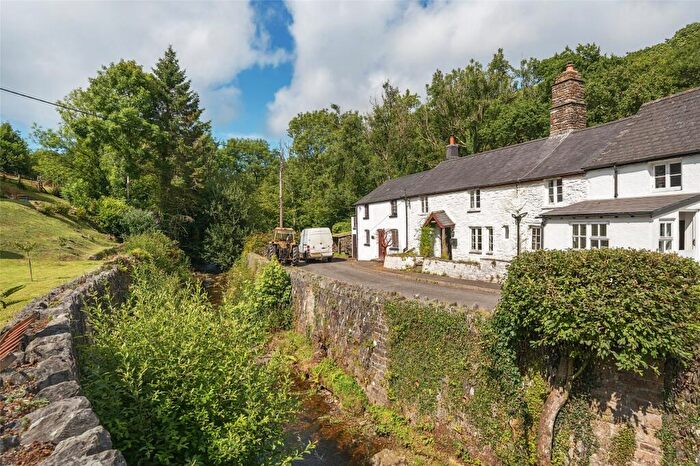
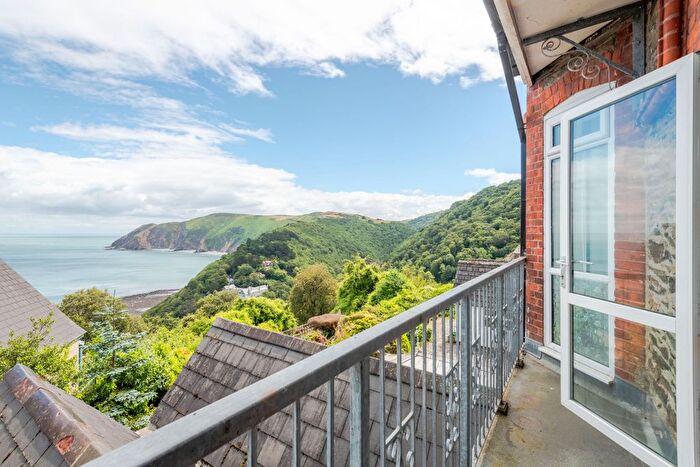
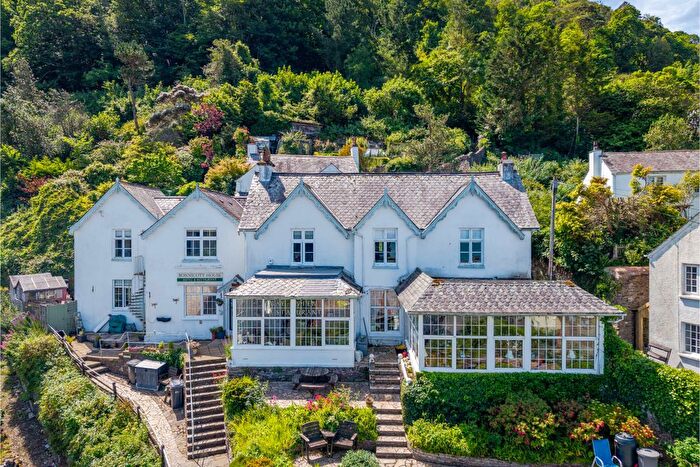
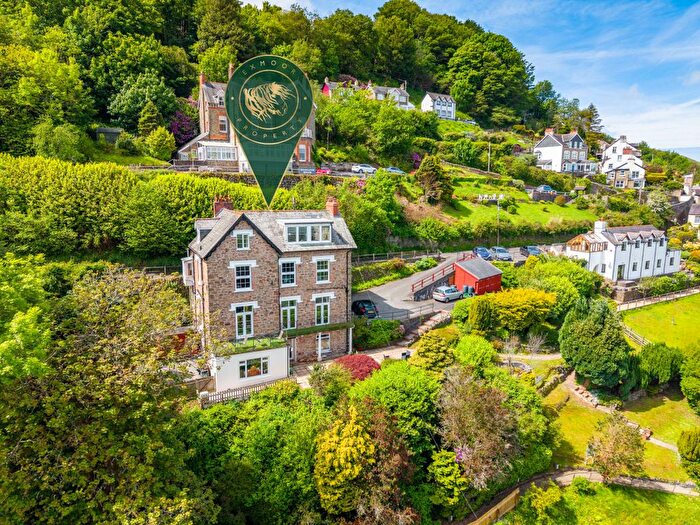
Properties for sale in Lynton & Lynmouth
![]()
If you are looking to sell your house, let it out, or receive a property valuation, an expert can help you.
Click the button below to get started.

Previously listed properties in Lynton & Lynmouth
Roads and Postcodes in Lynton & Lynmouth
Navigate through our locations to find the location of your next house in Lynton & Lynmouth, Lynmouth for sale or to rent.
| Streets | Postcodes |
|---|---|
| Barbrook Road | EX35 6PB |
| Burvill Street | EX35 6HD |
| Castle Hill | EX35 6EA EX35 6HL |
| Countisbury Hill | EX35 6BN EX35 6ND |
| Harbourside | EX35 6EG |
| Higher Cherrybridge | EX35 6PQ |
| Ilkerton | EX35 6PH |
| Lee Abbey | EX35 6JJ |
| Lee Road | EX35 6HS EX35 6HT EX35 6BX EX35 6HU |
| Longmead | EX35 6DH |
| Lynbridge | EX35 6NS |
| Lynmouth Street | EX35 6EL |
| Lynway | EX35 6AY |
| Market Street | EX35 6AG |
| North Walk | EX35 6ED |
| Rock Lodge Park | EX35 6DN |
| EX35 6BT EX35 6WY EX35 6AB EX35 6BL EX35 6ER EX35 6HN EX35 6JL EX35 6JR EX35 6JS EX35 6LF EX35 6LG EX35 6LJ EX35 6LQ EX35 6NQ EX35 6PX EX35 6PY EX35 6PZ EX35 6QA |
Property price trends in Lynton & Lynmouth
According to the latest Land Registry data, the average home in Lynton & Lynmouth sold for £308,333 in 2025. That figure comes from 53 sales logged over the past 25 years.
Prices have continued to climb over the last three years. Compared with 2021, when the typical sale came in around £217,500, that's a rise of roughly 41.8%.
Looking back five years, average prices are down about 53.5% since 2020, a drop of around £354,663 in cash terms.
Zoom out to the past decade for the fuller picture. Back in 2016, homes here averaged £542,500, so the typical sold price has fallen about 43.2% since then, around 6.1% a year lower.
Frequently asked questions about Lynton & Lynmouth
What is the average price for a property for sale in Lynton & Lynmouth?
The average price for a property for sale in Lynton & Lynmouth is £552,007. This amount is 8% higher than the average price in Lynmouth. There are 294 property listings for sale in Lynton & Lynmouth.
What streets have the most expensive properties for sale in Lynton & Lynmouth?
The streets with the most expensive properties for sale in Lynton & Lynmouth are Ilkerton at an average of £1,150,000 and Countisbury Hill at an average of £556,441.
What streets have the most affordable properties for sale in Lynton & Lynmouth?
The street with the most affordable properties for sale in Lynton & Lynmouth is North Walk at an average of £308,333.
Which train stations are available in or near Lynton & Lynmouth?
Some of the train stations available in or near Lynton & Lynmouth are Barnstaple, Chapelton and Umberleigh.
Property Price Paid in Lynton & Lynmouth by Year
The average sold property price by year was:
| Year | Average Sold Price | Price Change |
Sold Properties
|
|---|---|---|---|
| 2025 | £308,333 | -125% |
3 Properties |
| 2024 | £695,000 | 20% |
4 Properties |
| 2023 | £557,898 | 61% |
27 Properties |
| 2021 | £217,500 | -205% |
2 Properties |
| 2020 | £662,996 | 60% |
4 Properties |
| 2019 | £266,800 | 4% |
5 Properties |
| 2018 | £256,250 | 52% |
4 Properties |
| 2017 | £123,000 | -341% |
1 Property |
| 2016 | £542,500 | 56% |
1 Property |
| 2001 | £239,000 | 6% |
1 Property |
Property Price per Property Type in Lynton & Lynmouth
Here you can find historic sold price data in order to help with your property search.
The average Property Paid Price for specific property types in the last three years are:
| Property Type | Average Sold Price | Sold Properties |
|---|---|---|
| Semi Detached House | £256,000.00 | 2 Semi Detached Houses |
| Detached House | £760,000.00 | 2 Detached Houses |
| Flat | £557,875.00 | 30 Flats |
