
Houses for sale in Lynton And Lynmouth, Lynton
House Prices in Lynton And Lynmouth
Properties in Lynton And Lynmouth have an average house price of £340k and had 71 Property Transactions within the last 3 years¹.
Lynton And Lynmouth is an area in Lynton, Devon with 618 households², where the most expensive property was sold for £1.05M.
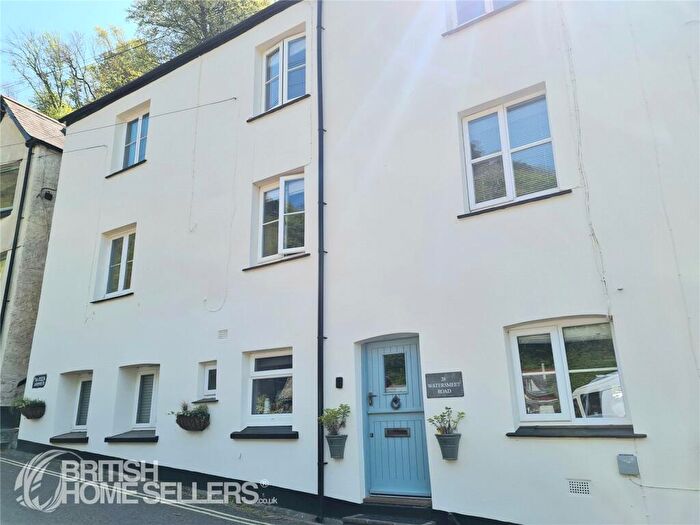
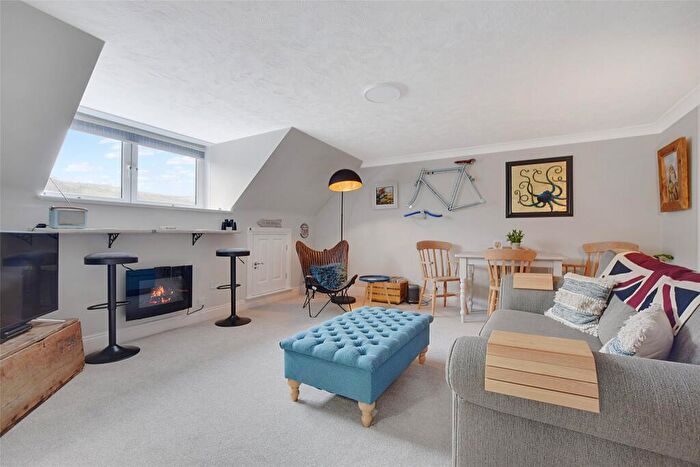
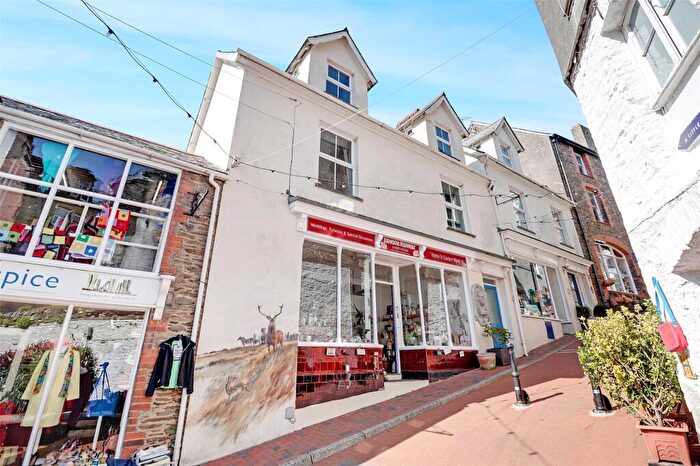
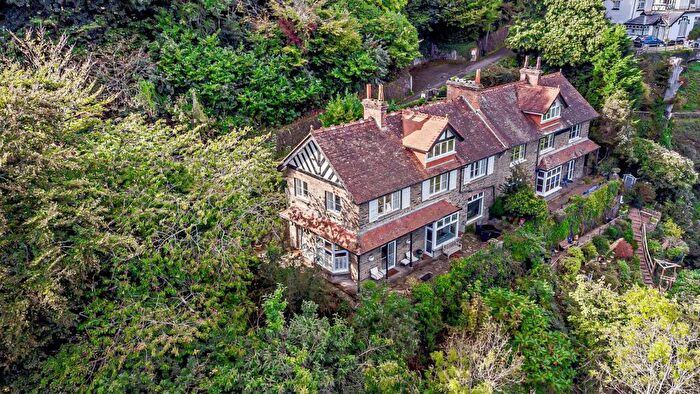
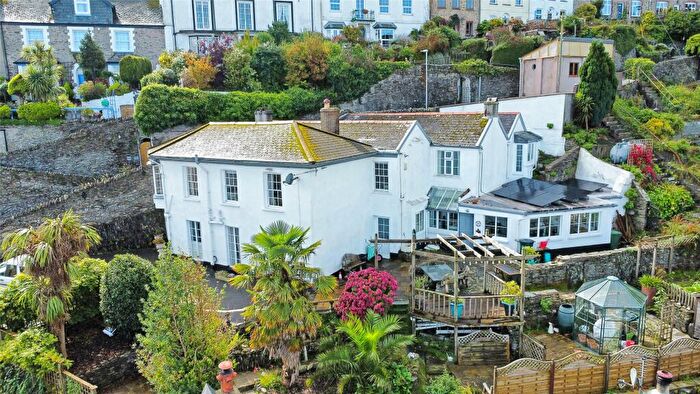
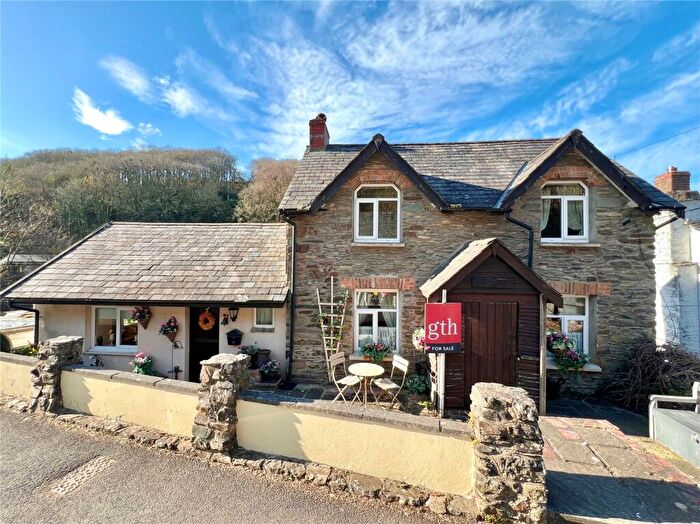
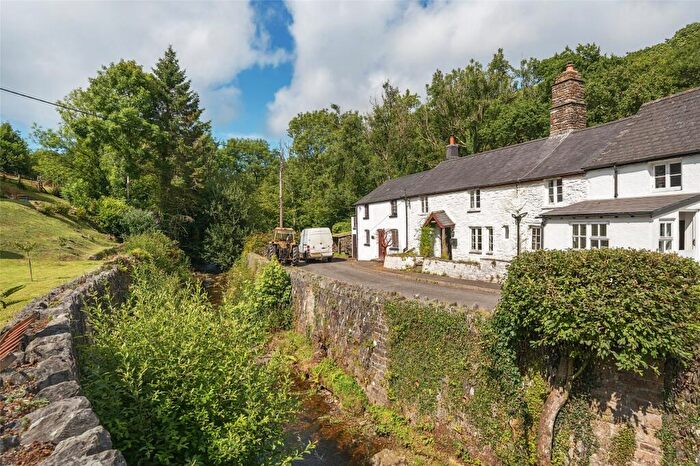
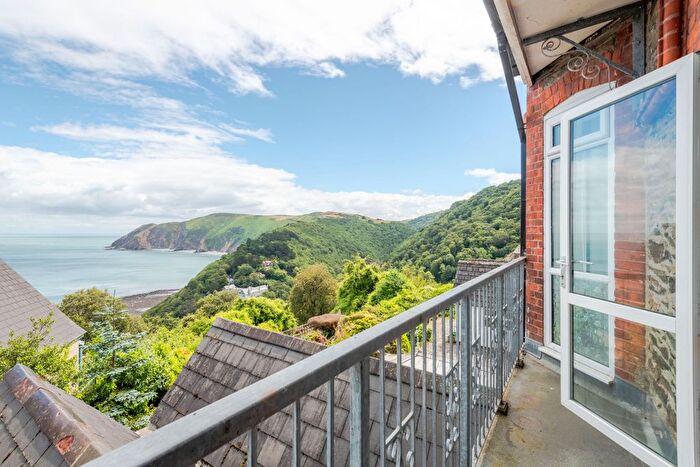
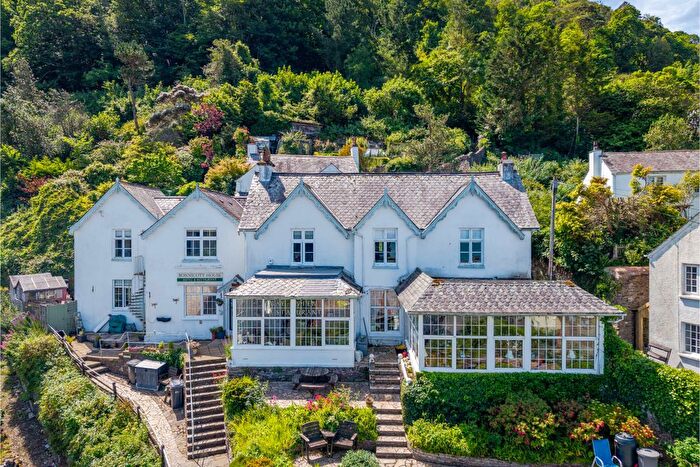
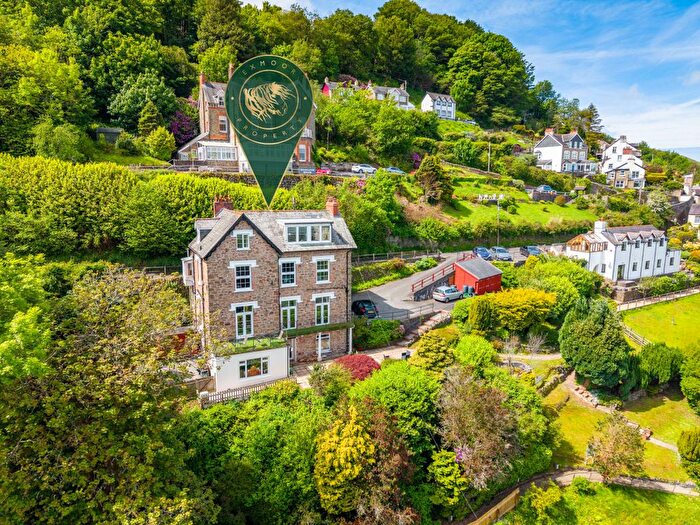
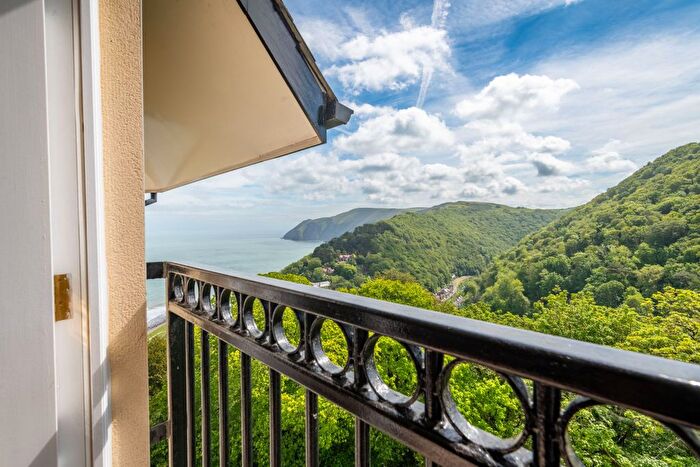
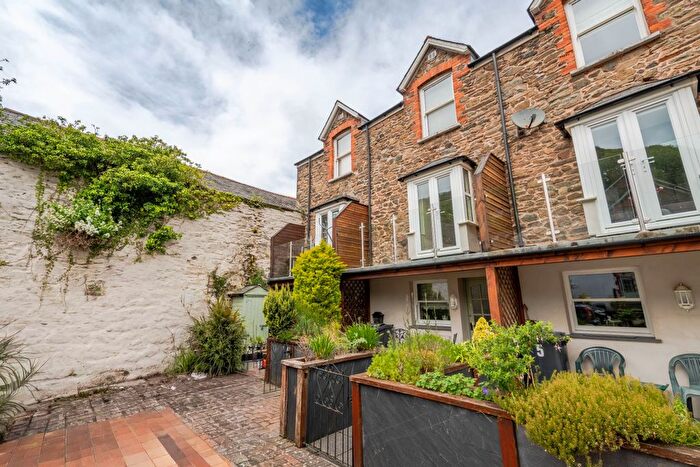
Properties for sale in Lynton And Lynmouth

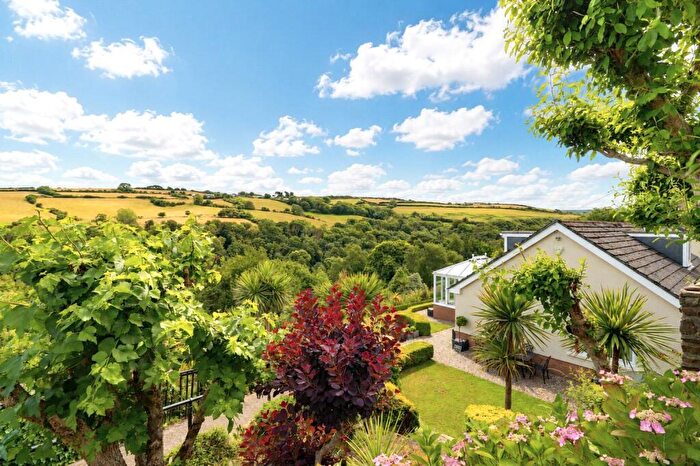

![]()
If you are looking to sell your house, let it out, or receive a property valuation, an expert can help you.
Click the button below to get started.
Previously listed properties in Lynton And Lynmouth
Roads and Postcodes in Lynton And Lynmouth
Navigate through our locations to find the location of your next house in Lynton And Lynmouth, Lynton for sale or to rent.
| Streets | Postcodes |
|---|---|
| Alford Terrace | EX35 6AT |
| Bakers Court Lane | EX35 6EW |
| Barbrook Bungalows | EX35 6PA |
| Belle Vue Avenue | EX35 6DD |
| Blackmores Path | EX35 6AP |
| Broadmead Gardens | EX35 6BG |
| Burvill Street | EX35 6BJ EX35 6HA |
| Caffyns Cross | EX35 6JP |
| Castle Heights | EX35 6JD |
| Castle Hill | EX35 6JA |
| Cavendish Place | EX35 6AD |
| Cherrybridge | EX35 6PE EX35 6PG |
| Church Hill | EX35 6HY |
| Costain Villas | EX35 6DB |
| Cross Street | EX35 6HG |
| Crossmead | EX35 6DG |
| Grattons Drive | EX35 6LW |
| Hollerday Drive | EX35 6HQ |
| Hume Avenue | EX35 6DJ |
| Keals Croft | EX35 6HF |
| Lee Road | EX35 6BP EX35 6BS EX35 6HW EX35 6JH |
| Longmead | EX35 6DQ |
| Lydiate Lane | EX35 6DE EX35 6AJ EX35 6HE EX35 6LA |
| Lyn Way Cottages | EX35 6BA |
| Lynbridge | EX35 6NR |
| Lynbridge Road | EX35 6BD |
| Lynway | EX35 6AX |
| Lynwood Cottages | EX35 6BB |
| Market Flats | EX35 6AQ |
| Market Street | EX35 6AF |
| Normans Cleave | EX35 6AU |
| North Walk | EX35 6HJ |
| Orchard Terrace | EX35 6AL |
| Park Gardens | EX35 6DF |
| Park Street | EX35 6BY |
| Queen Street | EX35 6AA |
| Rock Avenue | EX35 6DL |
| Sinai Cottages | EX35 6AS |
| Sinai Hill | EX35 6AR |
| Station Hill | EX35 6LB |
| Sunnyside Terrace | EX35 6DA |
| Victoria Cottages | EX35 6AN |
| Victoria Place | EX35 6AW |
| Waverley Terrace | EX35 6AH |
| Woodland View | EX35 6BE |
| EX35 6JT EX35 6JW EX35 6LD EX35 6LE EX35 6LH EX35 6LL EX35 6LN EX35 6LP EX35 6NE EX35 6NF EX35 6NG EX35 6PD EX35 6PF EX35 6PS EX35 6PT EX35 6PU |
Property price trends in Lynton And Lynmouth
According to the latest Land Registry data, the average home in Lynton And Lynmouth sold for £250,000 in 2026. That figure comes from 1,051 sales logged over the past 31 years.
Prices have fallen back over the last three years. Compared with 2023, when the typical sale came in around £356,007, that's a fall of roughly 29.8%.
Looking back five years, average prices are down about 15.7% since 2021, a drop of around £46,540 in cash terms.
Zoom out to the past decade for the fuller picture. Back in 2016, homes here averaged £243,474, so the typical sold price has climbed about 2.7% since then, roughly 0.3% a year. Stretch the view to fifteen years and that annual pace holds at about 0.1%.
Frequently asked questions about Lynton And Lynmouth
What is the average price for a property for sale in Lynton And Lynmouth?
The average price for a property for sale in Lynton And Lynmouth is £340,207. There are 292 property listings for sale in Lynton And Lynmouth.
What streets have the most expensive properties for sale in Lynton And Lynmouth?
The streets with the most expensive properties for sale in Lynton And Lynmouth are Cherrybridge at an average of £650,000, Sinai Hill at an average of £525,000 and Lydiate Lane at an average of £465,000.
What streets have the most affordable properties for sale in Lynton And Lynmouth?
The streets with the most affordable properties for sale in Lynton And Lynmouth are Market Flats at an average of £162,987, Victoria Cottages at an average of £166,000 and Broadmead Gardens at an average of £172,500.
Which train stations are available in or near Lynton And Lynmouth?
Some of the train stations available in or near Lynton And Lynmouth are Barnstaple, Chapelton and Umberleigh.
Property Price Paid in Lynton And Lynmouth by Year
The average sold property price by year was:
| Year | Average Sold Price | Price Change |
Sold Properties
|
|---|---|---|---|
| 2026 | £250,000 | -16% |
2 Properties |
| 2025 | £291,157 | -28% |
19 Properties |
| 2024 | £372,973 | 5% |
19 Properties |
| 2023 | £356,007 | 14% |
31 Properties |
| 2022 | £306,885 | 3% |
35 Properties |
| 2021 | £296,540 | 4% |
51 Properties |
| 2020 | £283,871 | 18% |
27 Properties |
| 2019 | £233,670 | -13% |
34 Properties |
| 2018 | £264,428 | 1% |
38 Properties |
| 2017 | £262,454 | 7% |
36 Properties |
Property Price per Property Type in Lynton And Lynmouth
Here you can find historic sold price data in order to help with your property search.
The average Property Paid Price for specific property types in the last three years are:
| Property Type | Average Sold Price | Sold Properties |
|---|---|---|
| Semi Detached House | £354,000.00 | 5 Semi Detached Houses |
| Detached House | £560,913.00 | 20 Detached Houses |
| Terraced House | £271,450.00 | 20 Terraced Houses |
| Flat | £220,671.00 | 26 Flats |
