
Houses for sale in Shebbear & Langtree, Torrington
House Prices in Shebbear & Langtree
Properties in Shebbear & Langtree have an average house price of £230k and had 1 Property Transaction within the last 3 years¹.
Shebbear & Langtree is an area in Torrington, Devon with 63 households², where the most expensive property was sold for £230k.
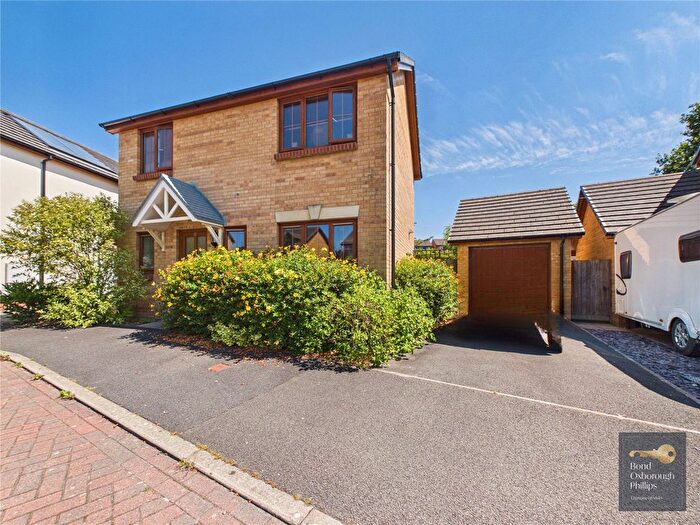
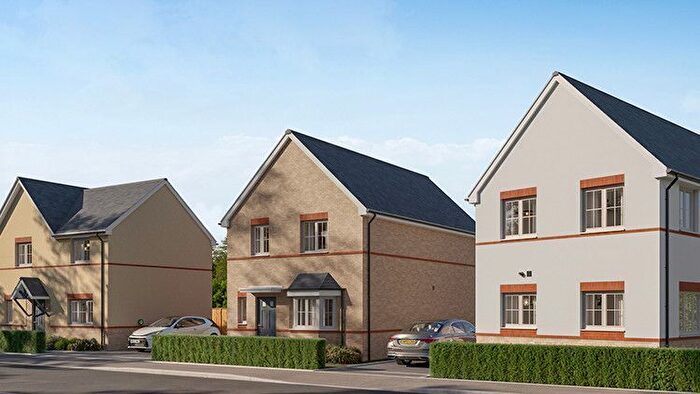
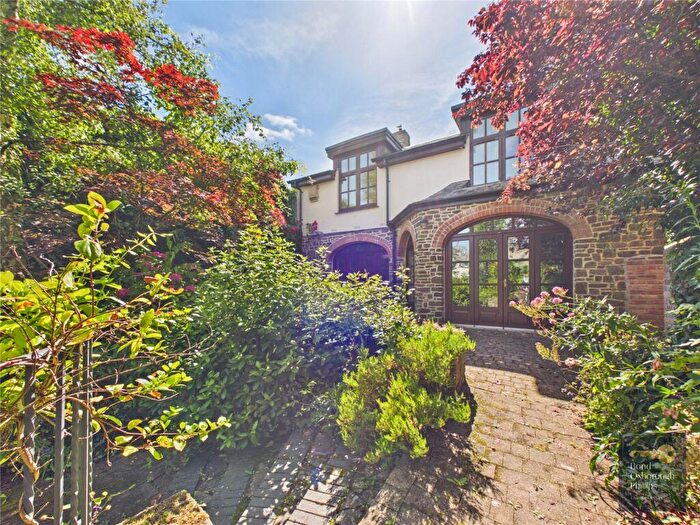
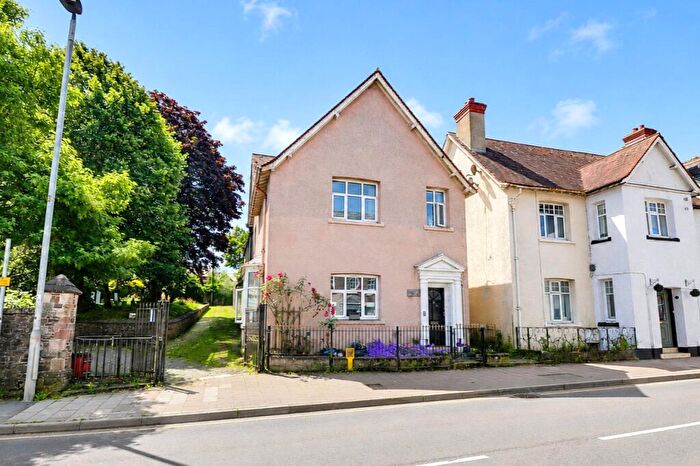
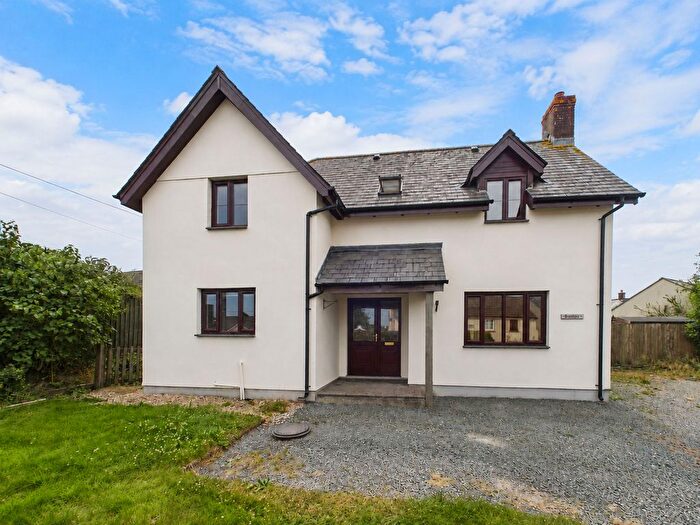
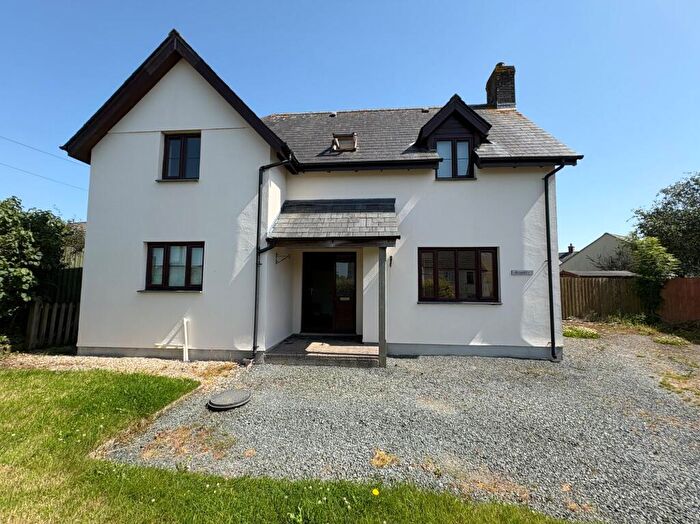
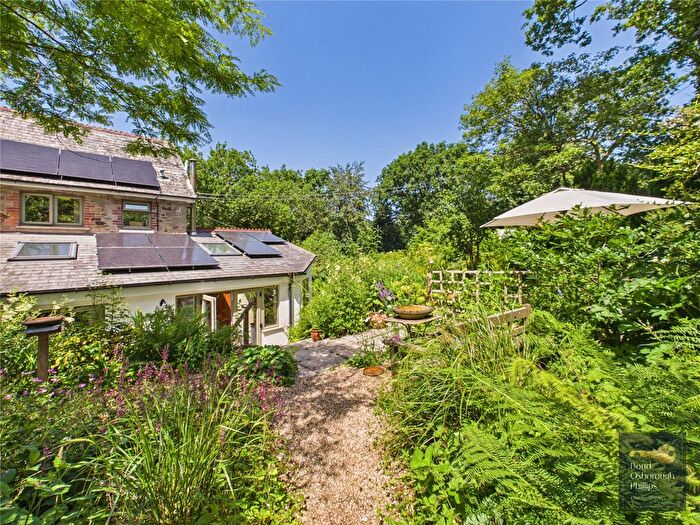
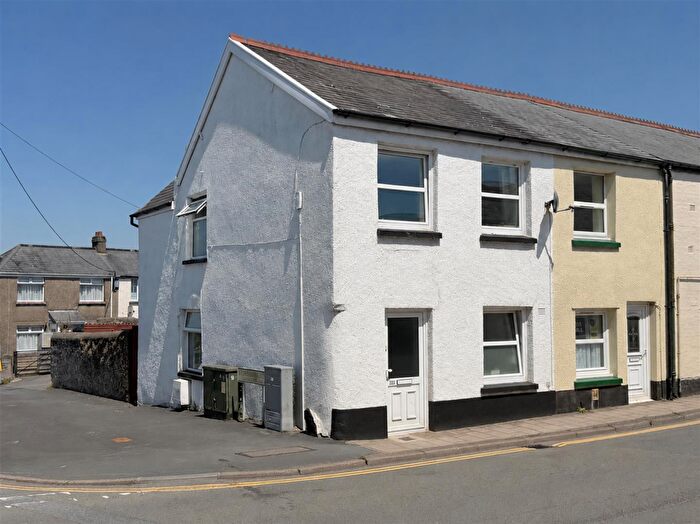
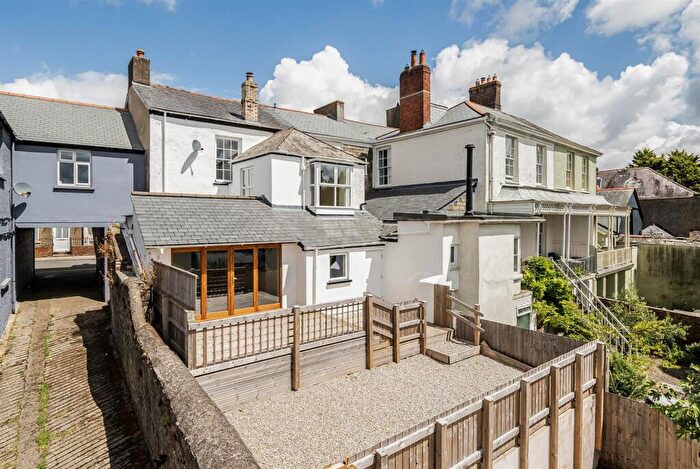
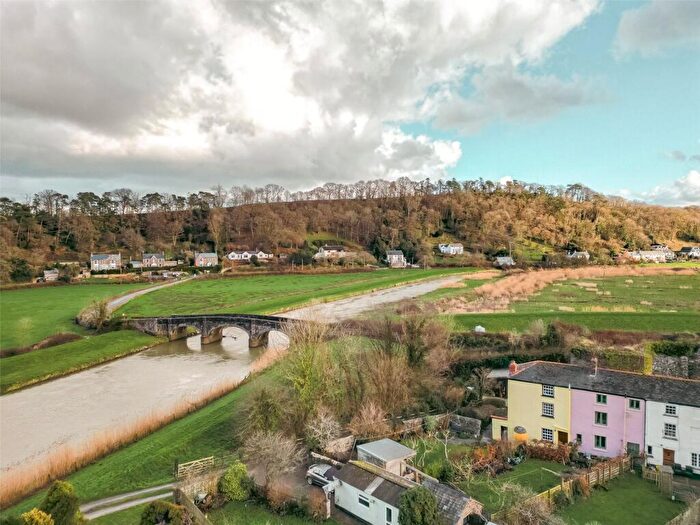
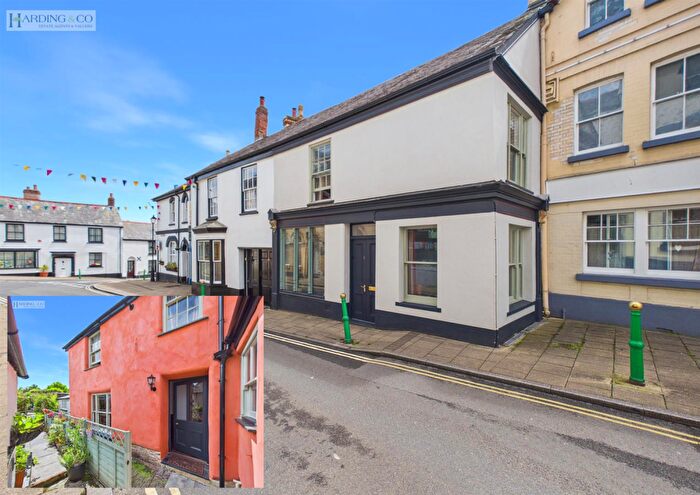
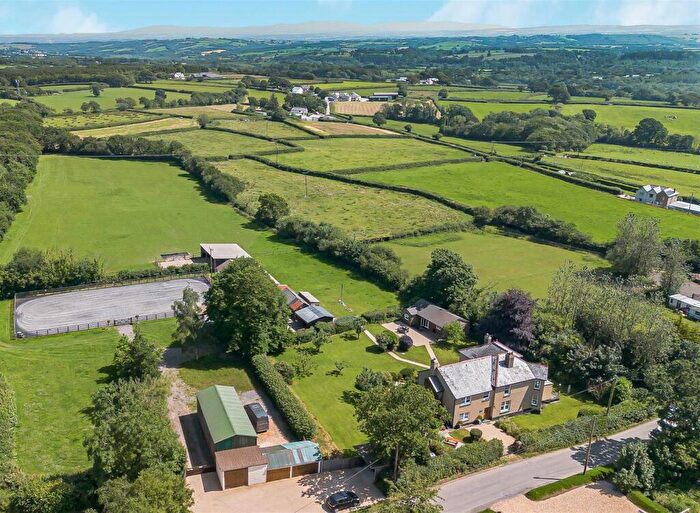
Properties for sale in Shebbear & Langtree
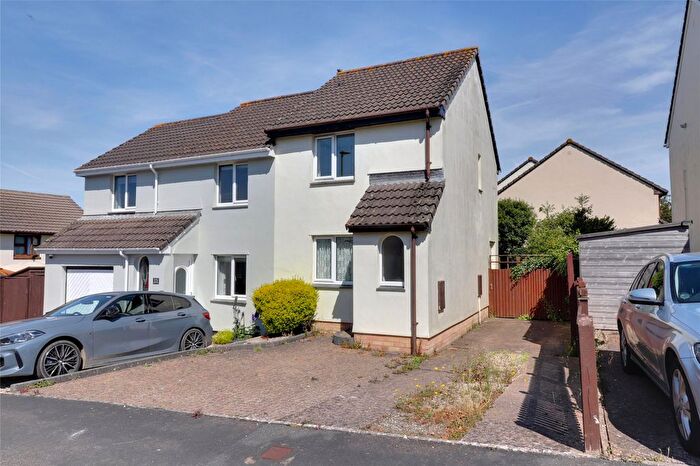
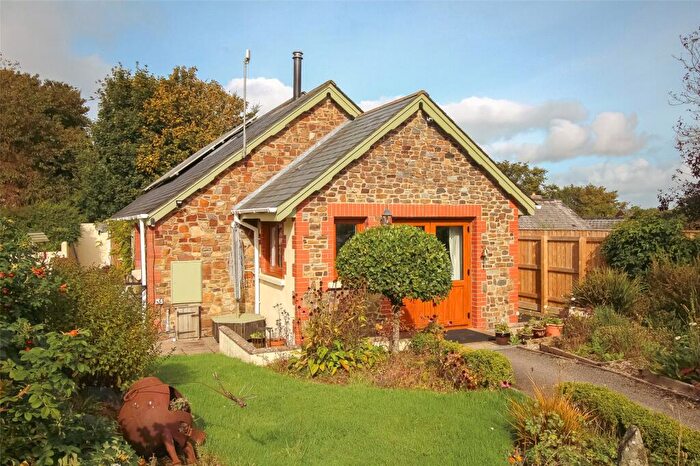
![]()
If you are looking to sell your house, let it out, or receive a property valuation, an expert can help you.
Click the button below to get started.

Roads and Postcodes in Shebbear & Langtree
Navigate through our locations to find the location of your next house in Shebbear & Langtree, Torrington for sale or to rent.
| Streets | Postcodes |
|---|---|
| Chapel Close | EX38 8BG |
| Latch Lane | EX38 8NQ |
| Market Field | EX38 8BQ |
| Peters Marland | EX38 8QE EX38 8QQ EX38 8QJ EX38 8QL EX38 8QN EX38 8QW |
| Stibb Cross | EX38 8LJ EX38 8LN |
| EX38 8NZ EX38 8PJ EX38 8PP EX38 8LE EX38 8LG EX38 8LP EX38 8NA EX38 8NB EX38 8NN EX38 8NY EX38 8PT EX38 8PU EX38 8PZ EX38 8QT |
Property price trends in Shebbear & Langtree
According to the latest Land Registry data, the average home in Shebbear & Langtree sold for £230,000 in 2025. That figure comes from 5 sales logged over the past 9 years.
Prices have fallen back over the last three years. Compared with 2021, when the typical sale came in around £340,000, that's a fall of roughly 32.4%.
Looking back five years, average prices are down about 41.8% since 2019, a drop of around £165,000 in cash terms.
Zoom out to the past decade for the fuller picture. Back in 2016, homes here averaged £290,000, so the typical sold price has fallen about 20.7% since then, around 2.5% a year lower.
Frequently asked questions about Shebbear & Langtree
What is the average price for a property for sale in Shebbear & Langtree?
The average price for a property for sale in Shebbear & Langtree is £230,000. This amount is 16% lower than the average price in Torrington. There are 1,062 property listings for sale in Shebbear & Langtree.
Which train stations are available in or near Shebbear & Langtree?
Some of the train stations available in or near Shebbear & Langtree are Chapelton, Umberleigh and Portsmouth Arms.
Property Price Paid in Shebbear & Langtree by Year
The average sold property price by year was:
| Year | Average Sold Price | Price Change |
Sold Properties
|
|---|---|---|---|
| 2025 | £230,000 | -48% |
1 Property |
| 2021 | £340,000 | -16% |
1 Property |
| 2019 | £395,000 | 24% |
1 Property |
| 2018 | £300,000 | 3% |
1 Property |
| 2016 | £290,000 | - |
1 Property |
Property Price per Property Type in Shebbear & Langtree
Here you can find historic sold price data in order to help with your property search.
The average Property Paid Price for specific property types in the last three years are:
| Property Type | Average Sold Price | Sold Properties |
|---|---|---|
| Detached House | £230,000.00 | 1 Detached House |
