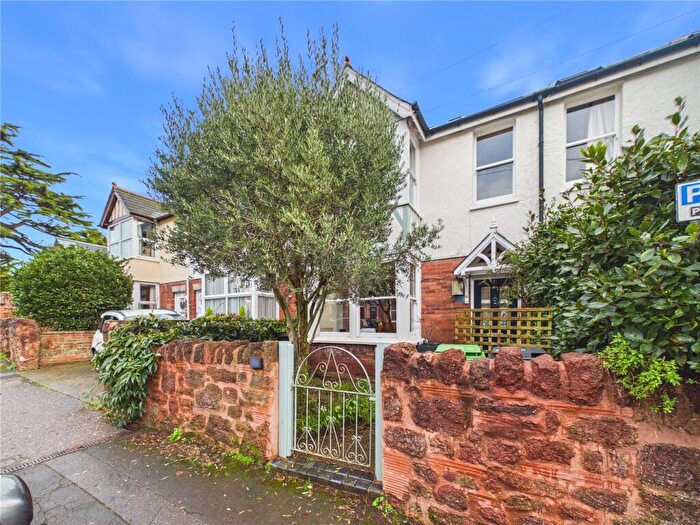
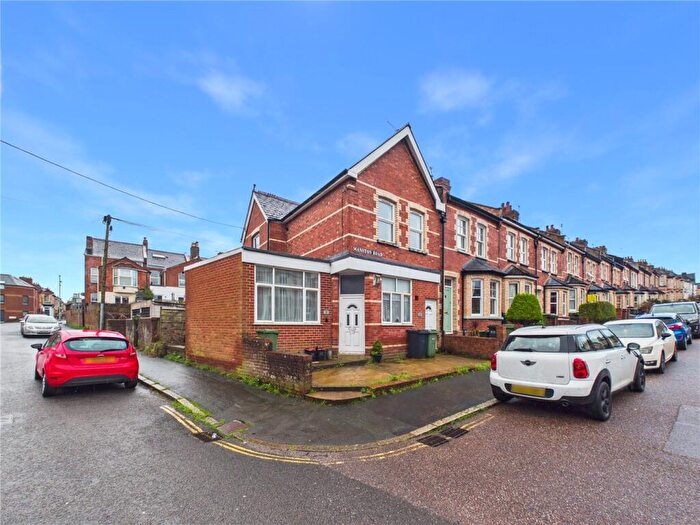
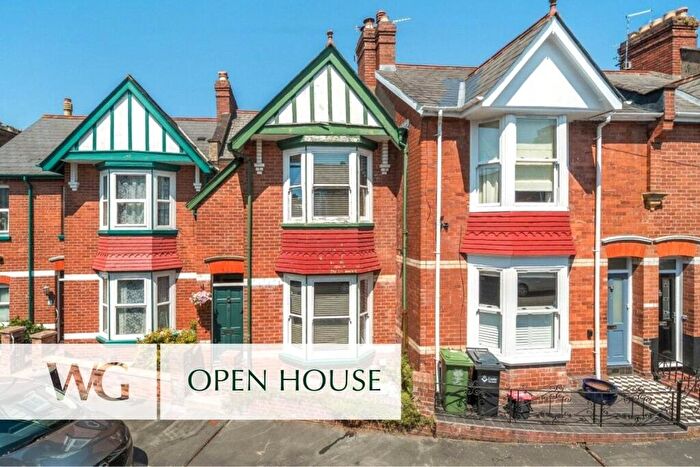
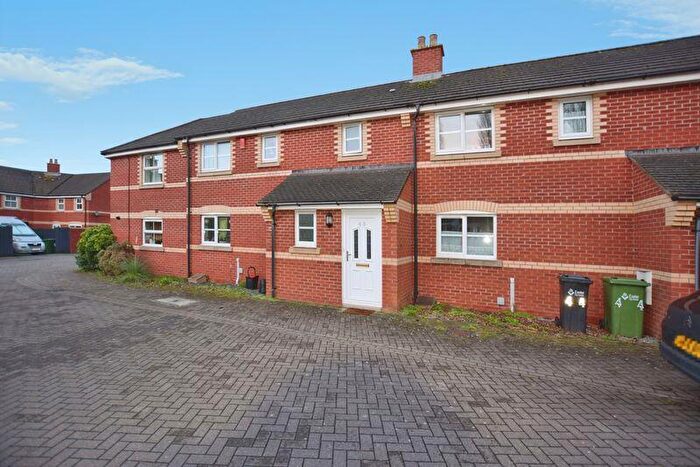
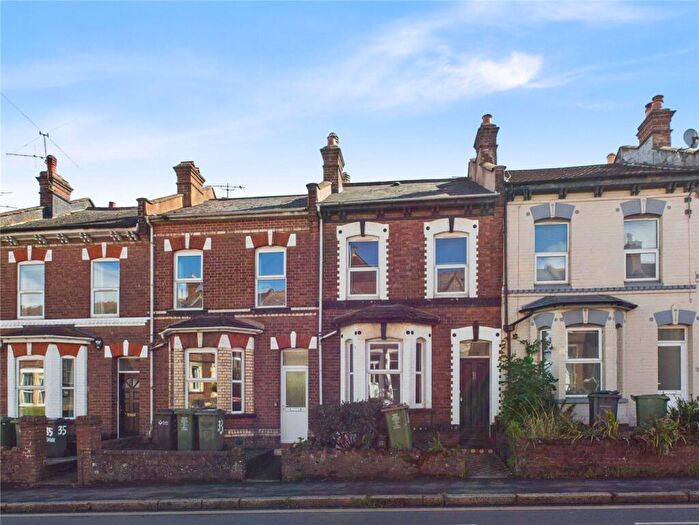
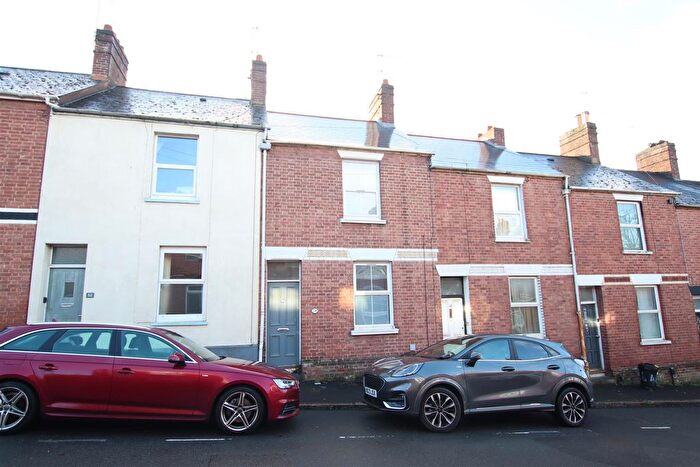
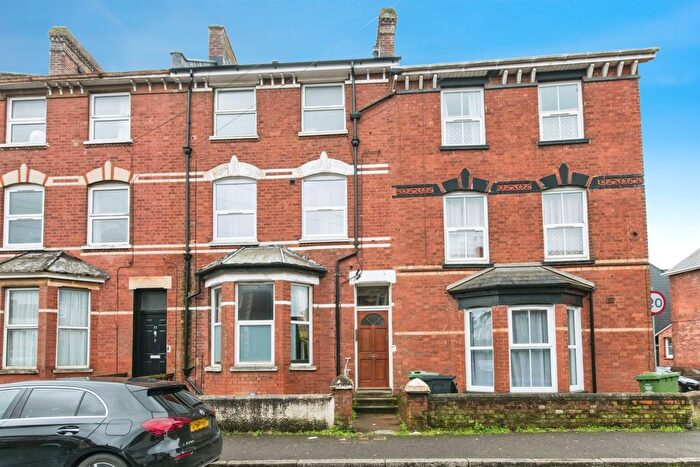
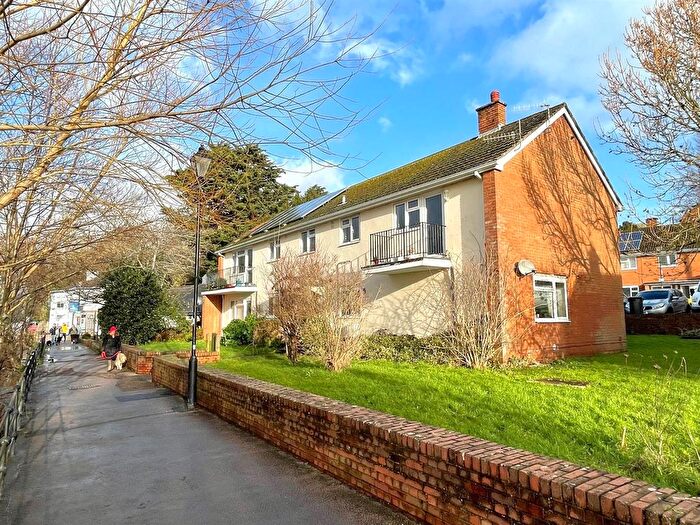
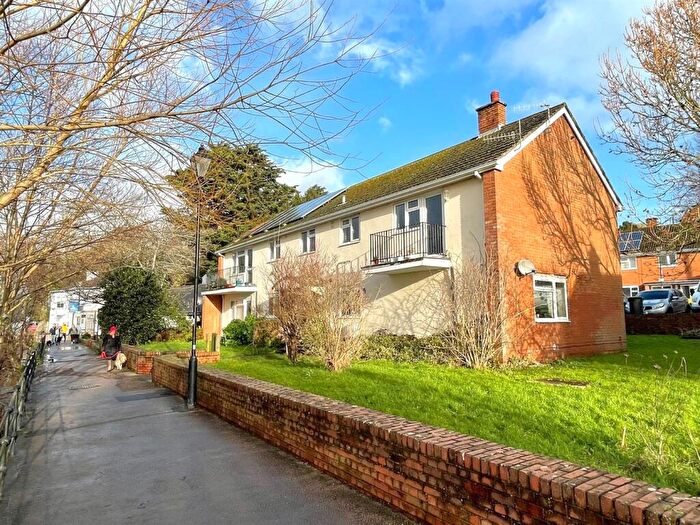
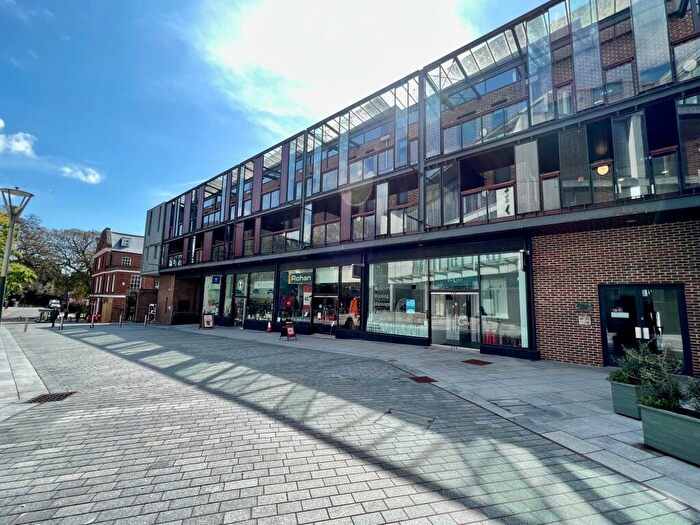
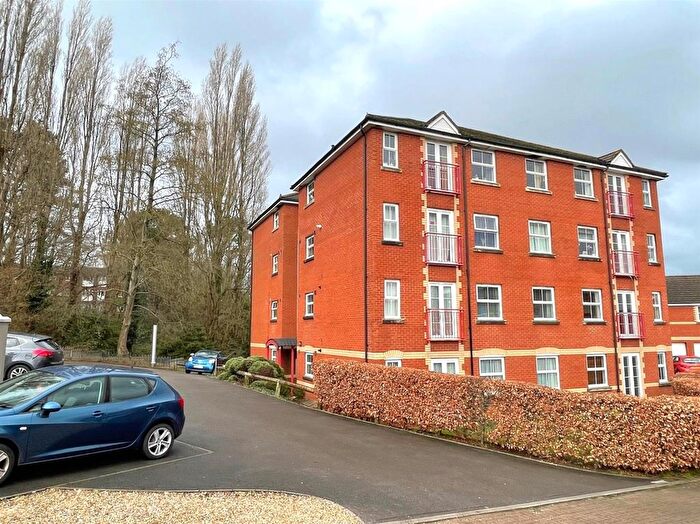
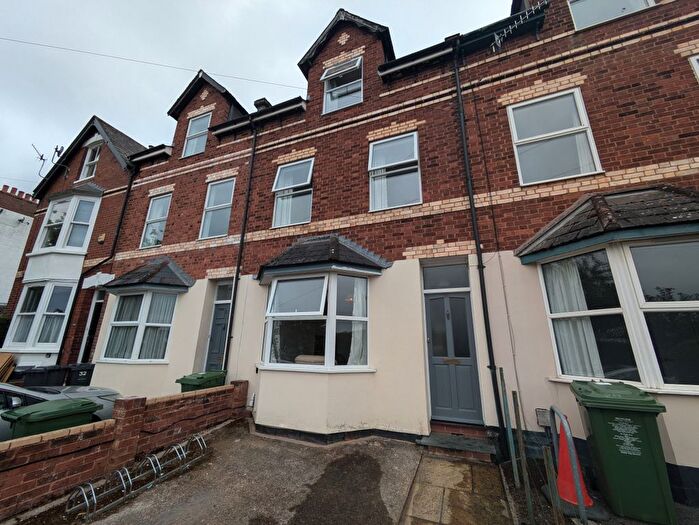
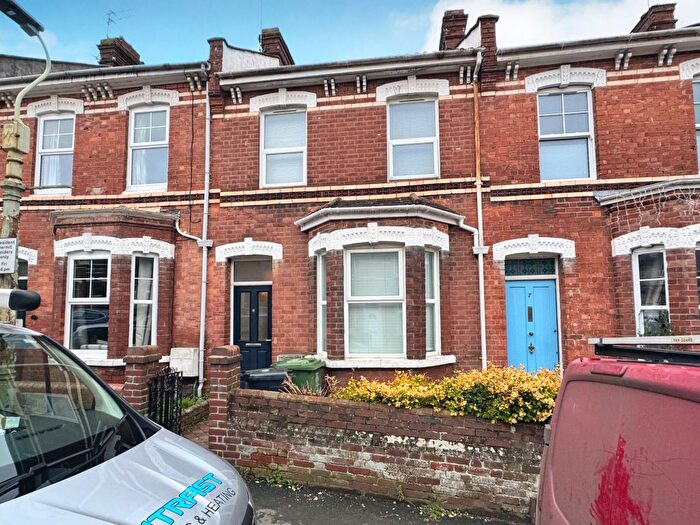
Houses for sale & to rent in Newtown, Exeter
House Prices in Newtown
Properties in Newtown have an average house price of £317,901.00 and had 204 Property Transactions within the last 3 years¹.
Newtown is an area in Exeter, Devon with 2,232 households², where the most expensive property was sold for £1,629,995.00.
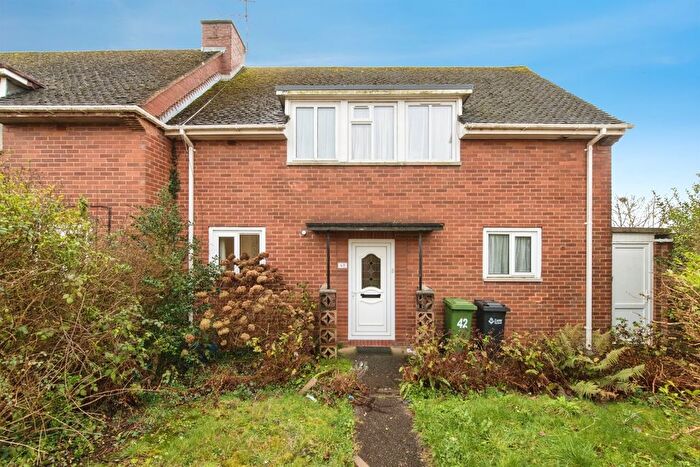
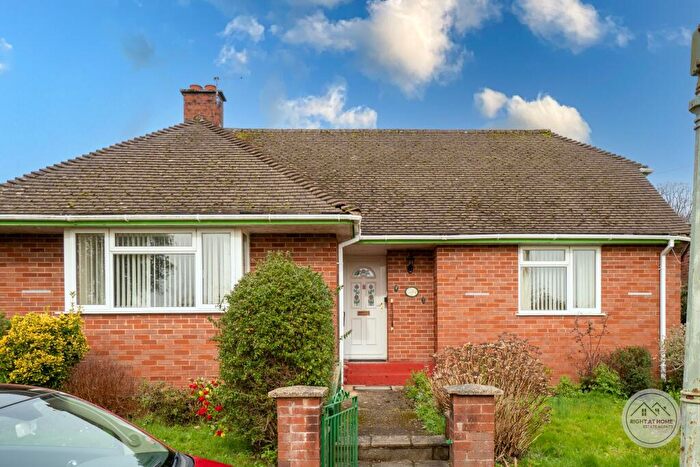
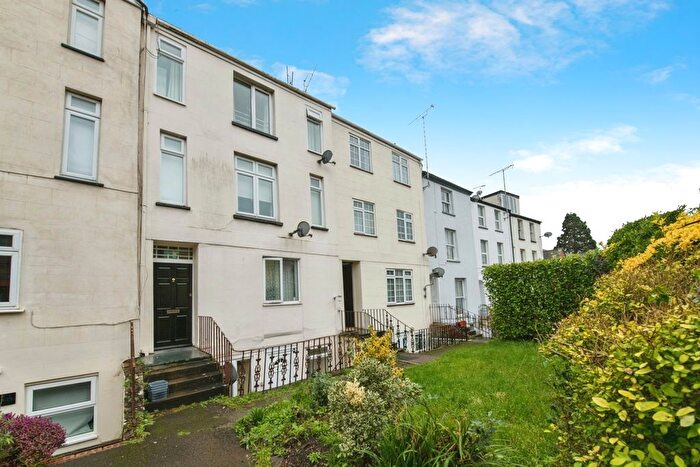
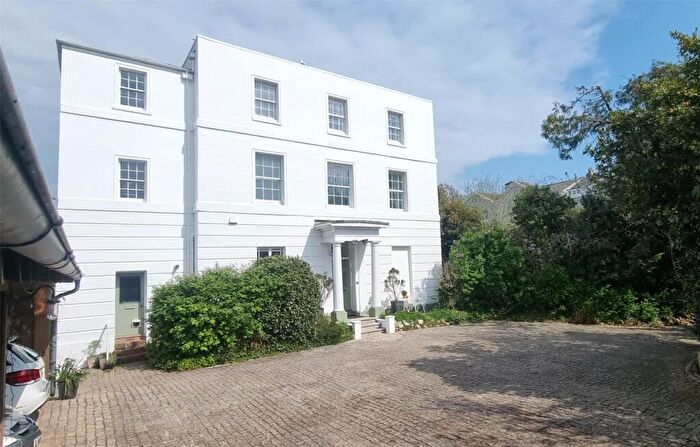
Properties for sale in Newtown
Roads and Postcodes in Newtown
Navigate through our locations to find the location of your next house in Newtown, Exeter for sale or to rent.
| Streets | Postcodes |
|---|---|
| Albert Street | EX1 2BH |
| Albion Place | EX4 6LH |
| Alexandra Terrace | EX4 6SY |
| Archibald Road | EX1 1SA |
| Athelstan Road | EX1 1SB |
| Baring Crescent | EX1 1TL |
| Baring Flats | EX1 2NB |
| Barnfield Hill | EX1 1SR |
| Barnfield Road | EX1 1RX |
| Belgrave Road | EX1 2NP |
| Belmont Mews | EX1 2EY |
| Belmont Road | EX1 2HF EX1 2HG EX1 2HQ |
| Blackboy Road | EX4 6SG EX4 6SR EX4 6SS EX4 6ST EX4 6SW EX4 6SX EX4 6SZ EX4 6TB |
| Chute Street | EX1 2BX EX1 2BZ |
| Clifton Cottages | EX1 2BY |
| Clifton Hill | EX1 2DJ EX1 2DL EX1 2EL |
| Clifton Road | EX1 2BJ EX1 2BN EX1 2BP EX1 2BR EX1 2BW |
| Clifton Street | EX1 2EH EX1 2EJ EX1 2EN |
| Codrington Street | EX1 2BU |
| College Avenue | EX2 4TH |
| College Road | EX1 1TE EX1 1TG |
| Denmark Road | EX1 1SE EX1 1SL |
| East John Walk | EX1 2EP EX1 2EW |
| Elmside | EX4 6LN EX4 6LR EX4 6LS EX4 6LW |
| Elmside Close | EX4 6LP |
| Exon Mews | EX4 7BU |
| Gladstone Road | EX1 2EB EX1 2EE |
| Gordon Road | EX1 2DH |
| Grosvenor Place | EX1 2HJ EX1 2JP |
| Heavitree Road | EX1 2LD EX1 2LG EX1 2LP EX1 2LQ EX1 2LY EX1 2LZ EX1 2ND |
| Herschell Road | EX4 6LX |
| Iddesleigh Road | EX4 6LY |
| Jesmond Road | EX1 2DF EX1 2DG |
| Lower Summerlands | EX1 2LJ |
| Lucas Avenue | EX4 6LZ |
| Magdalen Road | EX2 4TA EX2 4TF EX2 4TG EX2 4TN EX2 4TT |
| May Street | EX4 6LL |
| Mount Pleasant Road | EX4 7AD |
| Newtown Close | EX1 2EU |
| Old Tiverton Road | EX4 6LD EX4 6LJ EX4 6LQ |
| Parr Close | EX1 2BG |
| Parr Street | EX1 2BD EX1 2BE |
| Polsloe Road | EX1 2NF |
| Portland Street | EX1 2EG EX1 2EQ |
| Prospect Gardens | EX4 6TA |
| Raleigh Road | EX1 1TQ |
| Red Lion Lane | EX1 2FG |
| Rosebery Road | EX4 6LT |
| Salem Place | EX4 6SL |
| Salisbury Road | EX4 6LU |
| Sandford Walk | EX1 2ER EX1 2ES EX1 2ET |
| Seldon Crescent | EX1 3WF |
| Sidwell Street | EX4 6RF EX4 6RT EX4 6RY |
| Silver Lane | EX4 6SQ |
| Spicer Road | EX1 1SX EX1 1SY EX1 1TA EX1 1TB EX1 1TD |
| Spinning Path | EX4 6SN |
| St Matthews Close | EX1 2EX |
| Toronto Road | EX4 6LE EX4 6LF |
| Verney Street | EX1 2AW EX1 2FE |
Transport near Newtown
-
St.James' Park Station
-
Exeter Central Station
-
Polsloe Bridge Station
-
Exeter St. David's Station
-
Exeter St. Thomas Station
-
Digby and Sowton Station
-
Pinhoe Station
-
Newcourt Station
- FAQ
- Price Paid By Year
- Property Type Price
Frequently asked questions about Newtown
What is the average price for a property for sale in Newtown?
The average price for a property for sale in Newtown is £317,901. This amount is 10% lower than the average price in Exeter. There are 3,261 property listings for sale in Newtown.
What streets have the most expensive properties for sale in Newtown?
The streets with the most expensive properties for sale in Newtown are Baring Crescent at an average of £1,148,850, Magdalen Road at an average of £793,165 and Heavitree Road at an average of £570,000.
What streets have the most affordable properties for sale in Newtown?
The streets with the most affordable properties for sale in Newtown are Belgrave Road at an average of £122,000, Verney Street at an average of £131,500 and Grosvenor Place at an average of £134,025.
Which train stations are available in or near Newtown?
Some of the train stations available in or near Newtown are St.James' Park, Exeter Central and Polsloe Bridge.
Property Price Paid in Newtown by Year
The average sold property price by year was:
| Year | Average Sold Price | Price Change |
Sold Properties
|
|---|---|---|---|
| 2025 | £284,812 | -17% |
56 Properties |
| 2024 | £333,026 | 2% |
75 Properties |
| 2023 | £327,744 | 7% |
73 Properties |
| 2022 | £304,011 | 7% |
86 Properties |
| 2021 | £282,995 | 2% |
109 Properties |
| 2020 | £276,168 | 8% |
80 Properties |
| 2019 | £253,472 | -1% |
76 Properties |
| 2018 | £254,833 | -11% |
97 Properties |
| 2017 | £282,414 | 6% |
81 Properties |
| 2016 | £264,908 | 20% |
116 Properties |
| 2015 | £212,323 | -1% |
112 Properties |
| 2014 | £214,265 | 19% |
123 Properties |
| 2013 | £174,373 | 5% |
76 Properties |
| 2012 | £165,752 | -6% |
89 Properties |
| 2011 | £176,359 | -15% |
92 Properties |
| 2010 | £202,067 | 10% |
71 Properties |
| 2009 | £181,171 | -12% |
64 Properties |
| 2008 | £202,533 | -10% |
83 Properties |
| 2007 | £221,945 | 17% |
118 Properties |
| 2006 | £184,532 | 10% |
168 Properties |
| 2005 | £166,758 | 5% |
132 Properties |
| 2004 | £157,682 | 5% |
124 Properties |
| 2003 | £149,556 | 16% |
159 Properties |
| 2002 | £125,742 | 27% |
144 Properties |
| 2001 | £91,689 | 8% |
171 Properties |
| 2000 | £84,574 | 22% |
146 Properties |
| 1999 | £66,207 | 8% |
142 Properties |
| 1998 | £61,132 | -1% |
123 Properties |
| 1997 | £61,730 | 4% |
102 Properties |
| 1996 | £59,178 | 9% |
108 Properties |
| 1995 | £53,584 | - |
93 Properties |
Property Price per Property Type in Newtown
Here you can find historic sold price data in order to help with your property search.
The average Property Paid Price for specific property types in the last three years are:
| Property Type | Average Sold Price | Sold Properties |
|---|---|---|
| Semi Detached House | £606,082.00 | 12 Semi Detached Houses |
| Detached House | £774,400.00 | 8 Detached Houses |
| Terraced House | £351,625.00 | 107 Terraced Houses |
| Flat | £178,698.00 | 77 Flats |

