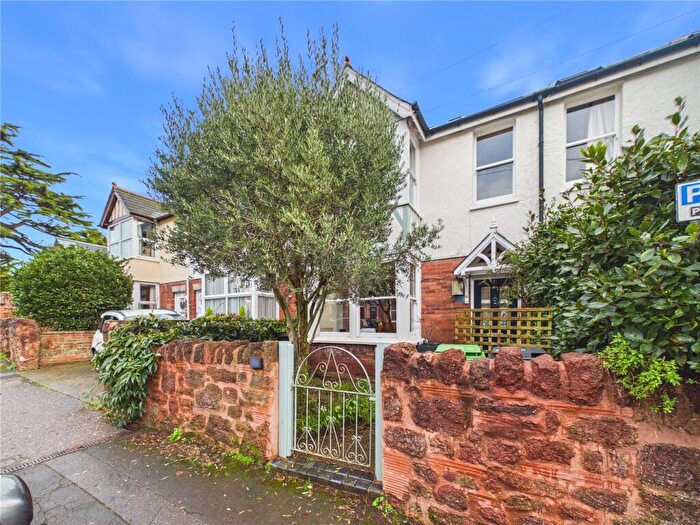
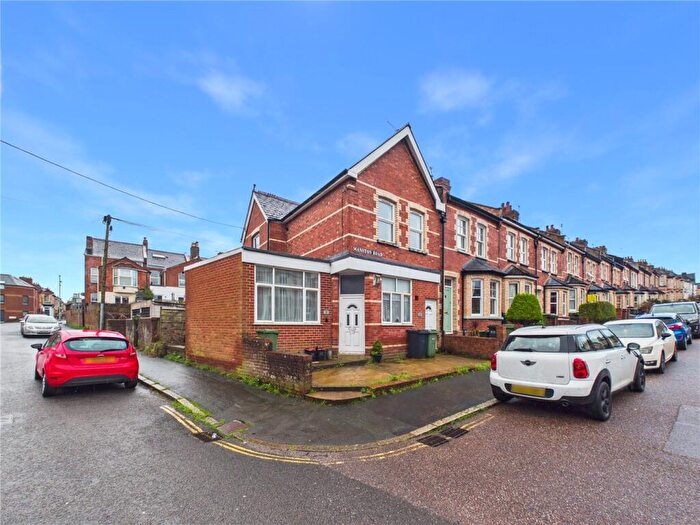
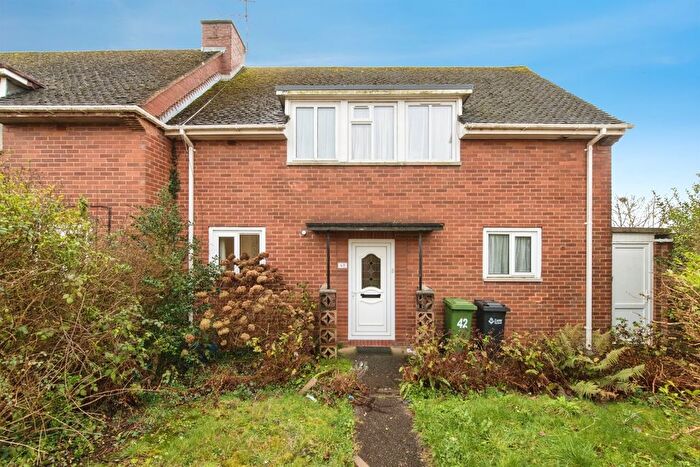
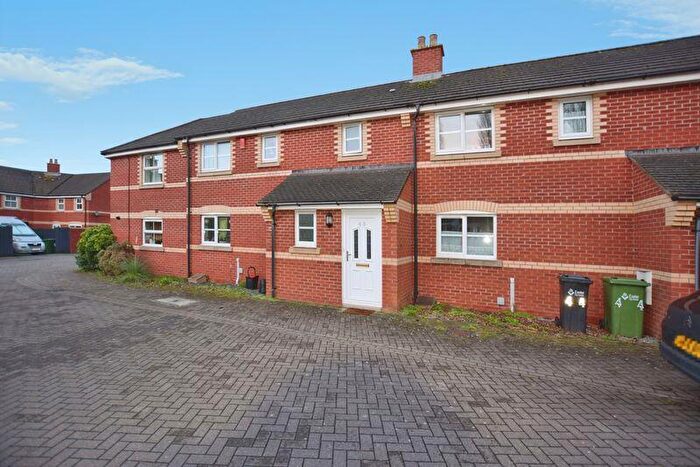
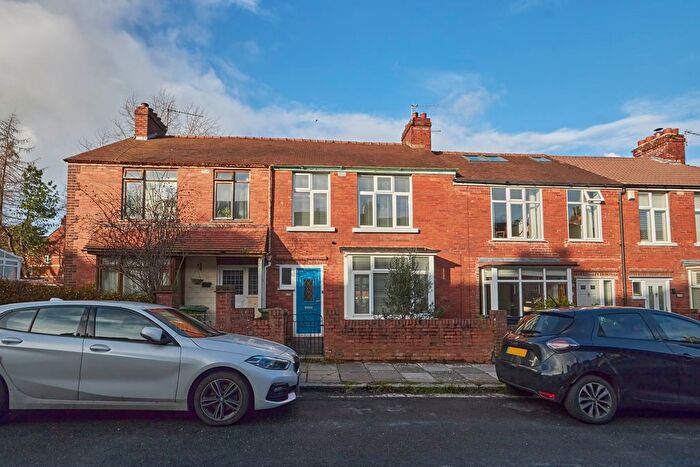
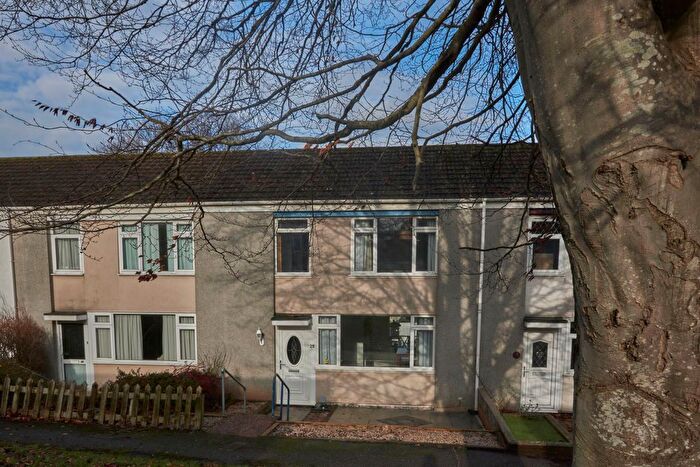
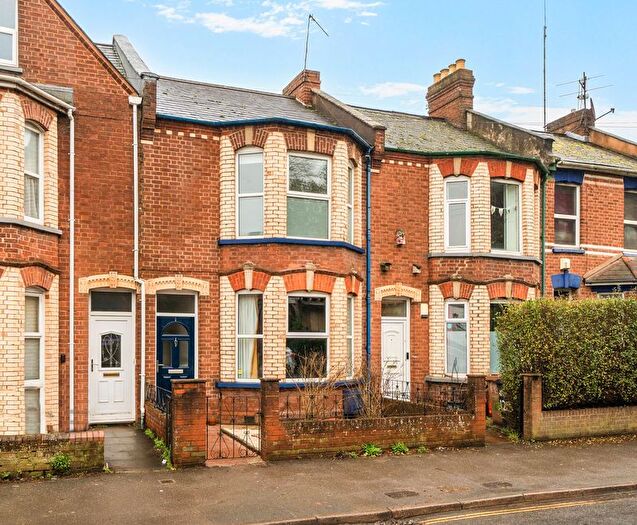
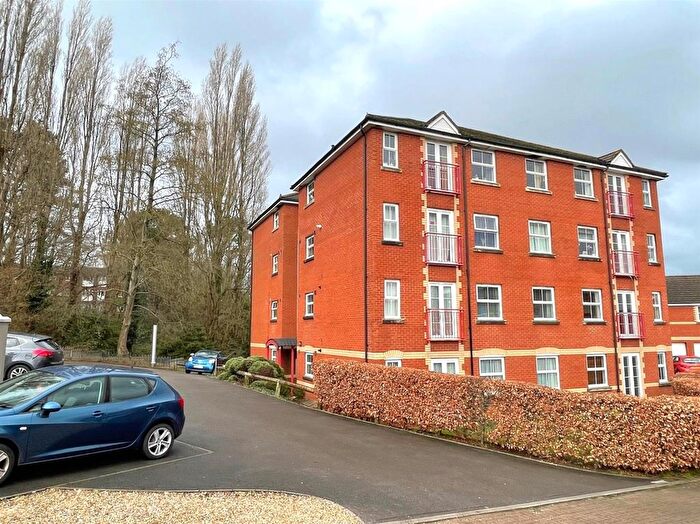
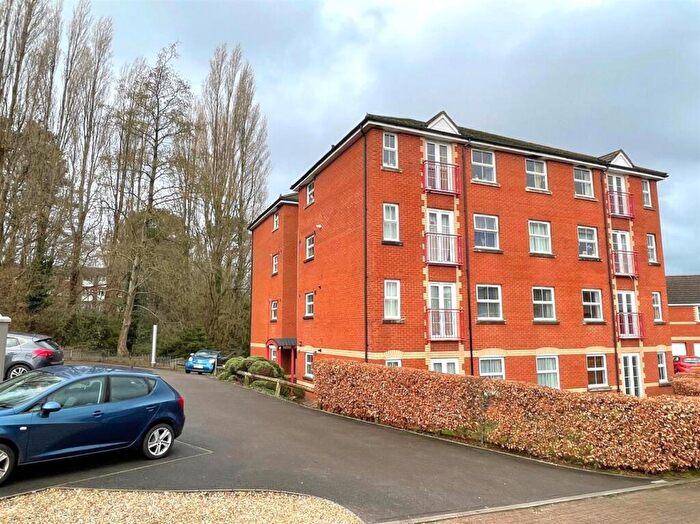
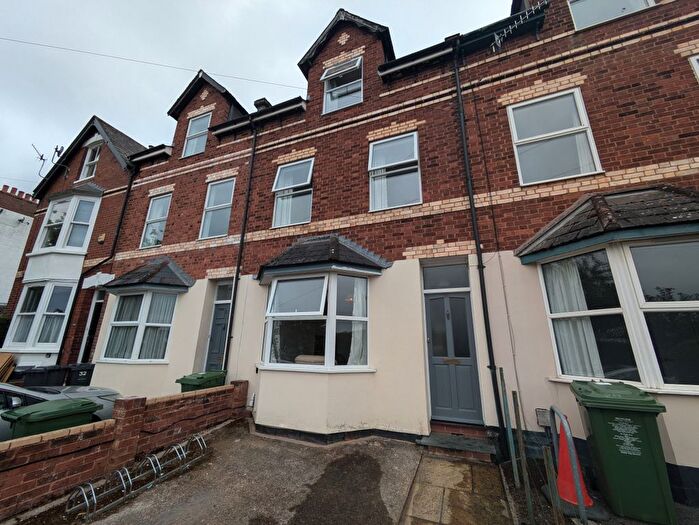
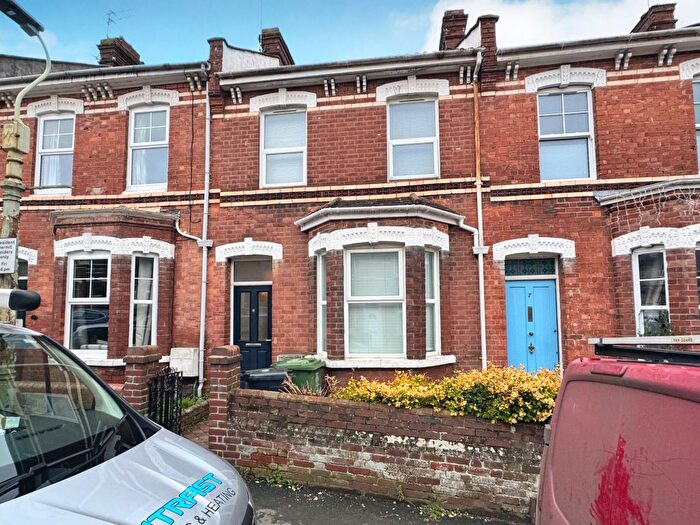
Houses for sale & to rent in Polsloe, Exeter
House Prices in Polsloe
Properties in Polsloe have an average house price of £327,327.00 and had 226 Property Transactions within the last 3 years¹.
Polsloe is an area in Exeter, Devon with 2,434 households², where the most expensive property was sold for £981,888.00.
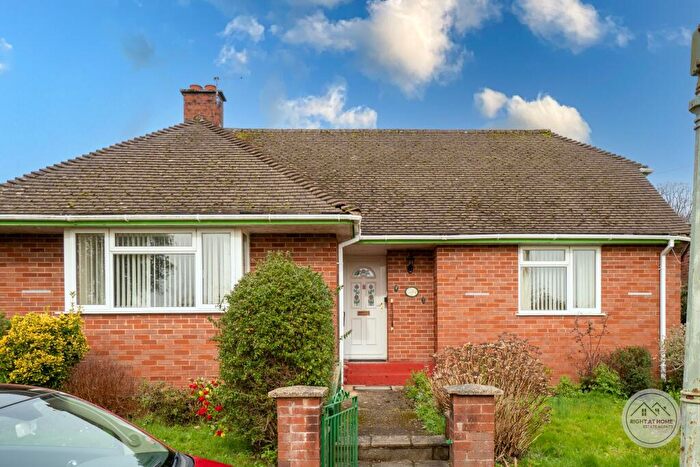
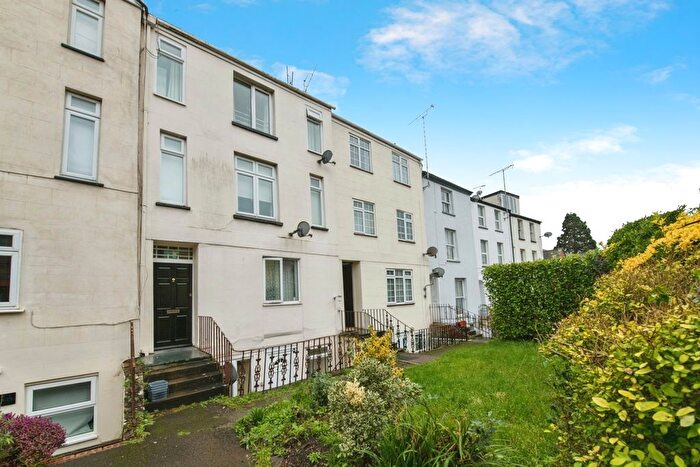
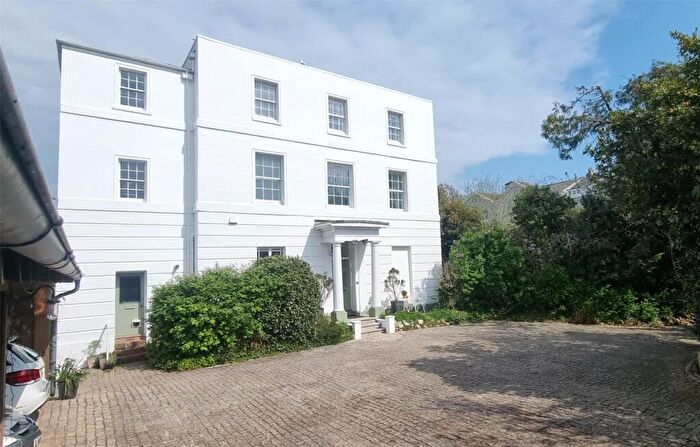
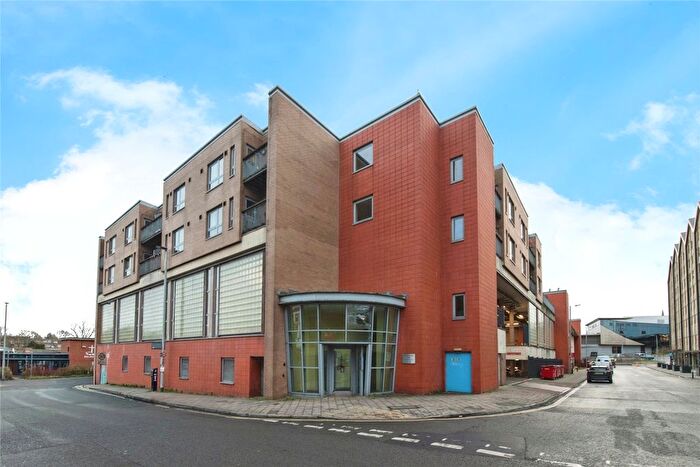
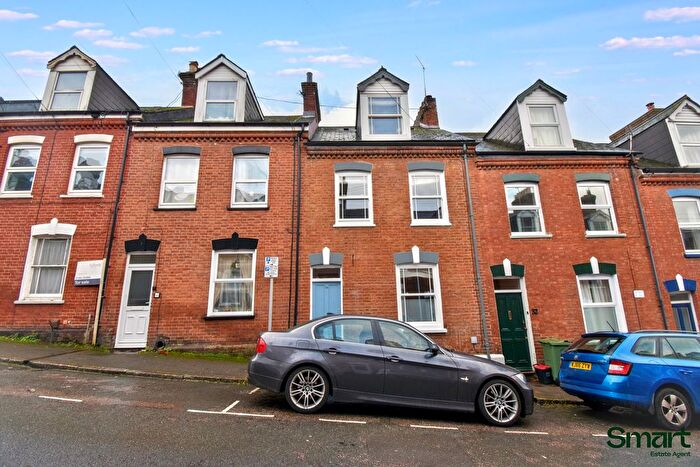
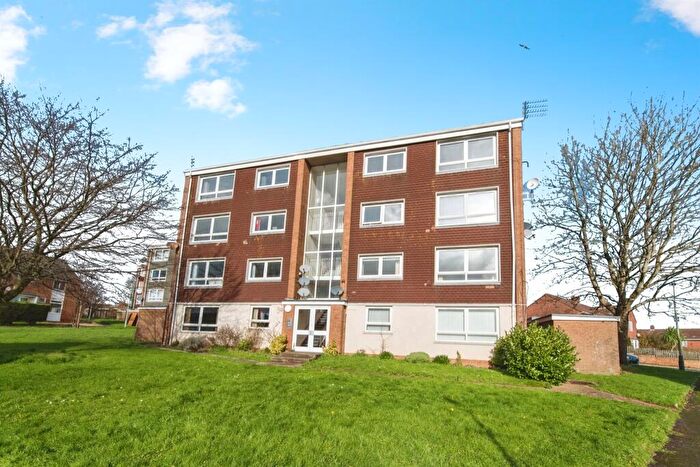
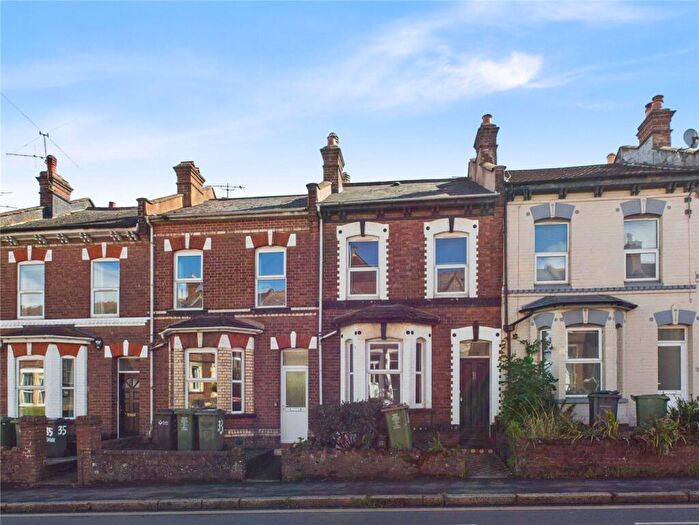
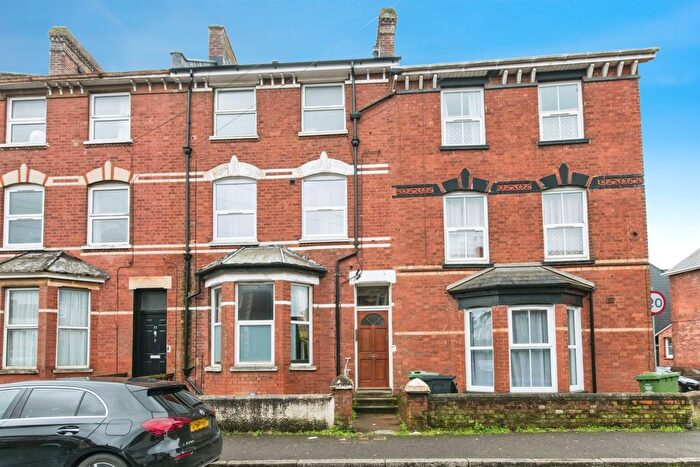
Properties for sale in Polsloe
Roads and Postcodes in Polsloe
Navigate through our locations to find the location of your next house in Polsloe, Exeter for sale or to rent.
| Streets | Postcodes |
|---|---|
| Abbey Road | EX4 7BG |
| Abbots Road | EX4 7AN |
| Beacon Avenue | EX4 7JD EX4 7JE |
| Bonnington Grove | EX1 2QY |
| Cavendish Road | EX1 2PB |
| Chaucer Grove | EX4 7BX |
| Clinton Avenue | EX4 7BA |
| Commins Road | EX1 2PZ EX1 2QB |
| East Avenue | EX1 2DX EX1 2DY |
| Elton Road | EX4 7AT |
| First Avenue | EX1 2PH EX1 2PL |
| Fore Street | EX1 2QQ |
| Fowey Close | EX1 2PY |
| Fulford Road | EX1 2UA |
| Greyfriars Road | EX4 7BS |
| Hamlin Lane | EX1 2SD |
| Herbert Road | EX1 2UH EX1 2UQ |
| Jesmond Villas | EX1 2HW |
| Jubilee Road | EX1 2HU EX1 2HX |
| Kings Road | EX4 7AS |
| Ladysmith Road | EX1 2PP EX1 2PS EX1 2PU |
| Lower Avenue | EX1 2PR |
| Mansfield Road | EX4 6NF |
| Manston Road | EX1 2QA |
| Monks Road | EX4 7AY EX4 7AZ EX4 7BB EX4 7BE EX4 7BL EX4 7BN EX4 7BQ |
| Monkswell Road | EX4 7AX |
| Mont Le Grand | EX1 2PA EX1 2PD |
| Morley Road | EX4 7BD |
| Mount Pleasant Road | EX4 7AB EX4 7AE EX4 7AF EX4 7AH EX4 7AQ |
| North Avenue | EX1 2DU |
| Old Tiverton Road | EX4 6NE EX4 6NG |
| Pamela Road | EX1 2UF |
| Park Road | EX1 2HP EX1 2HS EX1 2HT |
| Pinhoe Road | EX4 7HH EX4 7HJ EX4 7HL EX4 7HP EX4 7HQ EX4 7HR EX4 7HS EX4 7HT EX4 7HU EX4 7HX EX4 7HY EX4 7HZ EX4 7JQ |
| Polsloe Road | EX1 2DN EX1 2DR EX1 2DS EX1 2EA EX1 2HL EX1 2NG |
| Pretoria Road | EX1 2PT |
| Priory Road | EX4 7AL EX4 7AP EX4 7AR EX4 7AU EX4 7AW |
| Regents Park | EX1 2NT EX1 2NU EX1 2NX EX1 2NY EX1 2NZ |
| Sampsons Lane | EX1 2DP |
| Second Avenue | EX1 2PN |
| South Avenue | EX1 2DZ |
| St Annes Road | EX1 2QD |
| St Johns Road | EX1 2HR |
| St Marks Avenue | EX1 2PX |
| Tarbet Avenue | EX1 2UE |
| Third Avenue | EX1 2PJ |
| Thompson Road | EX1 2UB |
| Thurlow Road | EX4 7AA |
| Tresillian Gardens | EX4 7AJ |
| Whitefriars Walk | EX4 7BT |
| Wyndham Avenue | EX1 2PQ |
Transport near Polsloe
-
Polsloe Bridge Station
-
St.James' Park Station
-
Exeter Central Station
-
Exeter St. David's Station
-
Exeter St. Thomas Station
-
Pinhoe Station
-
Digby and Sowton Station
-
Newcourt Station
- FAQ
- Price Paid By Year
- Property Type Price
Frequently asked questions about Polsloe
What is the average price for a property for sale in Polsloe?
The average price for a property for sale in Polsloe is £327,327. This amount is 7% lower than the average price in Exeter. There are 2,735 property listings for sale in Polsloe.
What streets have the most expensive properties for sale in Polsloe?
The streets with the most expensive properties for sale in Polsloe are Old Tiverton Road at an average of £577,500, East Avenue at an average of £463,833 and Mont Le Grand at an average of £462,629.
What streets have the most affordable properties for sale in Polsloe?
The streets with the most affordable properties for sale in Polsloe are Thurlow Road at an average of £195,000, Chaucer Grove at an average of £222,200 and Greyfriars Road at an average of £275,357.
Which train stations are available in or near Polsloe?
Some of the train stations available in or near Polsloe are Polsloe Bridge, St.James' Park and Exeter Central.
Property Price Paid in Polsloe by Year
The average sold property price by year was:
| Year | Average Sold Price | Price Change |
Sold Properties
|
|---|---|---|---|
| 2025 | £315,477 | -2% |
73 Properties |
| 2024 | £320,841 | -8% |
76 Properties |
| 2023 | £344,963 | -1% |
77 Properties |
| 2022 | £348,914 | 11% |
88 Properties |
| 2021 | £311,267 | 13% |
116 Properties |
| 2020 | £271,086 | -10% |
86 Properties |
| 2019 | £299,507 | 10% |
92 Properties |
| 2018 | £268,437 | 3% |
92 Properties |
| 2017 | £259,362 | 4% |
95 Properties |
| 2016 | £248,260 | 9% |
136 Properties |
| 2015 | £226,109 | 4% |
140 Properties |
| 2014 | £217,220 | 7% |
112 Properties |
| 2013 | £202,818 | -0,2% |
112 Properties |
| 2012 | £203,298 | 4% |
79 Properties |
| 2011 | £195,408 | -3% |
134 Properties |
| 2010 | £201,235 | 6% |
111 Properties |
| 2009 | £189,572 | -12% |
90 Properties |
| 2008 | £211,523 | 3% |
98 Properties |
| 2007 | £204,350 | 6% |
139 Properties |
| 2006 | £191,830 | 14% |
196 Properties |
| 2005 | £164,053 | -4% |
170 Properties |
| 2004 | £169,845 | 13% |
122 Properties |
| 2003 | £148,336 | 13% |
165 Properties |
| 2002 | £128,764 | 21% |
161 Properties |
| 2001 | £102,351 | 24% |
194 Properties |
| 2000 | £78,258 | 9% |
179 Properties |
| 1999 | £71,169 | 14% |
184 Properties |
| 1998 | £61,258 | 14% |
155 Properties |
| 1997 | £52,746 | 2% |
154 Properties |
| 1996 | £51,512 | -10% |
139 Properties |
| 1995 | £56,717 | - |
94 Properties |
Property Price per Property Type in Polsloe
Here you can find historic sold price data in order to help with your property search.
The average Property Paid Price for specific property types in the last three years are:
| Property Type | Average Sold Price | Sold Properties |
|---|---|---|
| Semi Detached House | £349,152.00 | 23 Semi Detached Houses |
| Detached House | £345,625.00 | 4 Detached Houses |
| Terraced House | £339,407.00 | 176 Terraced Houses |
| Flat | £209,885.00 | 23 Flats |

