
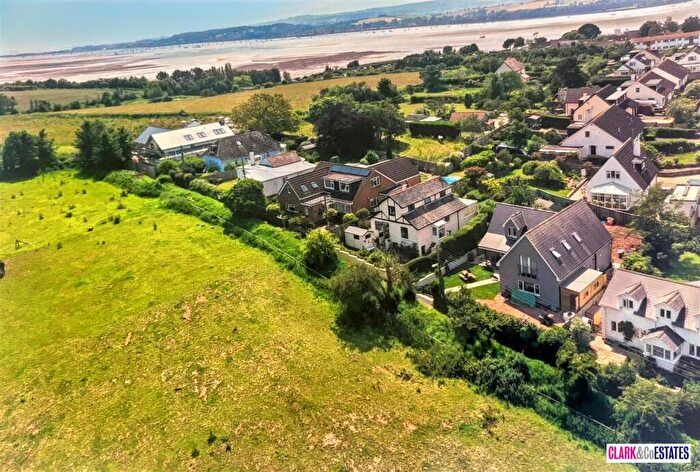
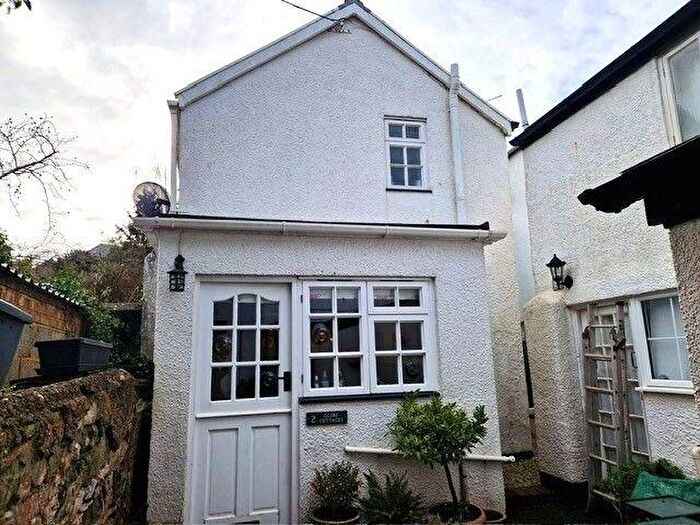
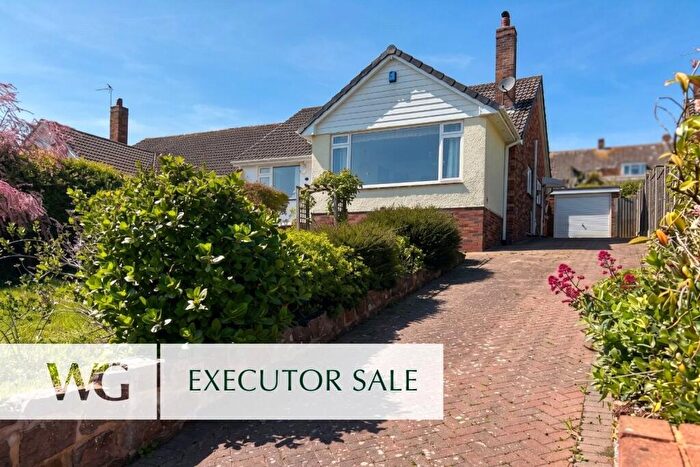
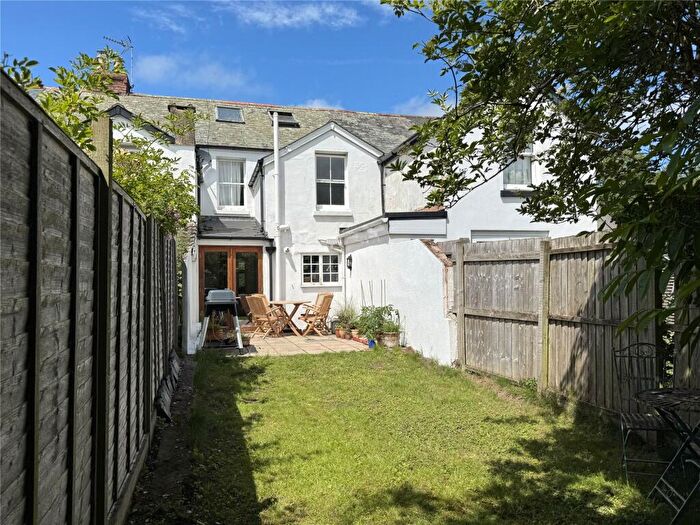
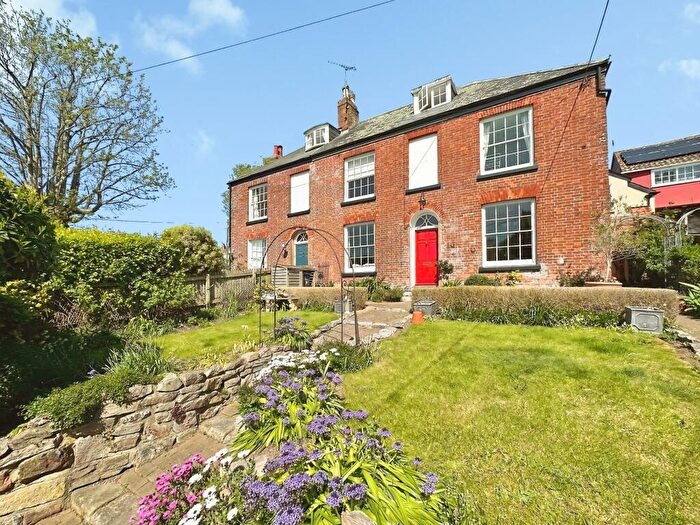
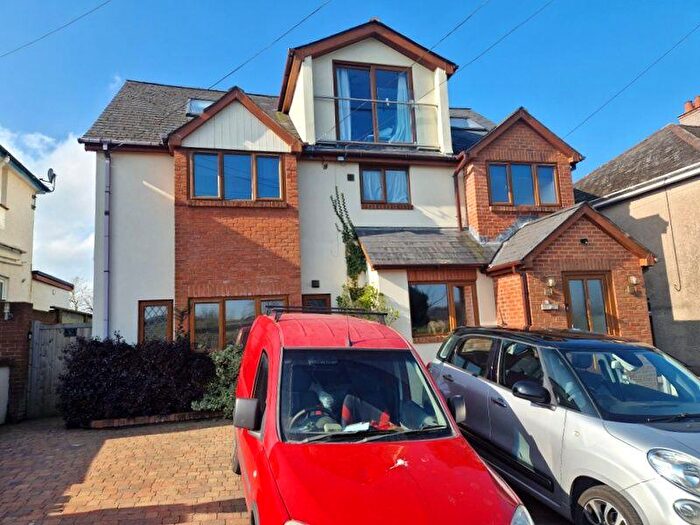
Houses for sale in Woodbury & Lympstone, Exmouth
House Prices in Woodbury & Lympstone
Properties in Woodbury & Lympstone have an average house price of £622k and had 5 Property Transactions within the last 3 years¹.
Woodbury & Lympstone is an area in Exmouth, Devon with 116 households², where the most expensive property was sold for £855k.
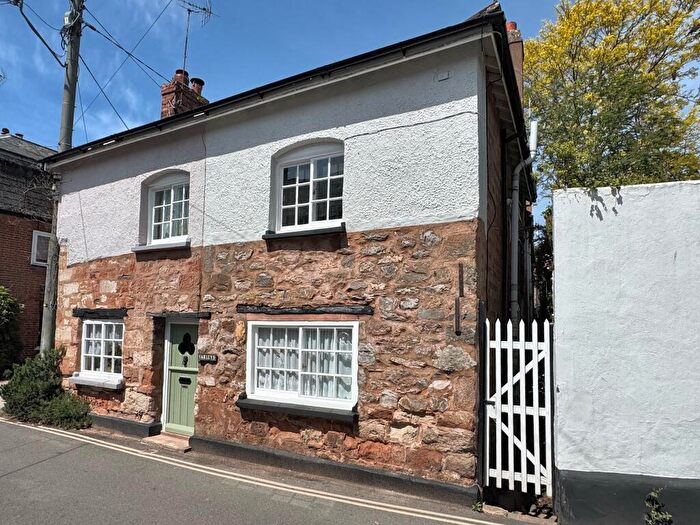
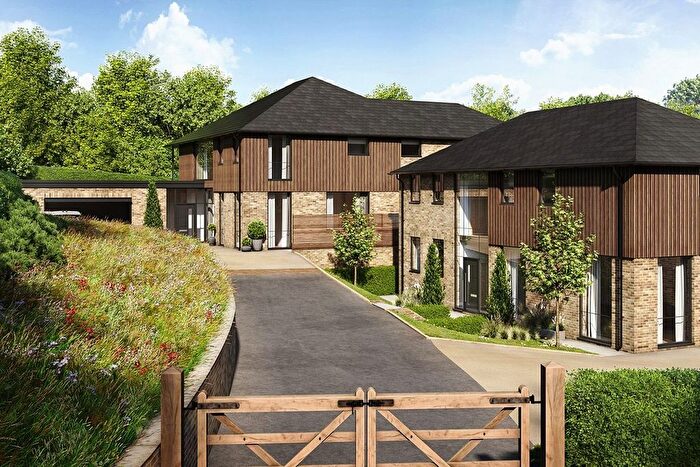
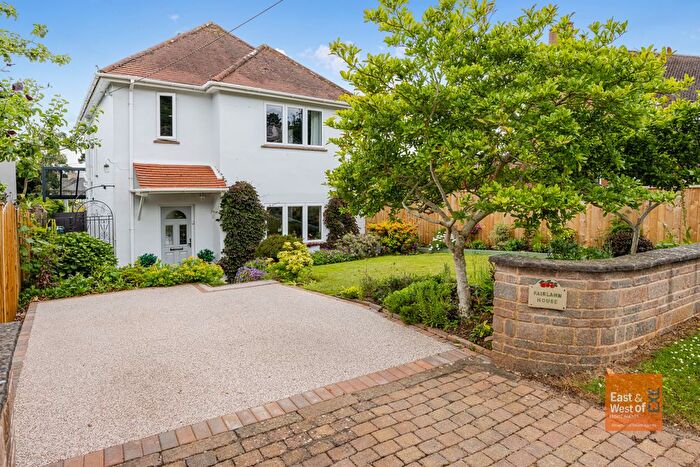
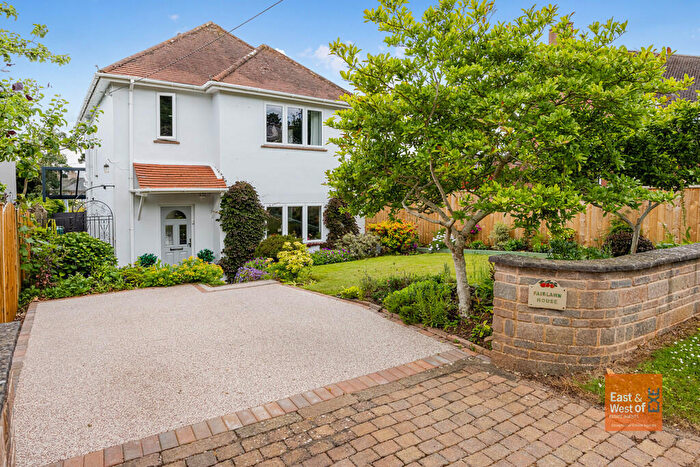
Properties for sale in Woodbury & Lympstone
![]()
If you are looking to sell your house, let it out, or receive a property valuation, an expert can help you.
Click the button below to get started.

Previously listed properties in Woodbury & Lympstone
Roads and Postcodes in Woodbury & Lympstone
Navigate through our locations to find the location of your next house in Woodbury & Lympstone, Exmouth for sale or to rent.
| Streets | Postcodes |
|---|---|
| Charles Court | EX8 5EL |
| Churchill Court | EX8 5JB |
| Edinburgh Crescent | EX8 5HT |
| Exmouth Road | EX8 5AR EX8 5AG EX8 5LS |
| Gibraltar Road | EX8 5HY |
| Gulliford Close | EX8 5DG |
| Harefield | EX8 5AT |
| Jackson Meadow | EX8 5DF |
| Meeting Lane | EX8 5HS |
| Nutwell Road | EX8 5AN EX8 5HR |
| School Hill | EX8 5JY |
| Stone Lane | EX8 5HD |
| Summer Meadow | EX8 5BQ |
| Tedstone Lane | EX8 5NA EX8 5NB |
| Trafalgar Road | EX8 5HU |
| Underhill | EX8 5HL |
| EX8 5AU EX8 5AW EX8 5RA |
Property price trends in Woodbury & Lympstone
According to the latest Land Registry data, the average home in Woodbury & Lympstone sold for £790,000 in 2025. That figure comes from 31 sales logged over the past 11 years.
Prices have continued to climb over the last three years. Compared with 2022, when the typical sale came in around £303,333, that's a rise of roughly 160.4%.
Looking back five years, average prices are up about 72.4% since 2020, a gain of around £331,667 in cash terms.
Zoom out to the past decade for the fuller picture. Back in 2015, homes here averaged £267,500, so the typical sold price has climbed about 195.3% since then, roughly 11.4% a year.
Frequently asked questions about Woodbury & Lympstone
What is the average price for a property for sale in Woodbury & Lympstone?
The average price for a property for sale in Woodbury & Lympstone is £621,500. This amount is 73% higher than the average price in Exmouth. There are 256 property listings for sale in Woodbury & Lympstone.
Which train stations are available in or near Woodbury & Lympstone?
Some of the train stations available in or near Woodbury & Lympstone are Lympstone Village, Lympstone Commando and Exton.
Property Price Paid in Woodbury & Lympstone by Year
The average sold property price by year was:
| Year | Average Sold Price | Price Change |
Sold Properties
|
|---|---|---|---|
| 2025 | £790,000 | 27% |
1 Property |
| 2023 | £579,375 | 48% |
4 Properties |
| 2022 | £303,333 | -51% |
3 Properties |
| 2020 | £458,333 | -4% |
3 Properties |
| 2019 | £474,375 | 28% |
4 Properties |
| 2017 | £343,625 | 9% |
4 Properties |
| 2016 | £313,166 | 15% |
9 Properties |
| 2015 | £267,500 | 25% |
2 Properties |
| 2014 | £200,000 | - |
1 Property |
Property Price per Property Type in Woodbury & Lympstone
Here you can find historic sold price data in order to help with your property search.
The average Property Paid Price for specific property types in the last three years are:
| Property Type | Average Sold Price | Sold Properties |
|---|---|---|
| Semi Detached House | £505,000.00 | 1 Semi Detached House |
| Terraced House | £470,000.00 | 1 Terraced House |
| Detached House | £710,833.00 | 3 Detached Houses |
