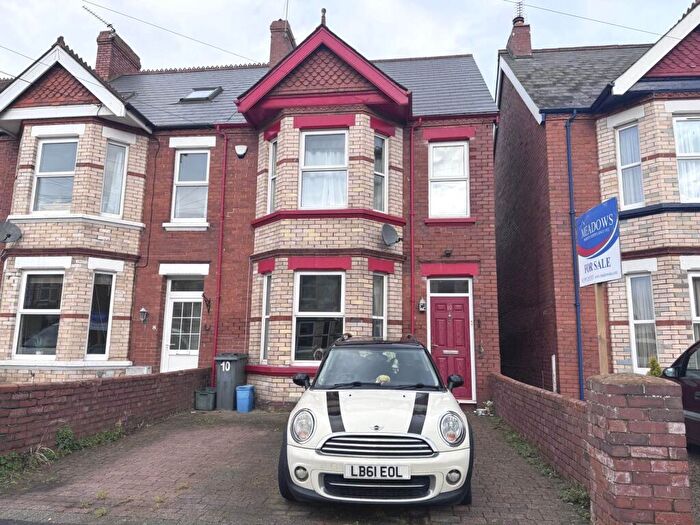
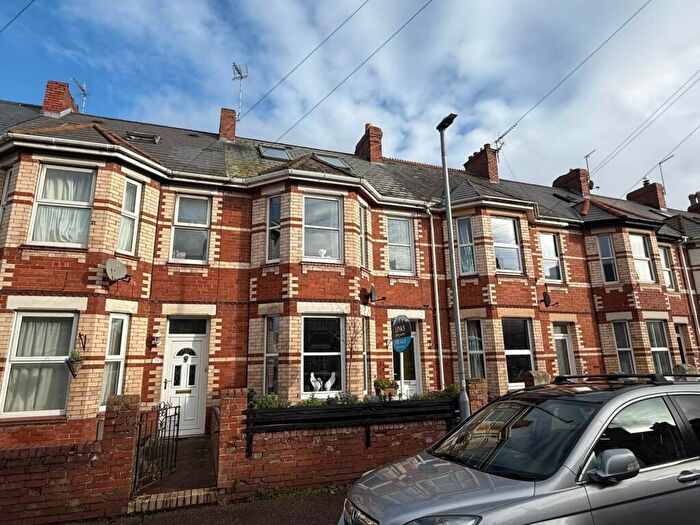
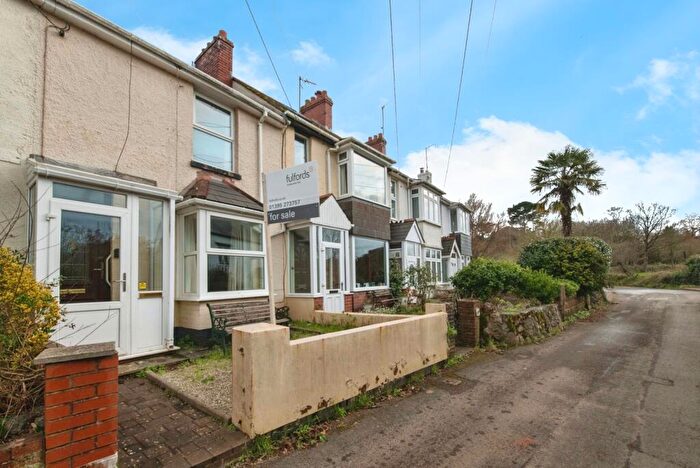
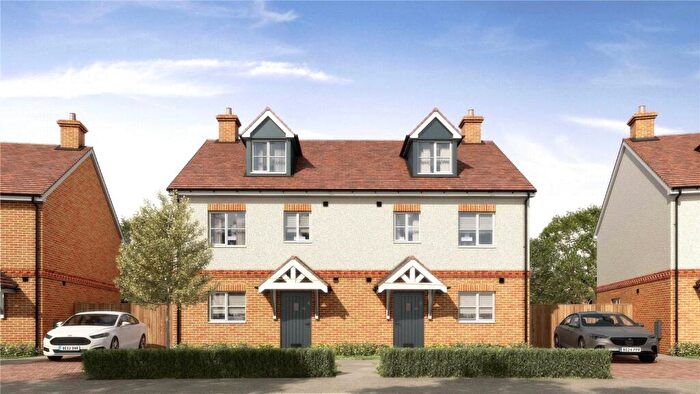
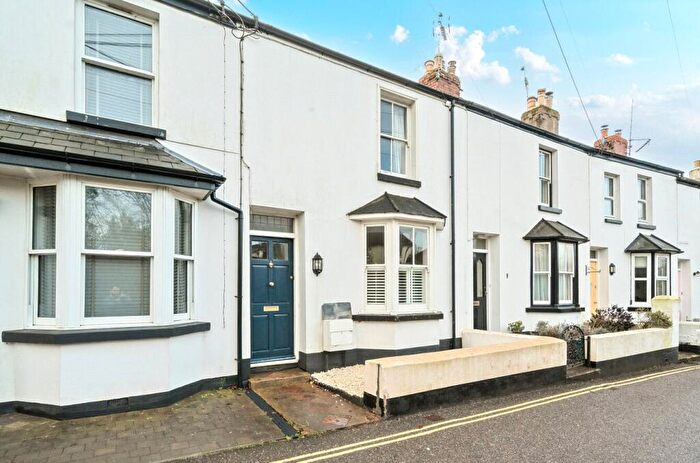
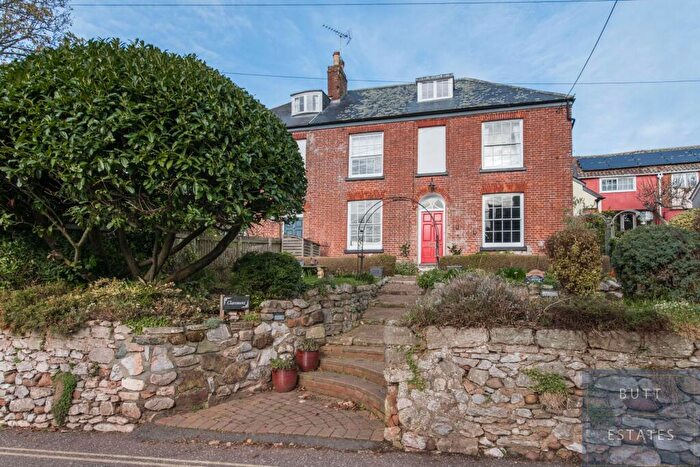
Houses for sale & to rent in Woodbury And Lympstone, Exmouth
House Prices in Woodbury And Lympstone
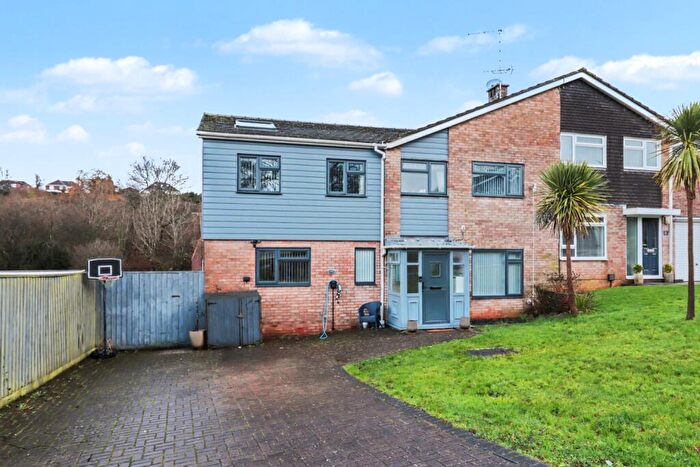
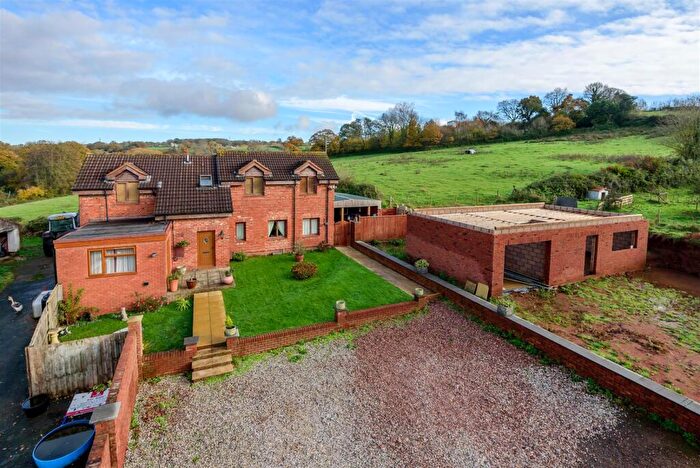
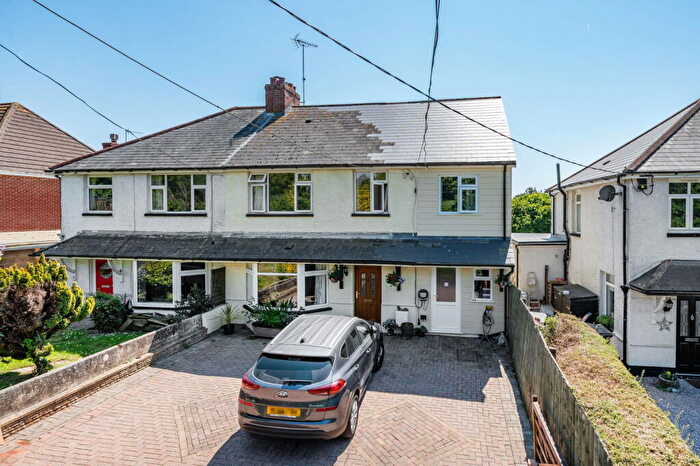
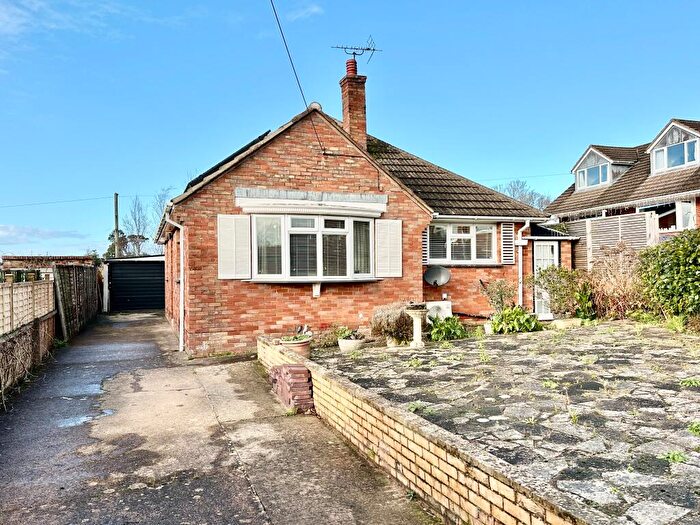
Properties in Woodbury And Lympstone have an average house price of £629,472.00 and had 56 Property Transactions within the last 3 years¹.
Woodbury And Lympstone is an area in Exmouth, Devon with 835 households², where the most expensive property was sold for £3,100,000.00.
Properties for sale in Woodbury And Lympstone
Roads and Postcodes in Woodbury And Lympstone
Navigate through our locations to find the location of your next house in Woodbury And Lympstone, Exmouth for sale or to rent.
| Streets | Postcodes |
|---|---|
| Barn Ridge | EX8 5LG |
| Birch Road | EX8 5LB |
| Bridge Cottages | EX8 5EU |
| Brookside | EX8 5JP |
| Burgmanns Hill | EX8 5HN EX8 5HP |
| Chapel Road | EX8 5ER |
| Church Path Terrace | EX8 5HJ |
| Church Road | EX8 5JT EX8 5JU EX8 5JX |
| Clay Lane | EX8 5AE |
| Courtlands Lane | EX8 3NX EX8 5AB EX8 5BG |
| Dawlish Park Terrace | EX8 5AA |
| Exe View Road | EX8 5AZ |
| Exmouth Road | EX8 5AF EX8 5AJ EX8 5AQ EX8 5LT |
| Gibraltar Road | EX8 5HZ |
| Glebe Close | EX8 5JA |
| Glebelands | EX8 5JD |
| Grange Close | EX8 5LD |
| Greenhill Avenue | EX8 5HW |
| Harefield Cottages | EX8 5EX |
| Harefield Drive | EX8 5TT |
| Highcliffe Close | EX8 5HF |
| Highcliffe Court | EX8 5HG |
| Hulham Road | EX8 5BA EX8 5DX EX8 5DZ |
| Hunton Close | EX8 5JG |
| Jackson Meadow | EX8 5GZ |
| Jubilee Grove | EX8 5LU |
| Longbrook Lane | EX8 5BE |
| Longmeadow Road | EX8 5LE EX8 5LF EX8 5LL EX8 5LP EX8 5LW |
| Malt Field | EX8 5ND |
| Marley Drive | EX8 5DY |
| Marley Hayes | EX8 5DH |
| Meadow Close | EX8 5LQ |
| Meadow View | EX8 5LH |
| Meeting Lane | EX8 5JJ |
| Nutwell Cottages | EX8 5AP |
| Olga Terrace | EX8 5LR |
| Orchard Close | EX8 5LA |
| Park View | EX8 5LY |
| Pink House Corner | EX8 5AH |
| Porters Lane | EX8 5AL |
| Quay Lane | EX8 5HA |
| South Terrace | EX8 5LN |
| Sowden Lane | EX8 5AD EX8 5HB EX8 5HE |
| Strawberry Hill | EX8 5JZ |
| Tedstone Lane | EX8 5AX |
| The Strand | EX8 5ES EX8 5ET EX8 5EY EX8 5EZ EX8 5JR EX8 5JS EX8 5JW |
| Trafalgar Road | EX8 5HX |
| Underhill | EX8 5HH EX8 5HQ |
| Underhill Close | EX8 5JE |
| Underhill Crescent | EX8 5JF |
| Westview Terrace | EX8 5LJ |
| Withalls Gardens | EX8 5JH |
| Wotton Lane | EX8 5AY EX8 5LZ |
| EX8 5LX |
Transport near Woodbury And Lympstone
-
Lympstone Village Station
-
Lympstone Commando Station
-
Exton Station
-
Starcross Station
-
Exmouth Station
- FAQ
- Price Paid By Year
- Property Type Price
Frequently asked questions about Woodbury And Lympstone
What is the average price for a property for sale in Woodbury And Lympstone?
The average price for a property for sale in Woodbury And Lympstone is £629,472. This amount is 75% higher than the average price in Exmouth. There are 1,452 property listings for sale in Woodbury And Lympstone.
What streets have the most expensive properties for sale in Woodbury And Lympstone?
The streets with the most expensive properties for sale in Woodbury And Lympstone are Strawberry Hill at an average of £912,500, Malt Field at an average of £880,000 and Harefield Cottages at an average of £825,000.
What streets have the most affordable properties for sale in Woodbury And Lympstone?
The streets with the most affordable properties for sale in Woodbury And Lympstone are Jackson Meadow at an average of £198,750, Gibraltar Road at an average of £235,000 and Glebe Close at an average of £293,250.
Which train stations are available in or near Woodbury And Lympstone?
Some of the train stations available in or near Woodbury And Lympstone are Lympstone Village, Lympstone Commando and Exton.
Property Price Paid in Woodbury And Lympstone by Year
The average sold property price by year was:
| Year | Average Sold Price | Price Change |
Sold Properties
|
|---|---|---|---|
| 2025 | £509,000 | -2% |
10 Properties |
| 2024 | £519,625 | -46% |
20 Properties |
| 2023 | £760,305 | 9% |
26 Properties |
| 2022 | £688,625 | 29% |
32 Properties |
| 2021 | £488,563 | -4% |
34 Properties |
| 2020 | £507,875 | 23% |
39 Properties |
| 2019 | £393,253 | -23% |
29 Properties |
| 2018 | £484,167 | 27% |
37 Properties |
| 2017 | £351,648 | -18% |
27 Properties |
| 2016 | £413,983 | -11% |
30 Properties |
| 2015 | £458,565 | 22% |
38 Properties |
| 2014 | £357,919 | 7% |
38 Properties |
| 2013 | £334,081 | -8% |
35 Properties |
| 2012 | £362,227 | -5% |
44 Properties |
| 2011 | £381,210 | 8% |
31 Properties |
| 2010 | £349,987 | 7% |
20 Properties |
| 2009 | £326,140 | 12% |
25 Properties |
| 2008 | £286,959 | -13% |
52 Properties |
| 2007 | £323,526 | -3% |
39 Properties |
| 2006 | £333,835 | 21% |
30 Properties |
| 2005 | £263,346 | -7% |
30 Properties |
| 2004 | £281,274 | -6% |
39 Properties |
| 2003 | £299,510 | 24% |
38 Properties |
| 2002 | £227,167 | 31% |
54 Properties |
| 2001 | £157,424 | 1% |
40 Properties |
| 2000 | £155,740 | 20% |
35 Properties |
| 1999 | £124,330 | 23% |
30 Properties |
| 1998 | £95,315 | -2% |
44 Properties |
| 1997 | £96,796 | -3% |
27 Properties |
| 1996 | £99,310 | 7% |
32 Properties |
| 1995 | £92,166 | - |
24 Properties |
Property Price per Property Type in Woodbury And Lympstone
Here you can find historic sold price data in order to help with your property search.
The average Property Paid Price for specific property types in the last three years are:
| Property Type | Average Sold Price | Sold Properties |
|---|---|---|
| Semi Detached House | £406,363.00 | 11 Semi Detached Houses |
| Detached House | £911,062.00 | 23 Detached Houses |
| Terraced House | £459,095.00 | 21 Terraced Houses |
| Flat | £185,000.00 | 1 Flat |

