
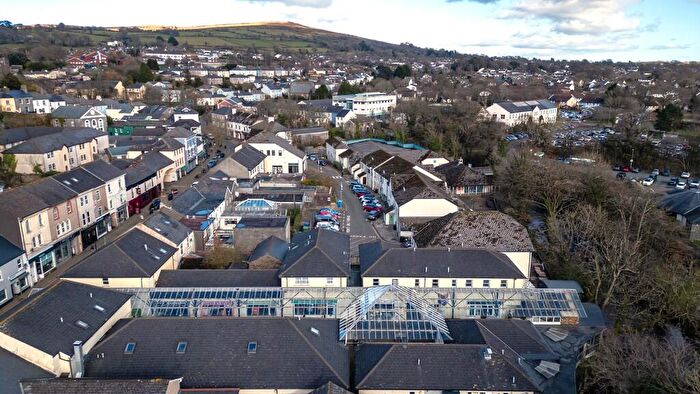
Houses for sale in PL21 9DT, Belmont Road, Ivybridge Central, Ivybridge
House Prices in PL21 9DT, Belmont Road, Ivybridge Central
Properties in PL21 9DT have an average house price of £270k and had 1 Property Transaction within the last 3 years.¹ PL21 9DT is a postcode in Belmont Road located in Ivybridge Central, an area in Ivybridge, Devon, with 3 households², where the most expensive property was sold for £270k.
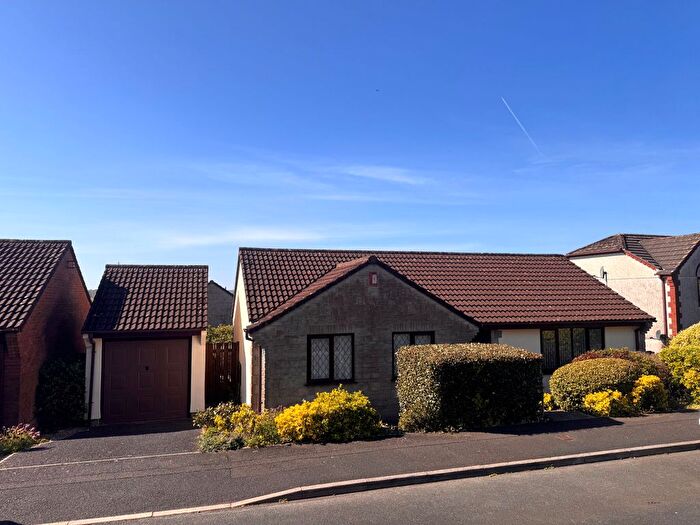
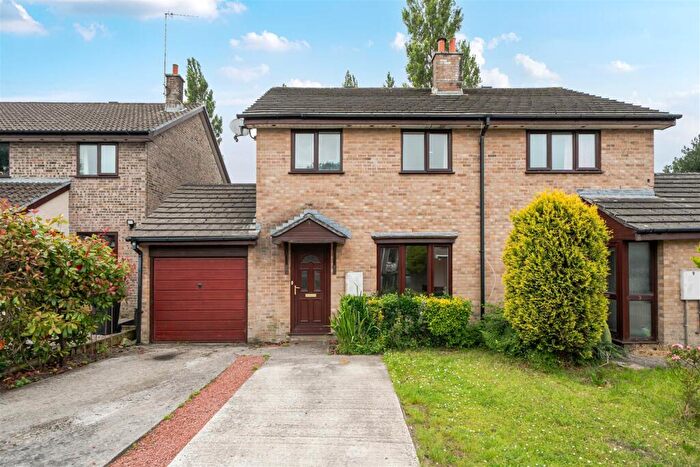
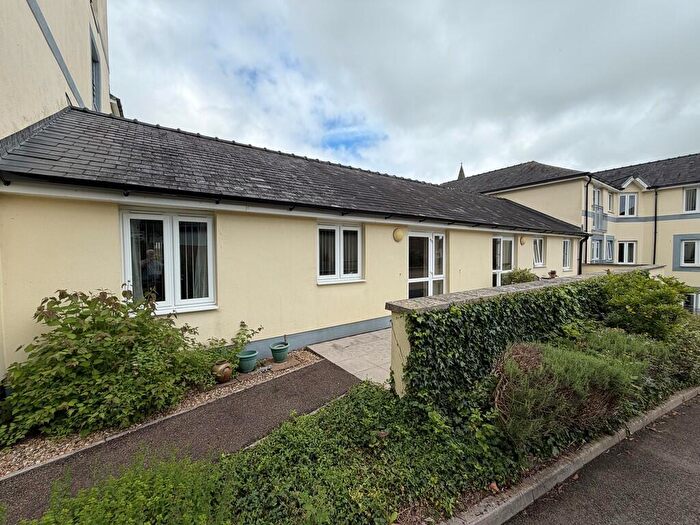
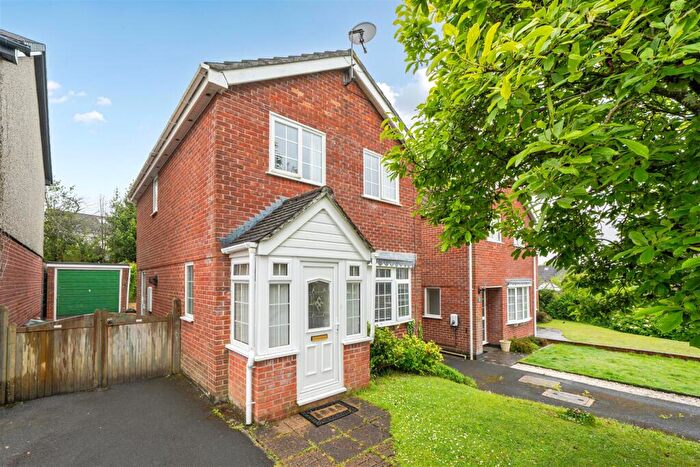
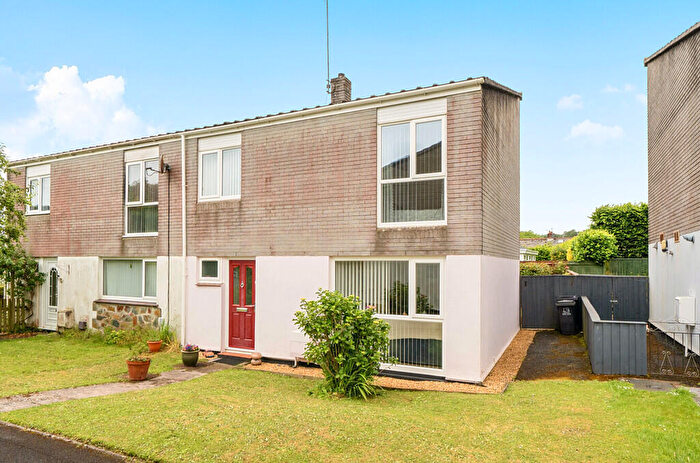
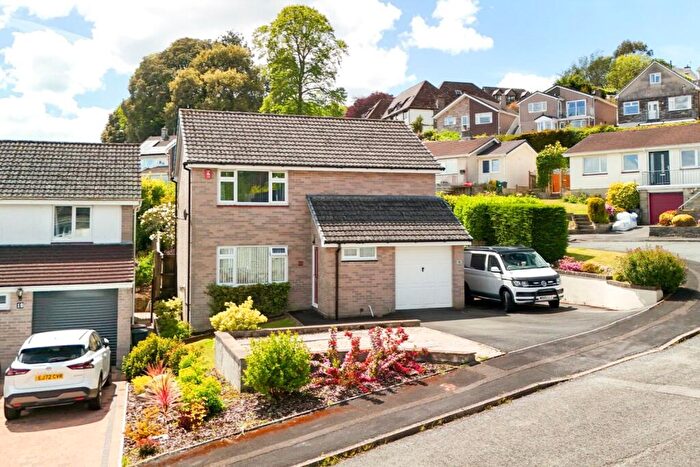
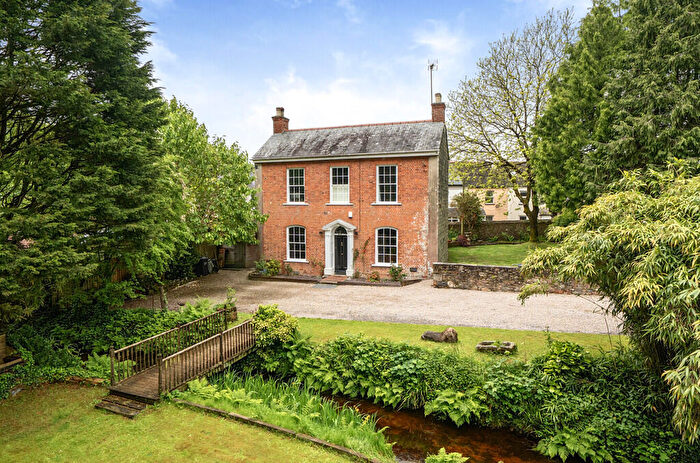
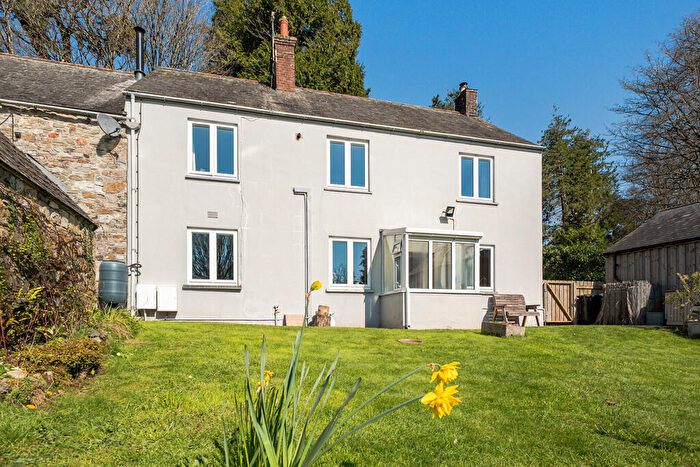
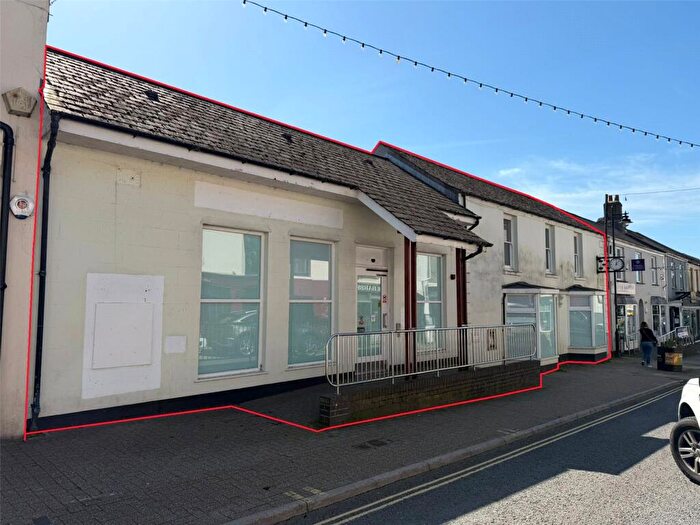
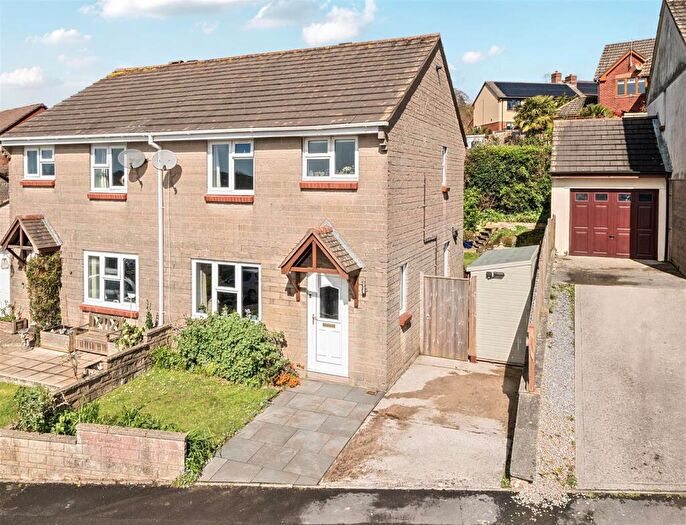
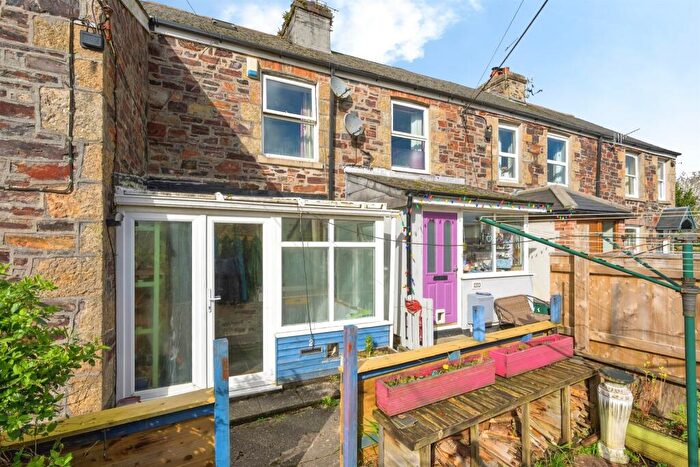
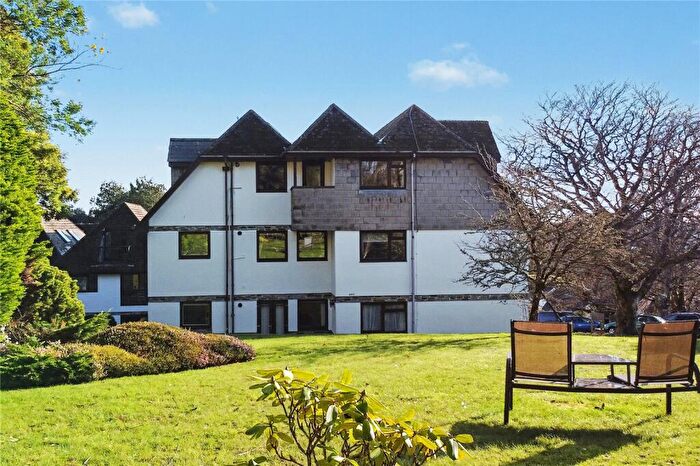
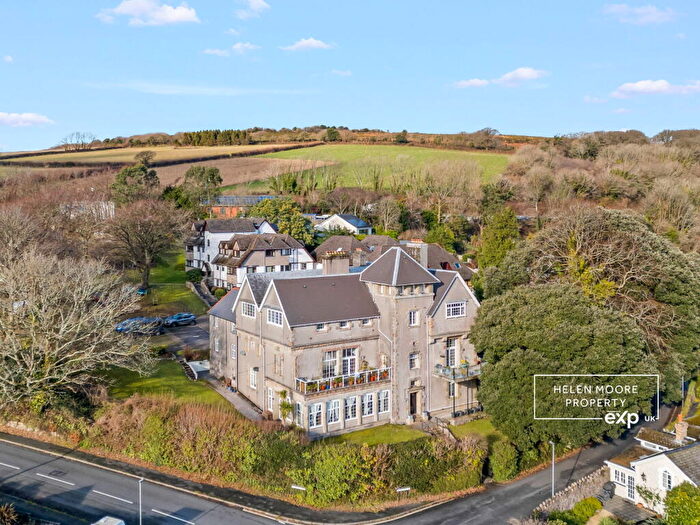
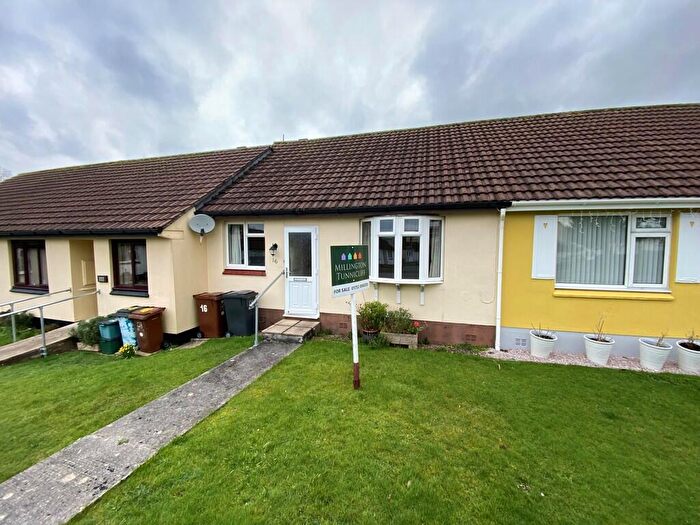
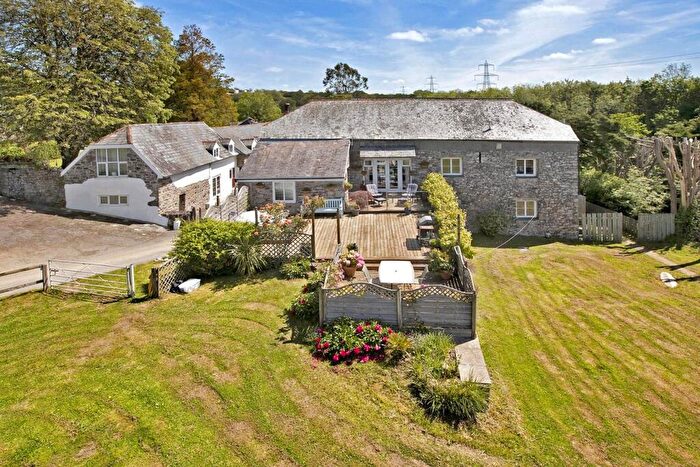
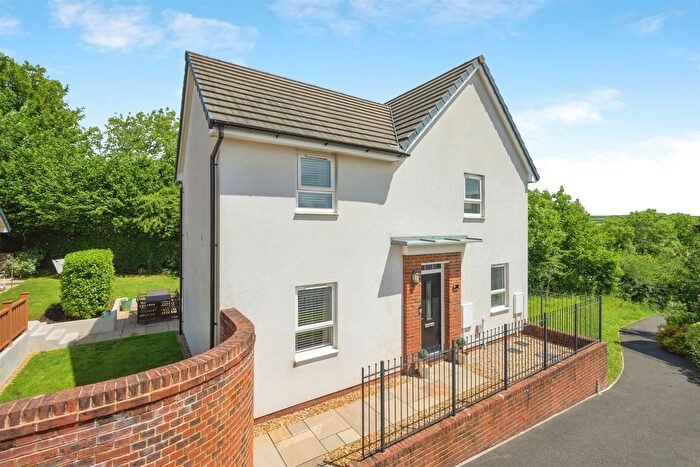
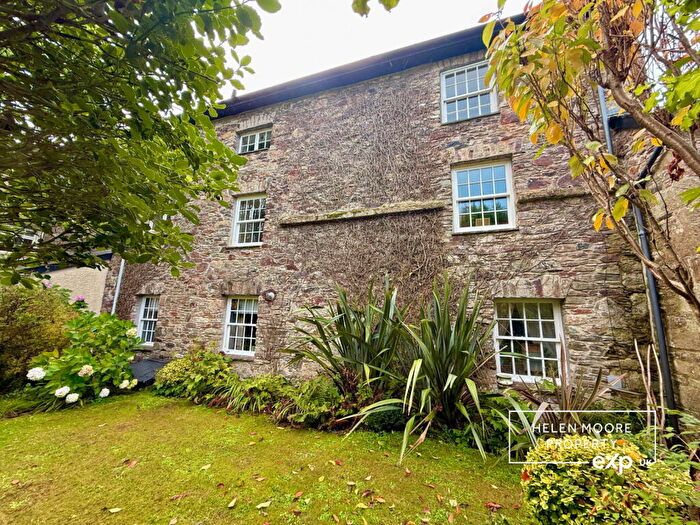
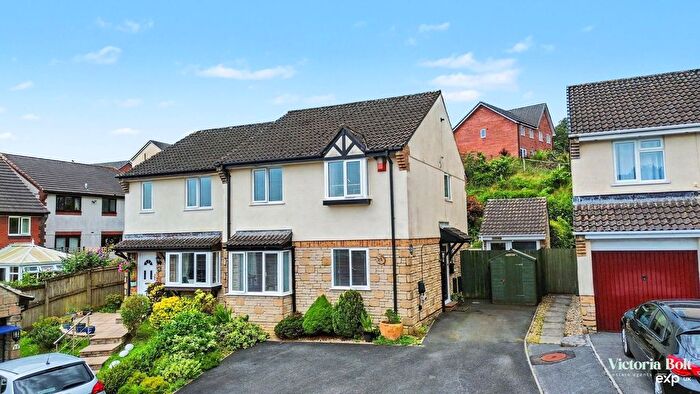
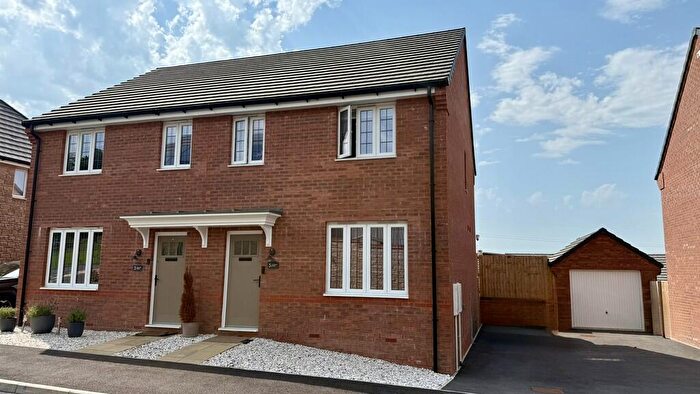
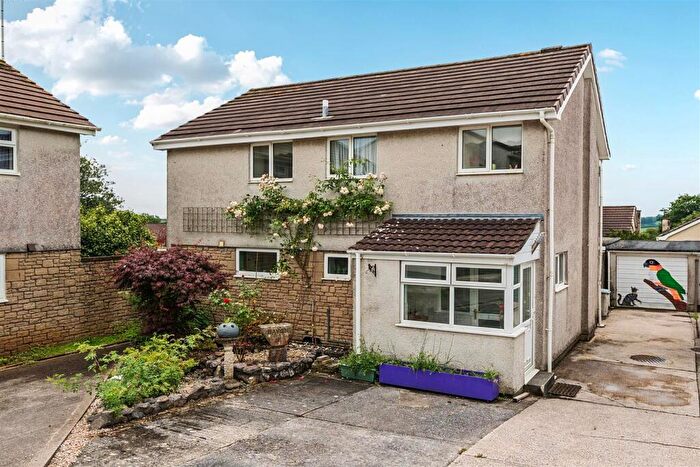
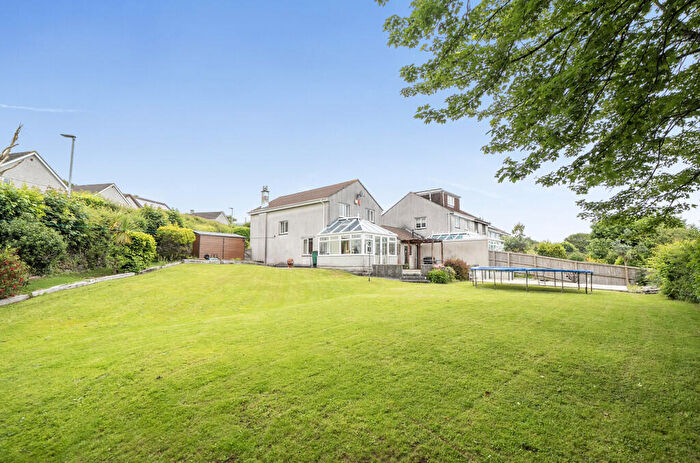
Properties for sale near PL21 9DT, Belmont Road

![]()
If you are looking to sell your house, let it out, or receive a property valuation, an expert can help you.
Click the button below to get started.
Price Paid in Belmont Road, PL21 9DT, Ivybridge Central
WESTHAVEN 2 Belmont Road, PL21 9DT, Ivybridge Central Ivybridge
Property WESTHAVEN 2 has been sold 6 times. The last time it was sold was in 05/06/2025 and the sold price was £270,000.00.
This is a Terraced House which was sold as a freehold in 05/06/2025
| Date | Price | Property Type | Tenure | Classification |
|---|---|---|---|---|
| 05/06/2025 | £270,000.00 | Terraced House | freehold | Established Building |
| 14/12/2021 | £263,000.00 | Terraced House | freehold | Established Building |
| 03/02/2017 | £210,000.00 | Terraced House | freehold | Established Building |
| 24/10/2006 | £180,000.00 | Terraced House | freehold | Established Building |
| 05/02/1998 | £55,000.00 | Terraced House | freehold | Established Building |
| 19/07/1996 | £51,000.00 | Terraced House | freehold | Established Building |
2 Westhaven Belmont Road, PL21 9DT, Ivybridge Central Ivybridge
This is a 85 square meter Semi-detached House with an EPC rating of D. Currently, there is no transaction history available for this property.
Postcodes in Belmont Road, Ivybridge Central
Navigate through other locations in Belmont Road, Ivybridge Central, Ivybridge to see more property listings for sale or to rent.
Property price trends in PL21 9DT, Belmont Road
According to the latest Land Registry data, the average home in PL21 9DT, Belmont Road sold for £270,000 in 2025. That figure comes from 6 sales logged over the past 29 years.
Prices have moved up over the last three years. Compared with 2021, when the typical sale came in around £263,000, that's a rise of roughly 2.7%.
Looking back five years, average prices are up about 2.7% since 2021, a gain of around £7,000 in cash terms.
Zoom out to the past decade for the fuller picture. Back in 2017, homes here averaged £210,000, so the typical sold price has climbed about 28.6% since then, roughly 3.2% a year.
Property Price Paid in PL21 9DT, Belmont Road by Year
The average sold property price by year was:
| Year | Average Sold Price | Price Change |
Sold Properties
|
|---|---|---|---|
| 2025 | £270,000 | 3% |
1 Property |
| 2021 | £263,000 | 20% |
1 Property |
| 2017 | £210,000 | 14% |
1 Property |
| 2006 | £180,000 | 69% |
1 Property |
| 1998 | £55,000 | 7% |
1 Property |
| 1996 | £51,000 | - |
1 Property |
Property Price per Property Type in PL21 9DT, Belmont Road
Here you can find historic sold price data in order to help with your property search.
The average Property Paid Price for specific property types in the last three years are:
| Property Type | Average Sold Price | Sold Properties |
|---|---|---|
| Terraced House | £270,000.00 | 1 Terraced House |
