
Houses for sale in TQ7 4PR, Charterlands, Kingsbridge
House Prices in TQ7 4PR, Charterlands
Properties in TQ7 4PR have no sales history available within the last 3 years. TQ7 4PR is a postcode in Charterlands, an area in Kingsbridge, Devon, with 2 households².
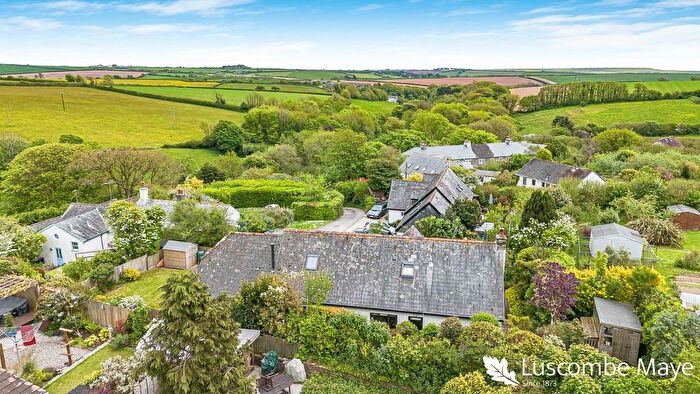
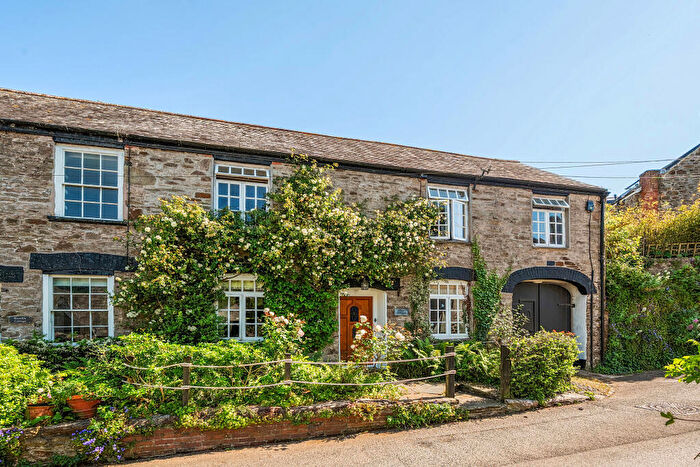
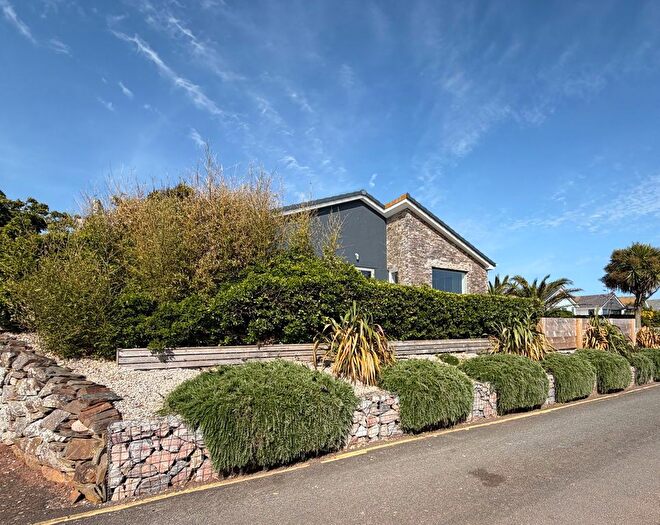
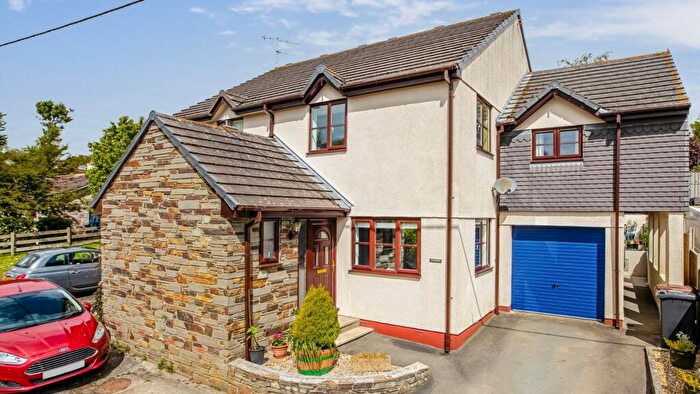
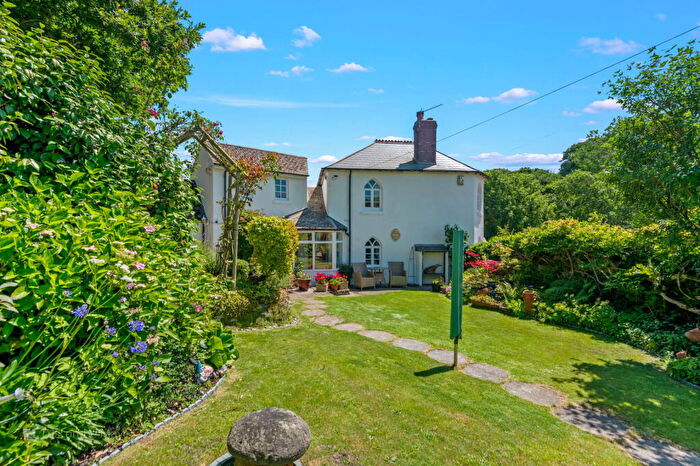
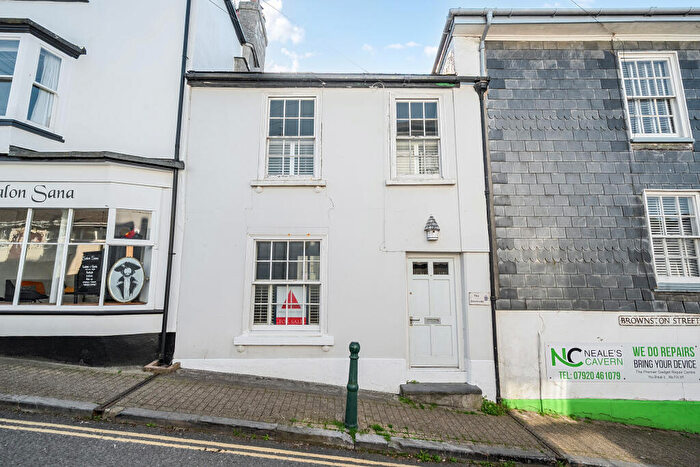
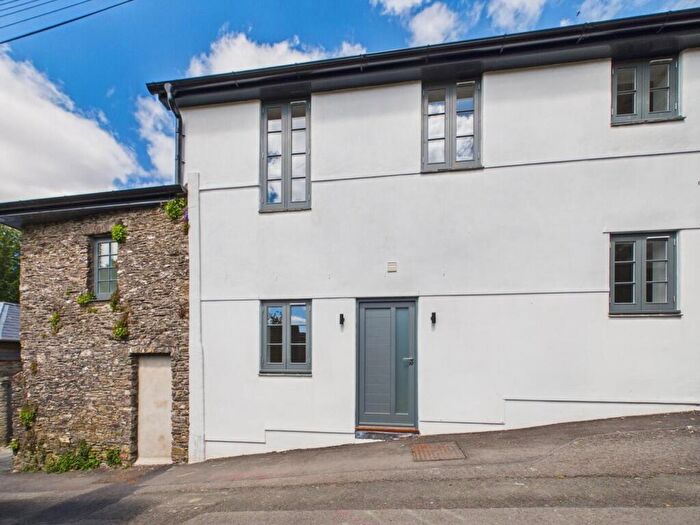
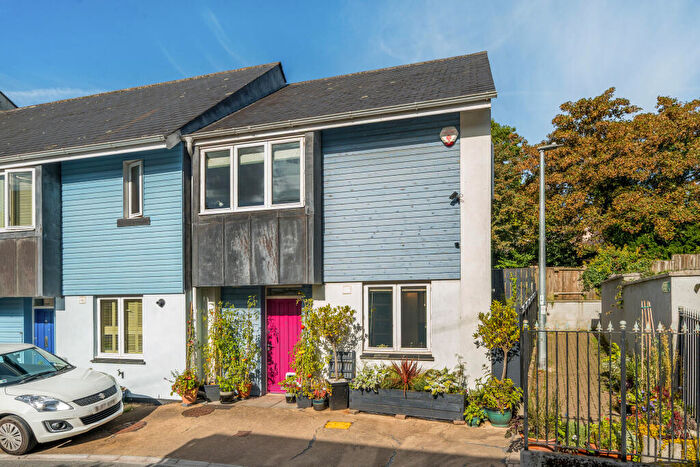
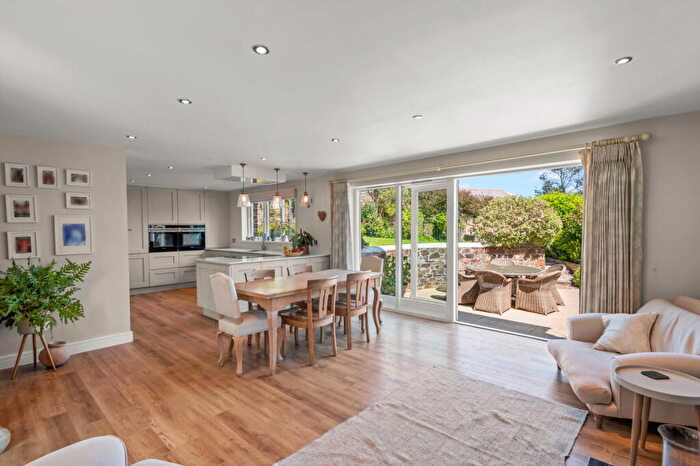
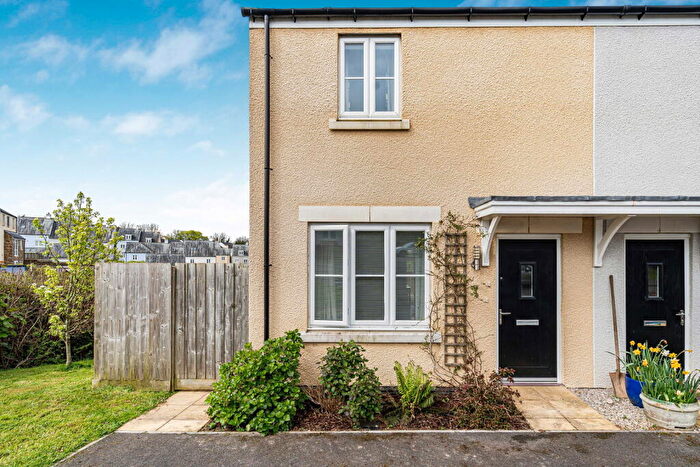
Properties for sale near TQ7 4PR
![]()
If you are looking to sell your house, let it out, or receive a property valuation, an expert can help you.
Click the button below to get started.
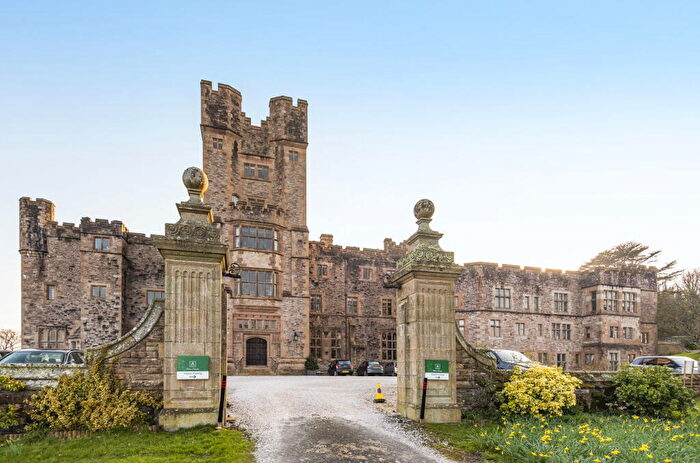
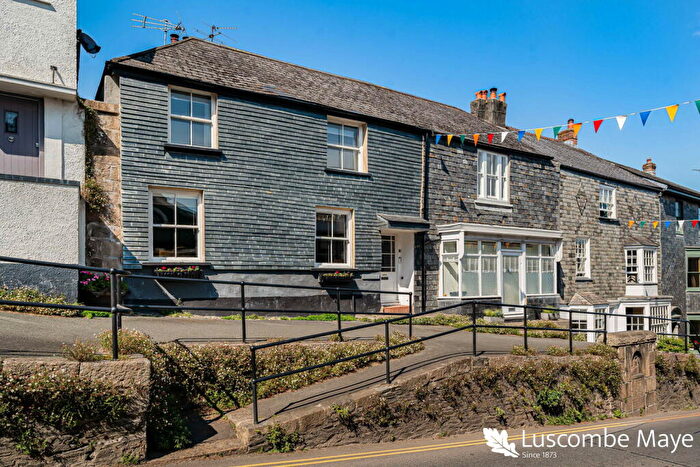
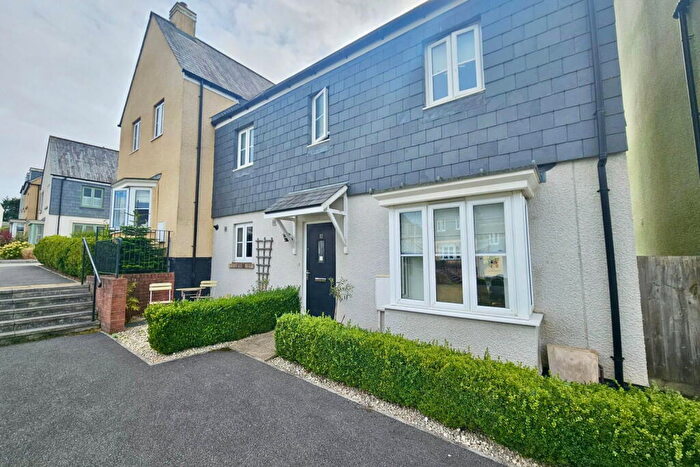
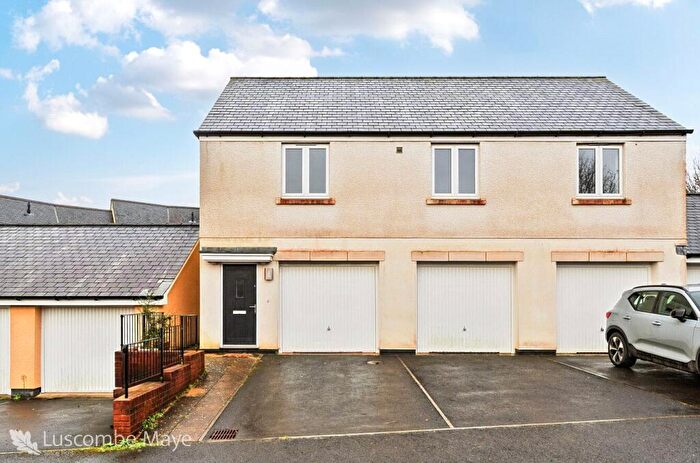
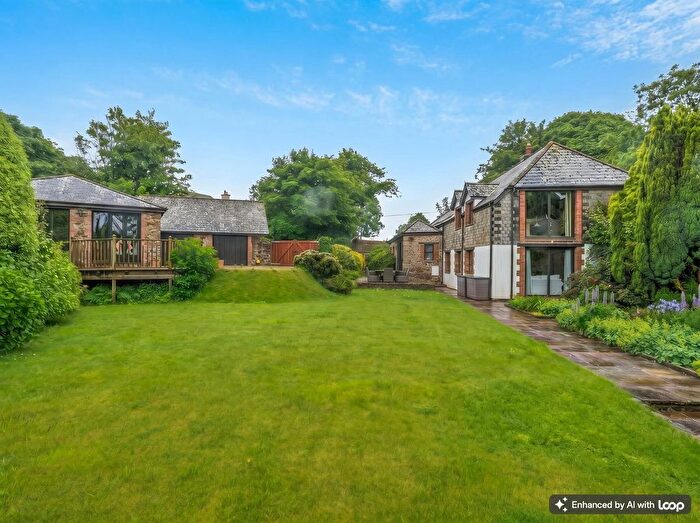
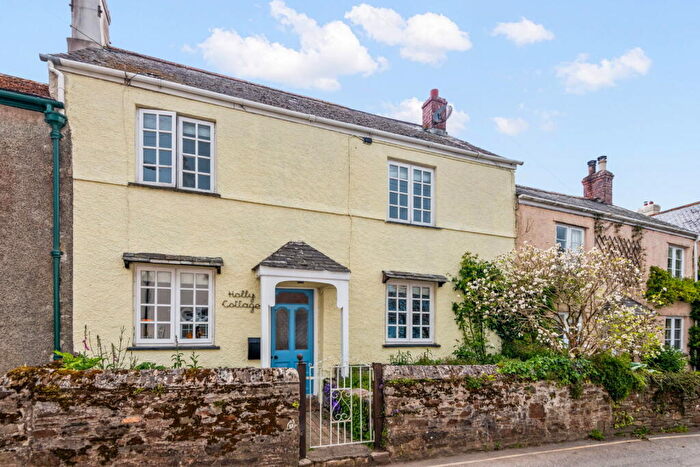
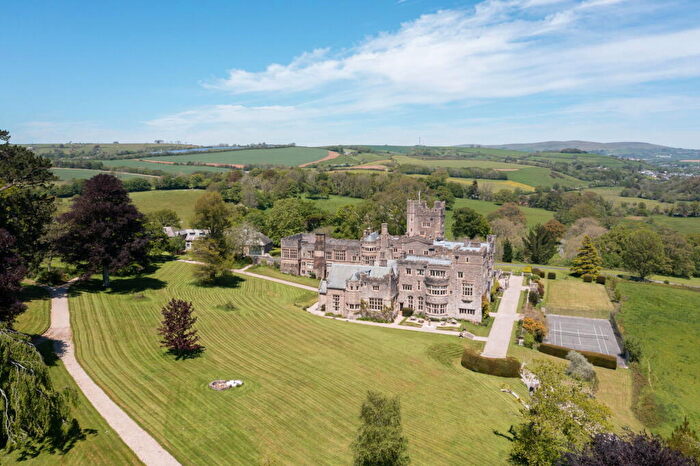
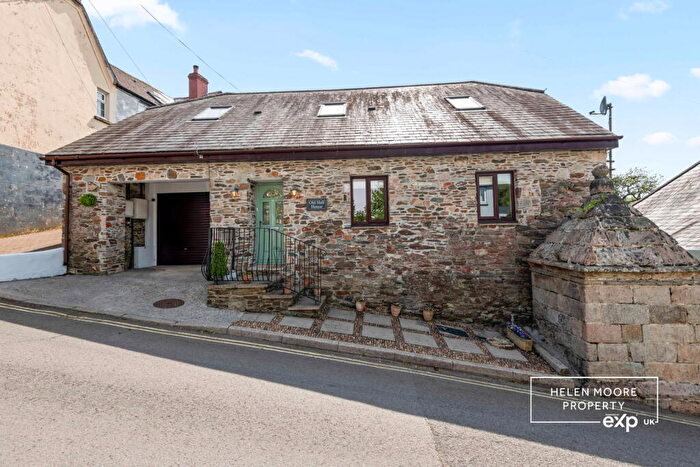
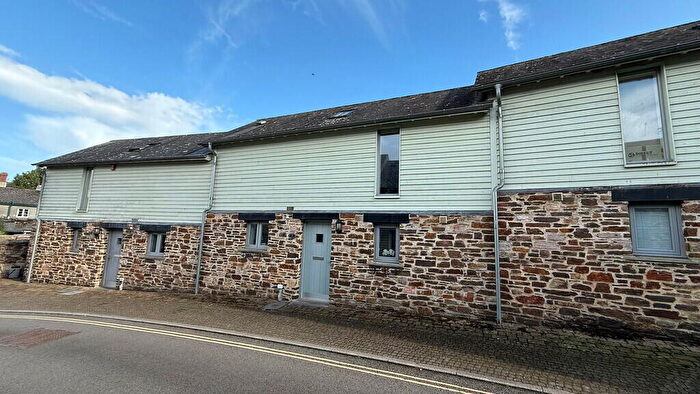
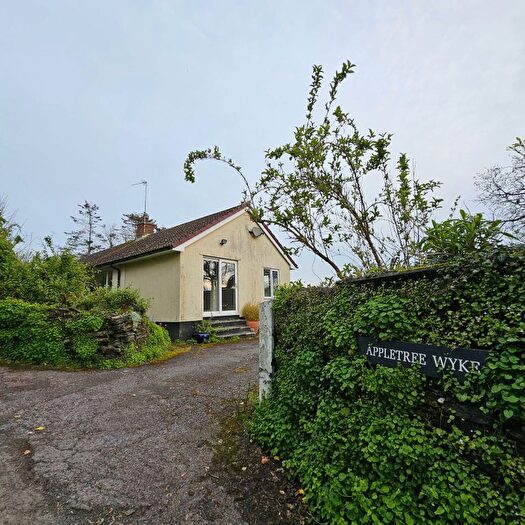
Previously listed properties near TQ7 4PR
![]()
If you are looking to sell your house, let it out, or receive a property valuation, an expert can help you.
Click the button below to get started.
Price Paid in TQ7 4PR, Charterlands
QUINCE COTTAGE TQ7 4PR, Charterlands Kingsbridge
Property QUINCE COTTAGE has been sold 1 time. The last time it was sold was in 23/11/2022 and the sold price was £590,000.00.
This detached house, sold as a freehold on 23/11/2022, is a 113 sqm detached house with an EPC rating of F.
| Date | Price | Property Type | Tenure | Classification |
|---|---|---|---|---|
| 23/11/2022 | £590,000.00 | Detached House | freehold | Established Building |
BRITANNIA COTTAGE TQ7 4PR, Charterlands Kingsbridge
Property BRITANNIA COTTAGE has been sold 2 times. The last time it was sold was in 12/04/2018 and the sold price was £470,000.00.
This terraced house, sold as a freehold on 12/04/2018, is a 85 sqm detached house with an EPC rating of G.
| Date | Price | Property Type | Tenure | Classification |
|---|---|---|---|---|
| 12/04/2018 | £470,000.00 | Terraced House | freehold | Established Building |
| 24/05/2013 | £355,000.00 | Terraced House | freehold | Established Building |
Property price trends in TQ7 4PR
According to the latest Land Registry data, the average home in TQ7 4PR sold for £590,000 in 2022. That figure comes from 3 sales logged over the past 9 years.
Prices have continued to climb over the last three years. Compared with 2018, when the typical sale came in around £470,000, that's a rise of roughly 25.5%.
Looking back five years, average prices are up about 25.5% since 2018, a gain of around £120,000 in cash terms.
Zoom out to the past decade for the fuller picture. Back in 2013, homes here averaged £355,000, so the typical sold price has climbed about 66.2% since then, roughly 5.8% a year.
Property Price Paid in TQ7 4PR by Year
The average sold property price by year was:
| Year | Average Sold Price | Price Change |
Sold Properties
|
|---|---|---|---|
| 2022 | £590,000 | 20% |
1 Property |
| 2018 | £470,000 | 24% |
1 Property |
| 2013 | £355,000 | - |
1 Property |
