
Properties for sale in TQ
Torquay
- Info
- Price Paid By Year
- Property Type Price
House Prices in TQ
Properties in TQ have an average house price of £340,758 and had 16391 Property Transactions within the last 3 years.
The most expensive property was sold for £5,250,000.
Property Price Paid in TQ by Year
The average sold property price by year was:
| Year | Average Sold Price | Sold Properties |
|---|---|---|
| 2026 | £306,632.00 | 2,311 Properties |
| 2025 | £339,033.00 | 4,954 Properties |
| 2024 | £345,326.00 | 4,746 Properties |
| 2023 | £355,766.00 | 4,380 Properties |
| 2022 | £359,853.00 | 5,725 Properties |
| 2021 | £328,049.00 | 7,709 Properties |
| 2020 | £306,792.00 | 5,245 Properties |
| 2019 | £274,614.00 | 5,996 Properties |
| 2018 | £271,492.00 | 6,208 Properties |
| 2017 | £263,560.00 | 6,782 Properties |
| 2016 | £252,922.00 | 6,672 Properties |
| 2015 | £243,499.00 | 6,633 Properties |
| 2014 | £236,530.00 | 6,194 Properties |
| 2013 | £227,206.00 | 5,334 Properties |
| 2012 | £223,846.00 | 4,520 Properties |
| 2011 | £223,839.00 | 4,294 Properties |
| 2010 | £236,105.00 | 4,471 Properties |
| 2009 | £217,497.00 | 4,418 Properties |
| 2008 | £229,545.00 | 3,838 Properties |
| 2007 | £236,178.00 | 7,436 Properties |
| 2006 | £215,306.00 | 7,883 Properties |
| 2005 | £207,598.00 | 6,056 Properties |
| 2004 | £192,397.00 | 7,584 Properties |
| 2003 | £165,178.00 | 7,900 Properties |
| 2002 | £138,113.00 | 8,881 Properties |
| 2001 | £112,564.00 | 8,588 Properties |
| 2000 | £98,376.00 | 8,240 Properties |
| 1999 | £86,358.00 | 8,734 Properties |
| 1998 | £76,737.00 | 7,570 Properties |
| 1997 | £72,212.00 | 7,792 Properties |
| 1996 | £66,311.00 | 6,616 Properties |
| 1995 | £66,060.00 | 5,171 Properties |
Property Price per Property Type in TQ
Here you can find historic sold price data in order to help with your property search.
The average Property Paid Price for specific property types in the last three years are:
| Property Type | Average Sold Price | Sold Properties |
|---|---|---|
| Detached House | £530,445.00 | 4,741 Detached Houses |
| Flat | £202,313.00 | 3,334 Flats |
| Semi Detached House | £320,631.00 | 3,463 Semi Detached Houses |
| Terraced House | £264,924.00 | 4,853 Terraced Houses |
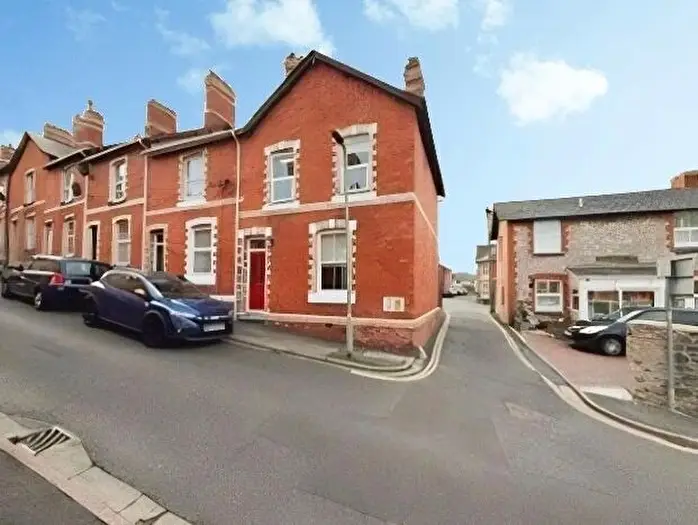
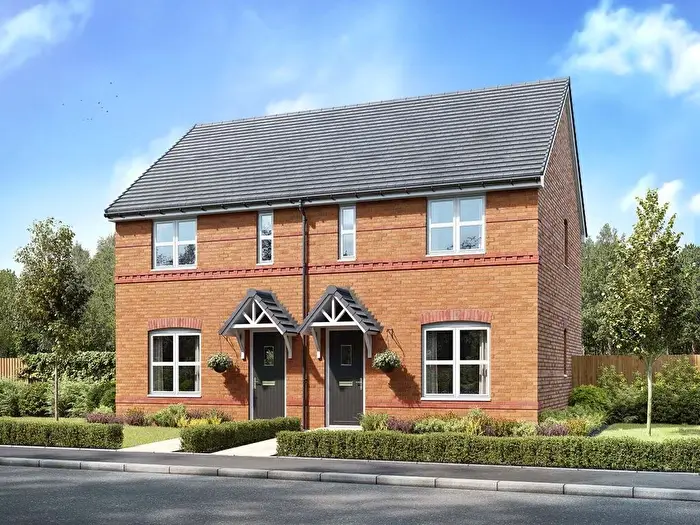
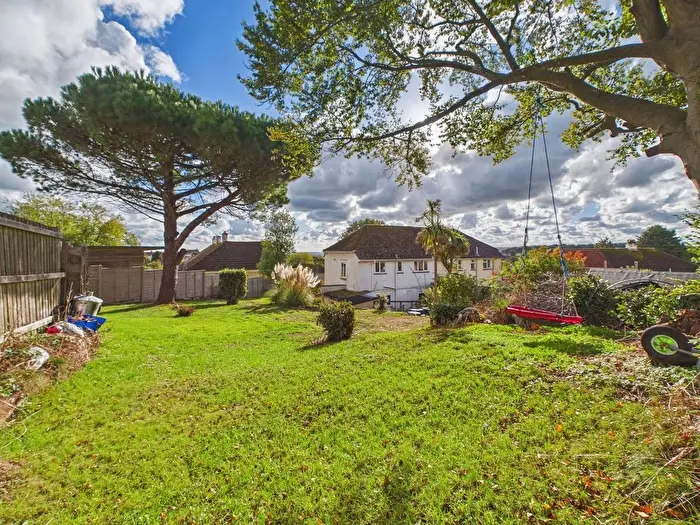
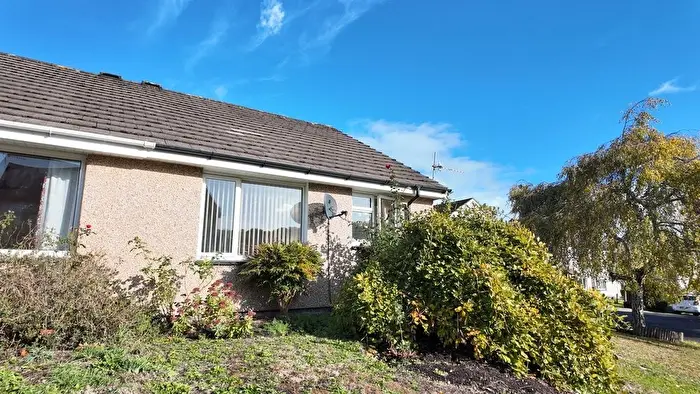
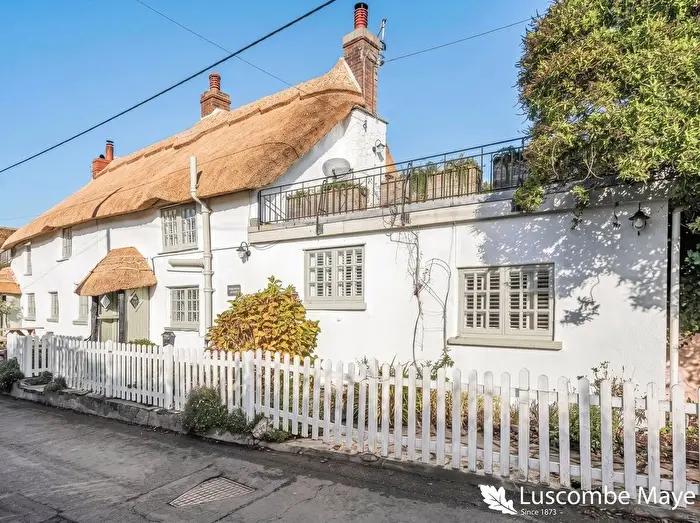
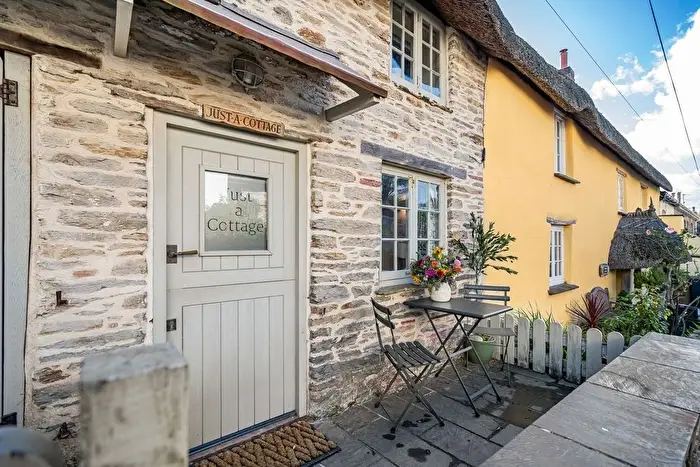
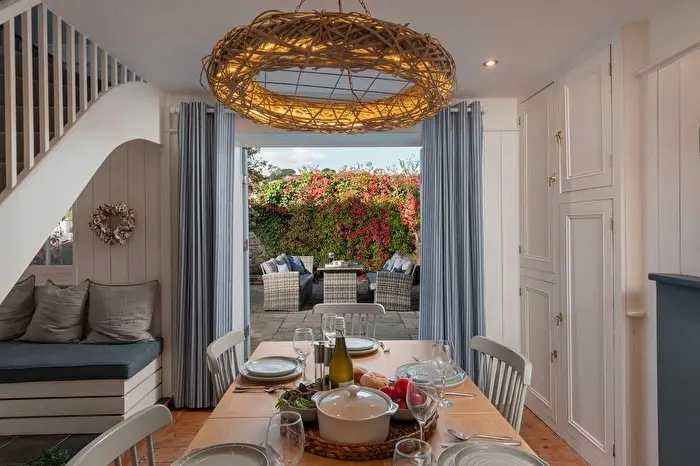
Houses and Flats for sale in TQ, Torquay

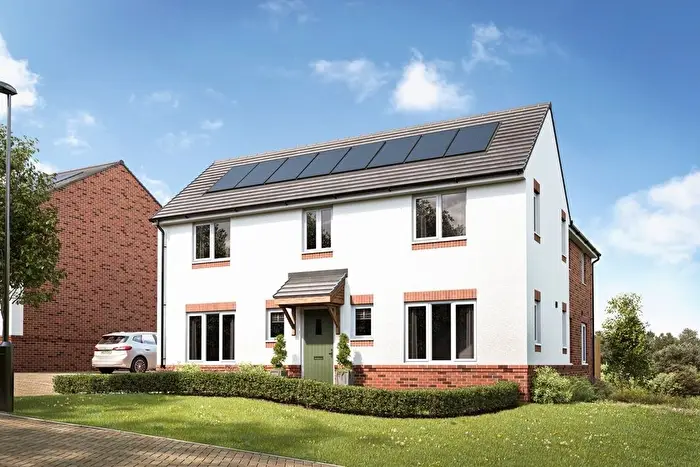
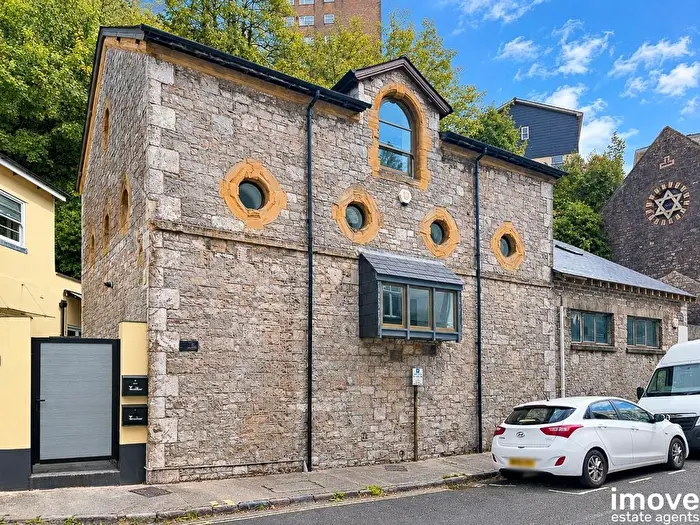
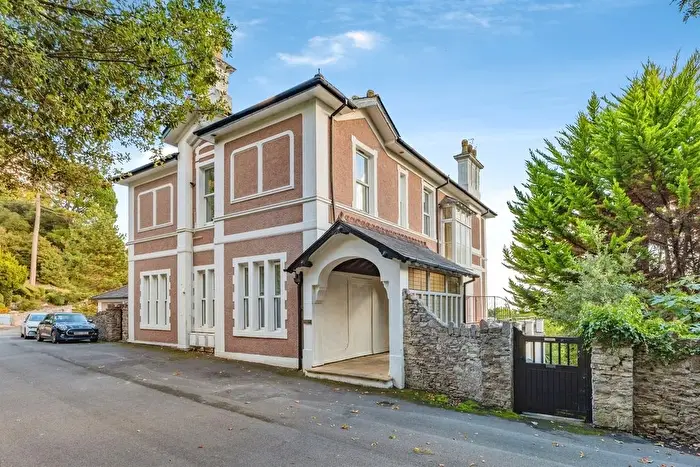
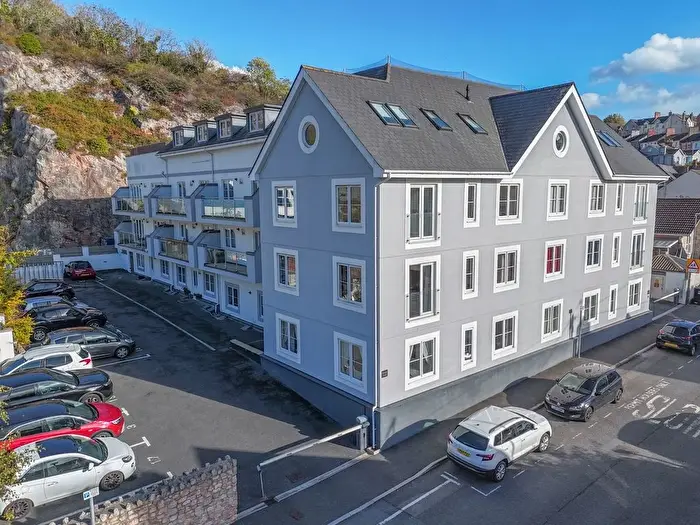
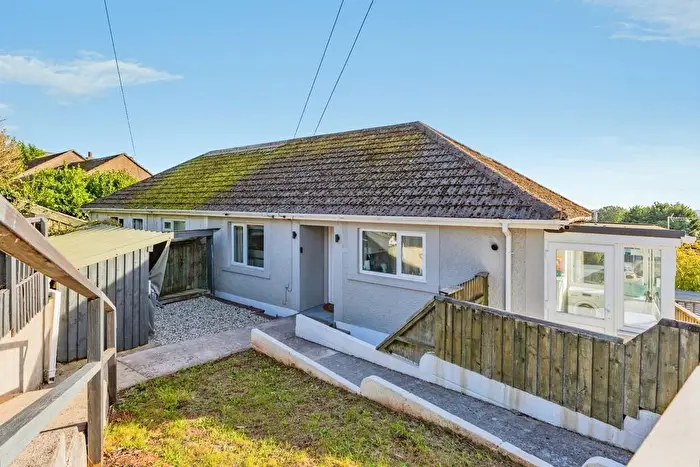
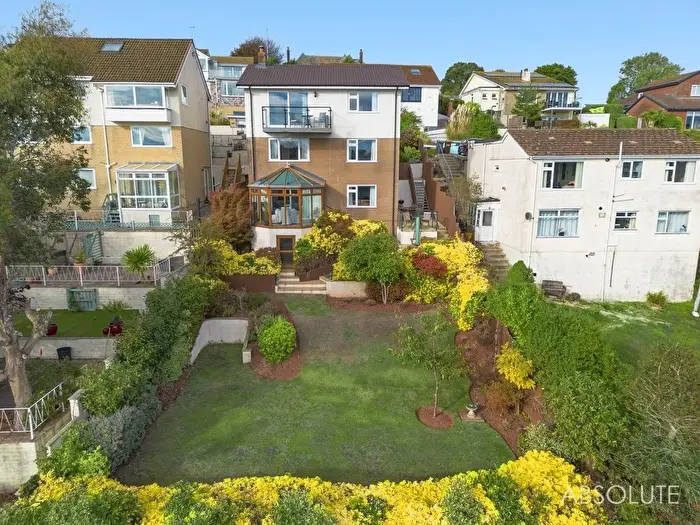
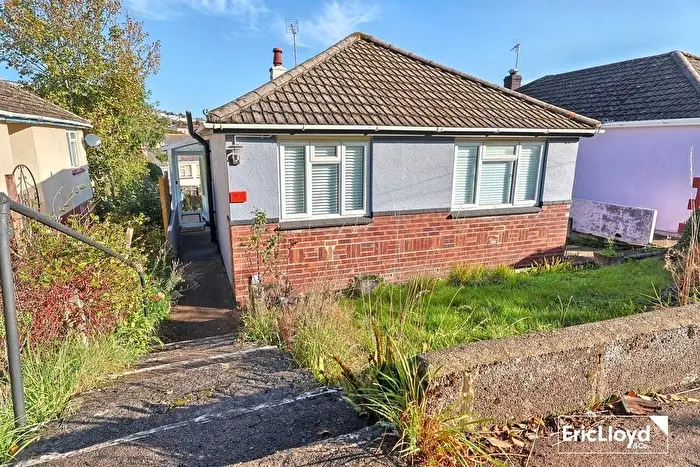
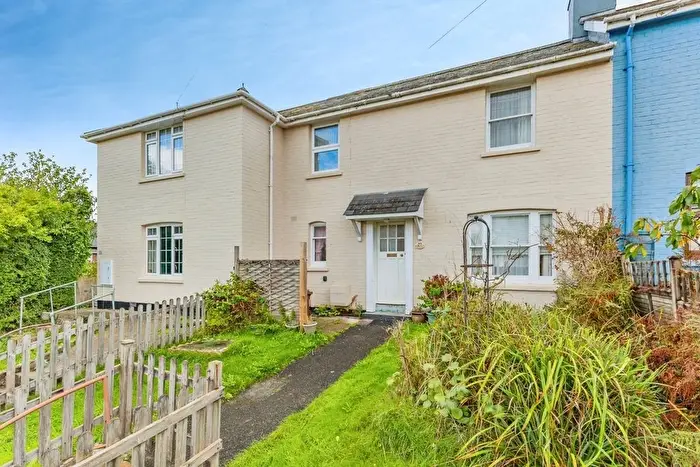
There are 3,133 results. Property prices in TQ range from £90k to £1.69M with an average price of £355k.

 4 Bedrooms
 2 Bathrooms


If you are looking to sell your house, let it out, or receive a property valuation, an expert can help you.
Click the button below to get started.



Postcode districts in TQ, Torquay
Navigate through our locations to find the location of your next house in TQ, Torquay, England for sale or to rent.
Transport in TQ, Torquay
Please see below transportation links in this area:

Frequently asked questions about TQ
What is the average price for a property for sale in TQ?
The average price for a property for sale in TQ is £340,758. This amount is 5% lower than the average price in England. There are 3,133 property listings for sale in TQ.
What locations have the most expensive properties for sale in TQ?
The locations with the most expensive properties for sale in TQ are TQ8 at an average of £1,010,866, TQ6 at an average of £499,216 and TQ7 at an average of £495,899.
What locations have the most affordable properties for sale in TQ?
The locations with the most affordable properties for sale in TQ are TQ1 at an average of £261,686, TQ3 at an average of £262,872 and TQ2 at an average of £270,407.
Which train stations are available in or near TQ?
Some of the train stations available in or near TQ are Paignton, Totnes and Torquay.