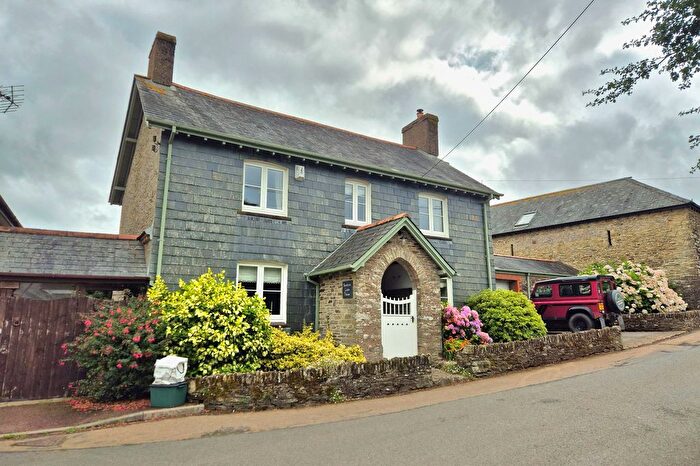
Houses for sale & to rent in Saltstone, Kingsbridge
House Prices in Saltstone
Properties in Saltstone have an average house price of £557,528.00 and had 70 Property Transactions within the last 3 years¹.
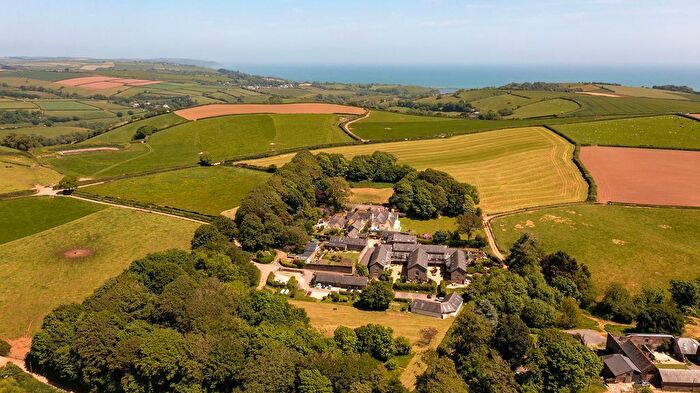
Saltstone is an area in Kingsbridge, Devon with 604 households², where the most expensive property was sold for £2,200,000.00.
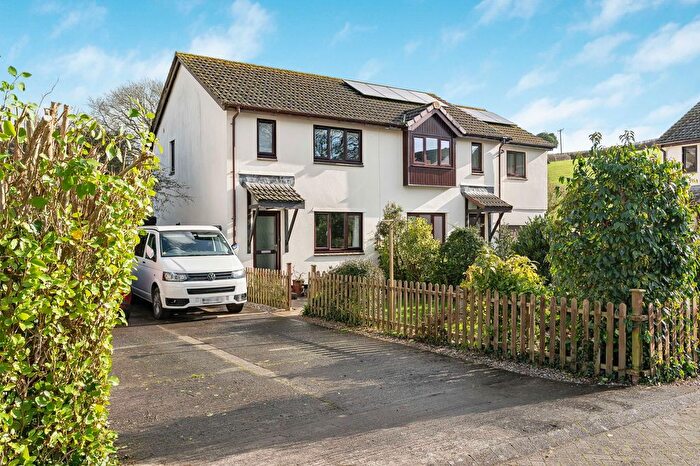
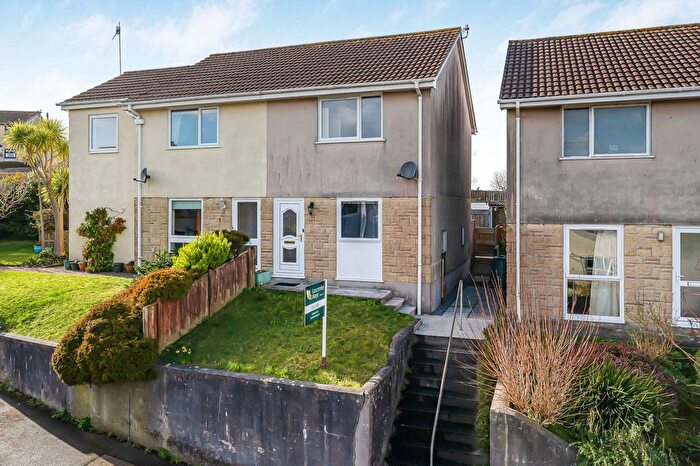
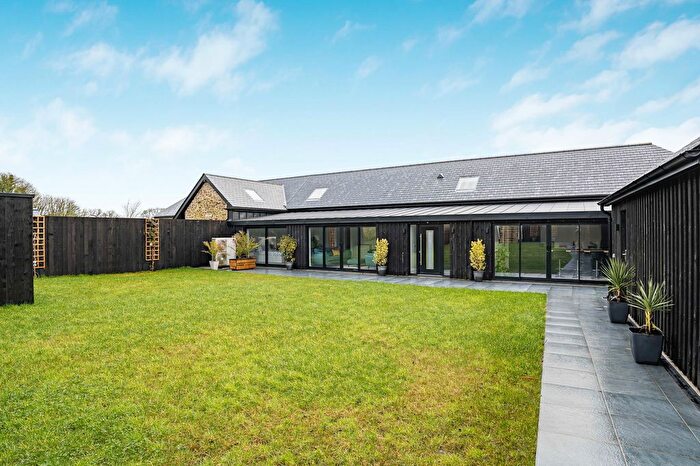
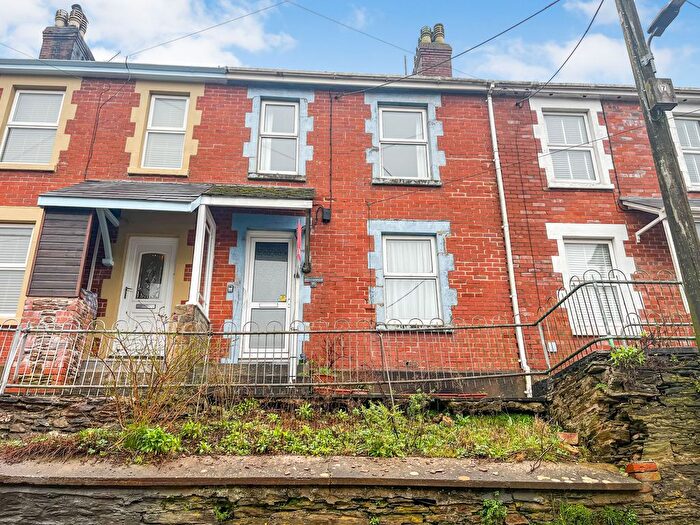
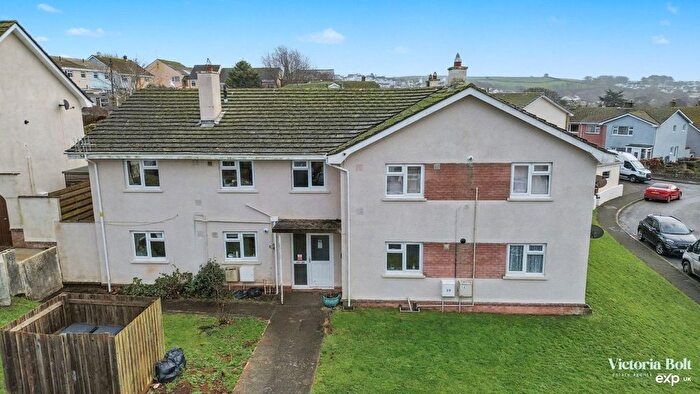
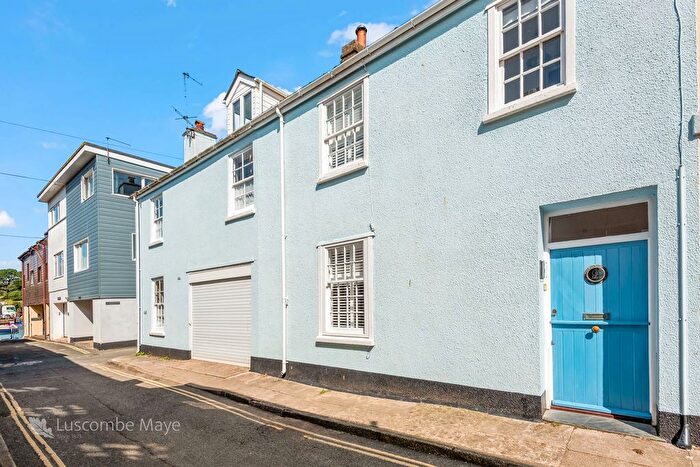
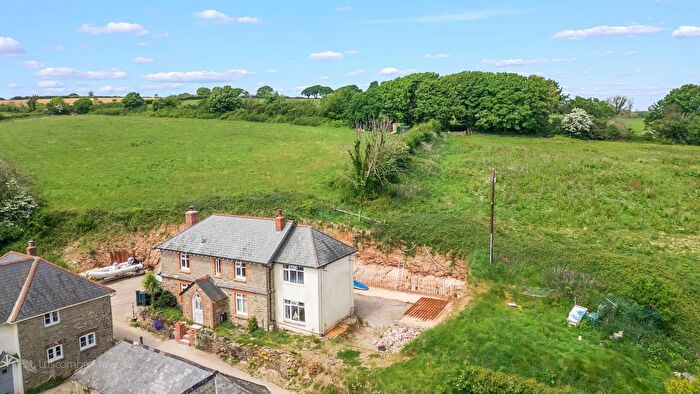
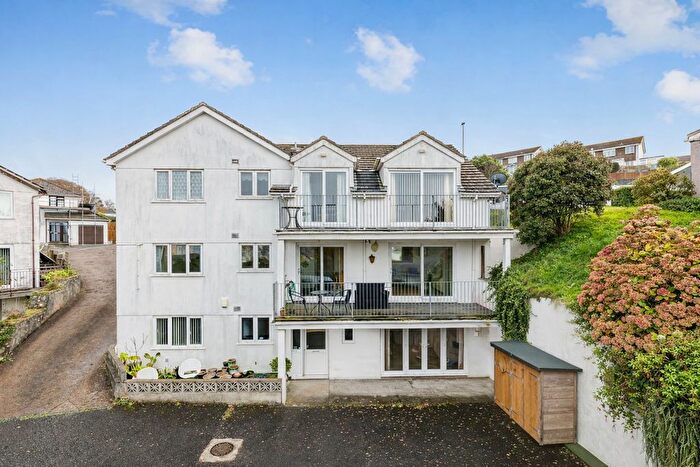
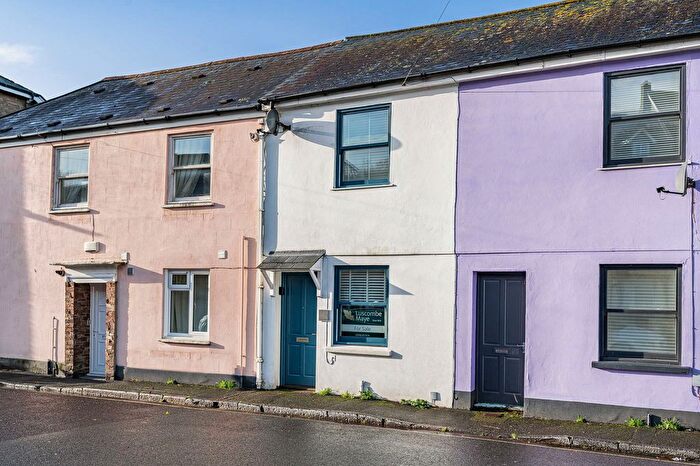
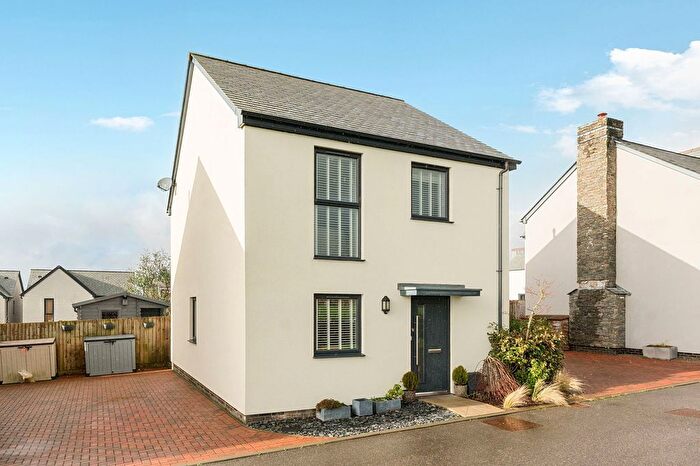
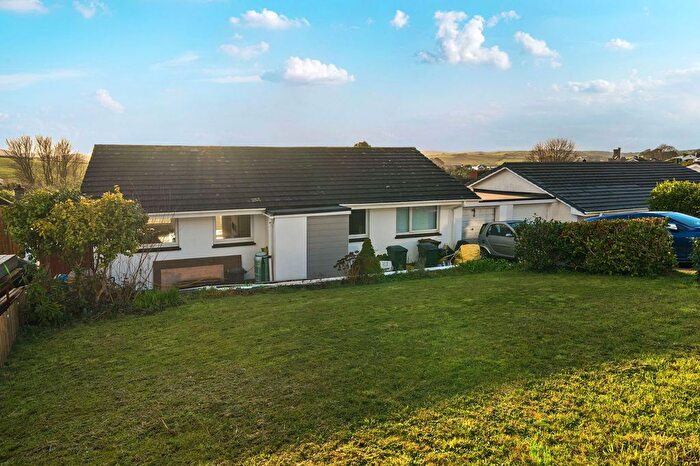
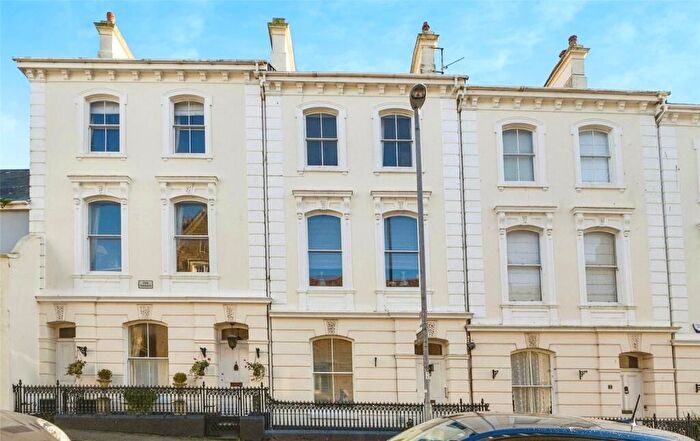
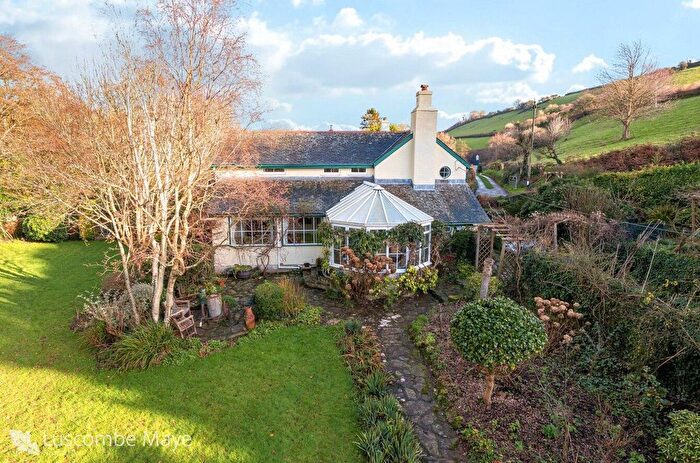
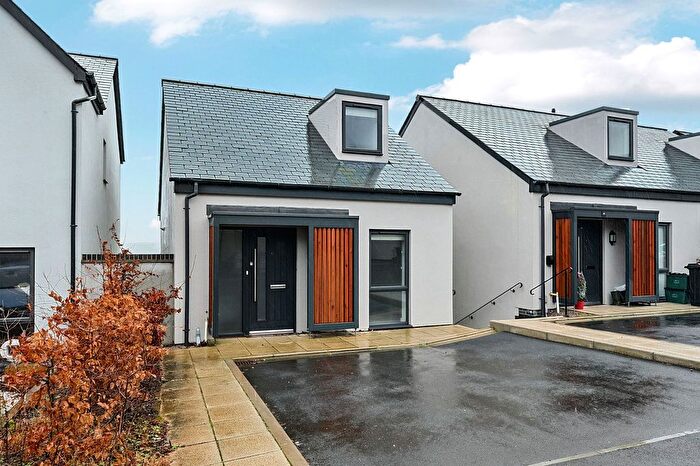
Properties for sale in Saltstone
Previously listed properties in Saltstone
Roads and Postcodes in Saltstone
Navigate through our locations to find the location of your next house in Saltstone, Kingsbridge for sale or to rent.
| Streets | Postcodes |
|---|---|
| Apple Tree Close | TQ7 2UT |
| Charleton Way | TQ7 2AN |
| Cliff End Cottages | TQ7 2RT |
| Coastguard Cottages | TQ7 2BX |
| Compton Road | TQ7 2BP |
| Creek End | TQ7 2RN |
| Curlew Drive | TQ7 2AA |
| Herons Reach | TQ7 2TT |
| Higher Park | TQ7 2DB |
| Jeffreys Meadow | TQ7 2DQ |
| Lyte Lane | TQ7 2BW |
| Marsh Lane | TQ7 2AQ |
| Mill Lane | TQ7 2NZ |
| New Bridge | TQ7 2DH |
| Northampton Terrace | TQ7 2NS |
| Orchard Close | TQ7 2PQ |
| Orchard View | TQ7 2PF |
| Riverside Cottages | TQ7 2RL |
| Rose Cottages | TQ7 2AY |
| Saunders Way | TQ7 2BS |
| Sherford Down Road | TQ7 2BQ |
| Sicklemans Close | TQ7 2AF |
| South Pool | TQ7 2RP TQ7 2RR TQ7 2RS TQ7 2RU TQ7 2RW TQ7 2RX TQ7 2RY TQ7 2RZ |
| Town Road | TQ7 2DF |
| Willows Close | TQ7 2NY |
| TQ7 2AB TQ7 2AD TQ7 2AE TQ7 2AG TQ7 2AH TQ7 2AJ TQ7 2AL TQ7 2AR TQ7 2AS TQ7 2AT TQ7 2AU TQ7 2AW TQ7 2AX TQ7 2AZ TQ7 2BA TQ7 2BB TQ7 2BE TQ7 2BR TQ7 2BT TQ7 2BU TQ7 2BY TQ7 2BZ TQ7 2DA TQ7 2DD TQ7 2DE TQ7 2DN TQ7 2DR TQ7 2LN TQ7 2LY TQ7 2LZ TQ7 2NB TQ7 2ND TQ7 2NJ TQ7 2NR TQ7 2NT TQ7 2NU TQ7 2PA TQ7 2PE TQ7 2PG |
Transport near Saltstone
- FAQ
- Price Paid By Year
- Property Type Price
Frequently asked questions about Saltstone
What is the average price for a property for sale in Saltstone?
The average price for a property for sale in Saltstone is £557,528. This amount is 12% higher than the average price in Kingsbridge. There are 878 property listings for sale in Saltstone.
What streets have the most expensive properties for sale in Saltstone?
The streets with the most expensive properties for sale in Saltstone are South Pool at an average of £869,166, Compton Road at an average of £491,052 and Charleton Way at an average of £436,666.
What streets have the most affordable properties for sale in Saltstone?
The streets with the most affordable properties for sale in Saltstone are Higher Park at an average of £347,500, Saunders Way at an average of £352,900 and Lyte Lane at an average of £403,450.
Which train stations are available in or near Saltstone?
Some of the train stations available in or near Saltstone are Ivybridge, Totnes and Paignton.
Property Price Paid in Saltstone by Year
The average sold property price by year was:
| Year | Average Sold Price | Price Change |
Sold Properties
|
|---|---|---|---|
| 2025 | £485,833 | 14% |
18 Properties |
| 2024 | £418,500 | -68% |
22 Properties |
| 2023 | £702,500 | 18% |
30 Properties |
| 2022 | £573,923 | 4% |
39 Properties |
| 2021 | £551,609 | 11% |
41 Properties |
| 2020 | £489,044 | 23% |
35 Properties |
| 2019 | £374,374 | -39% |
35 Properties |
| 2018 | £521,514 | 12% |
31 Properties |
| 2017 | £460,181 | 11% |
38 Properties |
| 2016 | £410,115 | -2% |
26 Properties |
| 2015 | £419,534 | -4% |
29 Properties |
| 2014 | £437,497 | 10% |
37 Properties |
| 2013 | £395,437 | 7% |
35 Properties |
| 2012 | £367,630 | -0,3% |
23 Properties |
| 2011 | £368,628 | -20% |
19 Properties |
| 2010 | £441,365 | 25% |
26 Properties |
| 2009 | £329,235 | -14% |
23 Properties |
| 2008 | £375,047 | -5% |
21 Properties |
| 2007 | £395,547 | 5% |
39 Properties |
| 2006 | £377,025 | 14% |
40 Properties |
| 2005 | £324,826 | -2% |
48 Properties |
| 2004 | £331,303 | 24% |
45 Properties |
| 2003 | £250,528 | 14% |
34 Properties |
| 2002 | £215,450 | 28% |
31 Properties |
| 2001 | £155,385 | -9% |
38 Properties |
| 2000 | £169,656 | 27% |
31 Properties |
| 1999 | £123,368 | -23% |
45 Properties |
| 1998 | £151,288 | 7% |
39 Properties |
| 1997 | £140,975 | 31% |
40 Properties |
| 1996 | £97,127 | -2% |
37 Properties |
| 1995 | £99,073 | - |
28 Properties |
Property Price per Property Type in Saltstone
Here you can find historic sold price data in order to help with your property search.
The average Property Paid Price for specific property types in the last three years are:
| Property Type | Average Sold Price | Sold Properties |
|---|---|---|
| Semi Detached House | £470,000.00 | 10 Semi Detached Houses |
| Detached House | £766,114.00 | 35 Detached Houses |
| Terraced House | £339,666.00 | 18 Terraced Houses |
| Flat | £199,857.00 | 7 Flats |

