
Houses for sale in TQ7 2AG, Saltstone, Kingsbridge
House Prices in TQ7 2AG, Saltstone
Properties in TQ7 2AG have no sales history available within the last 3 years. TQ7 2AG is a postcode in Saltstone, an area in Kingsbridge, Devon, with 2 households².
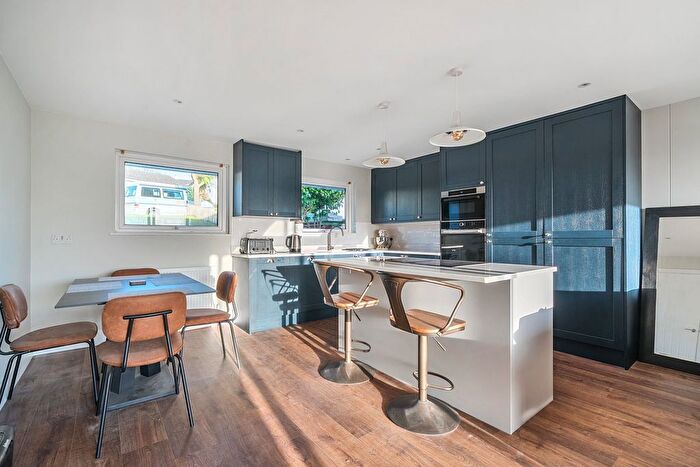
Previously listed properties near TQ7 2AG
![]()
If you are looking to sell your house, let it out, or receive a property valuation, an expert can help you.
Click the button below to get started.


Price Paid in TQ7 2AG, Saltstone
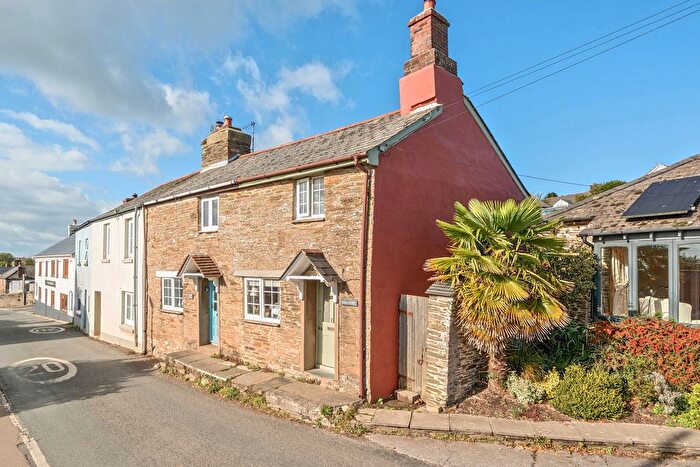
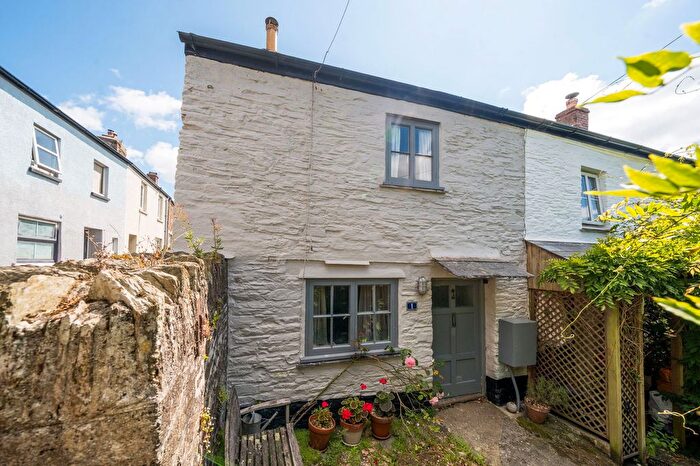
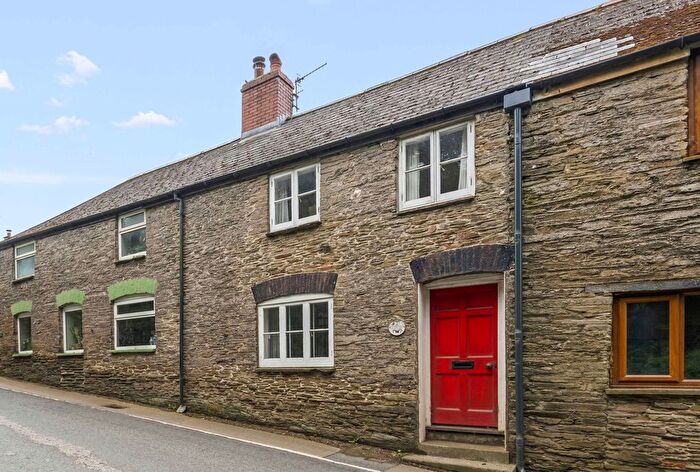
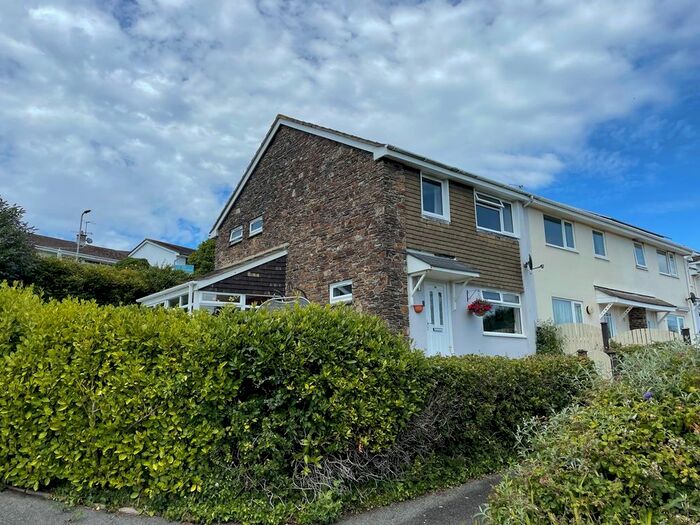
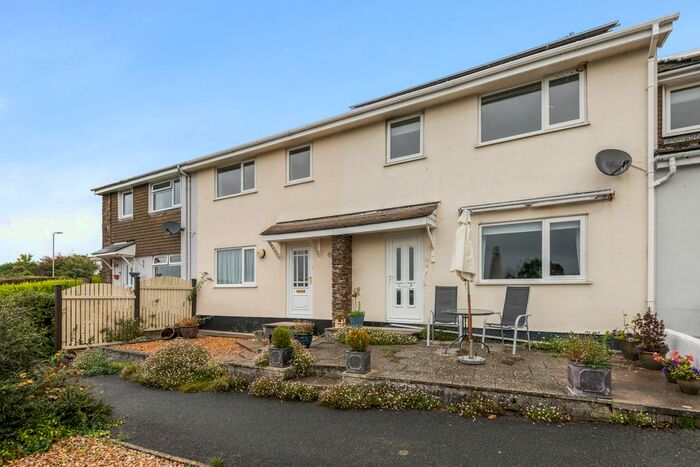
1 TQ7 2AG, Saltstone Kingsbridge
Property 1 has been sold 4 times. The last time it was sold was in 28/09/2021 and the sold price was £252,500.00.
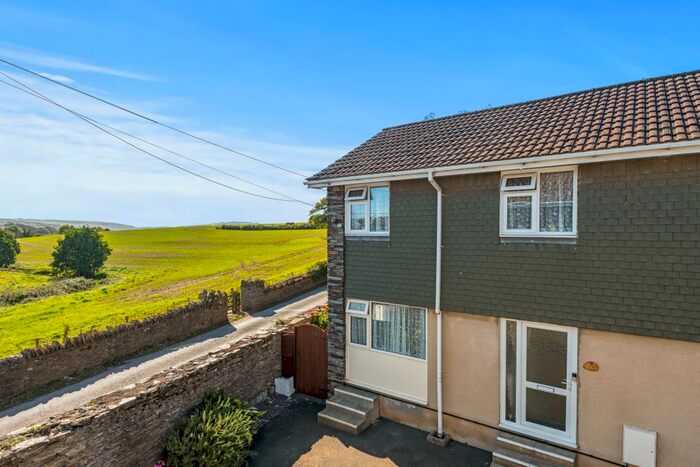
This terraced house, sold as a freehold on 28/09/2021, is a 71 sqm end-terrace house with an EPC rating of E.
| Date | Price | Property Type | Tenure | Classification |
|---|---|---|---|---|
| 28/09/2021 | £252,500.00 | Terraced House | freehold | Established Building |
| 25/05/2018 | £175,000.00 | Terraced House | freehold | Established Building |
| 23/10/2003 | £160,500.00 | Terraced House | freehold | Established Building |
| 21/05/1997 | £58,350.00 | Terraced House | freehold | Established Building |
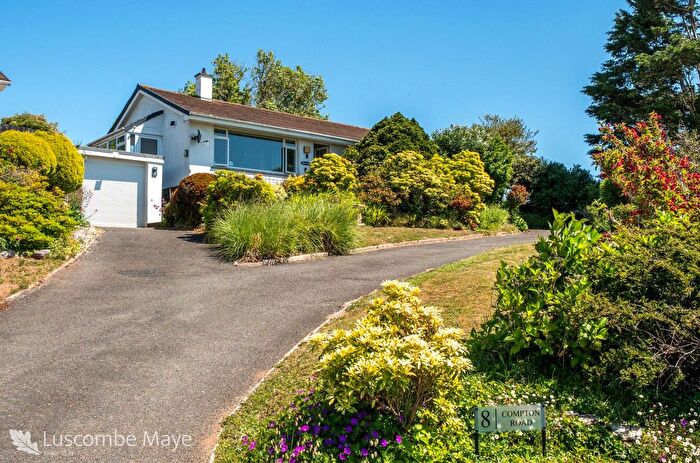
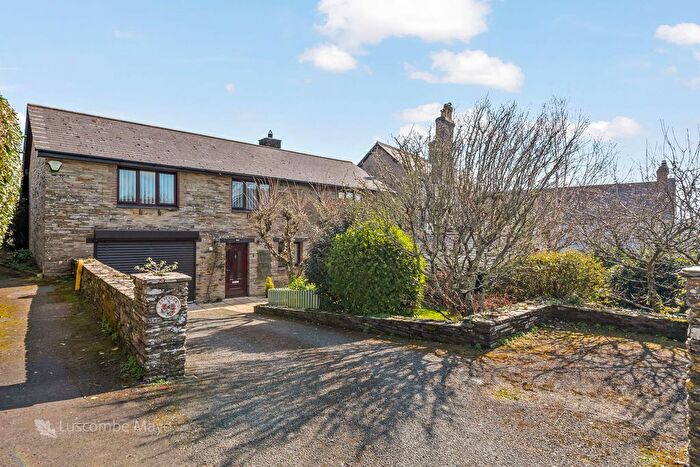
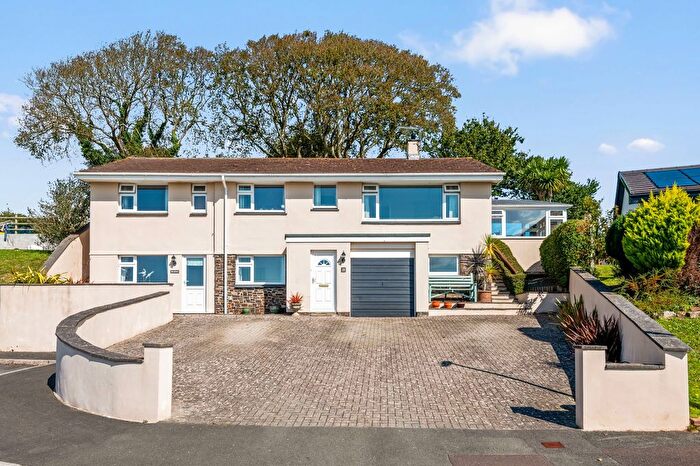
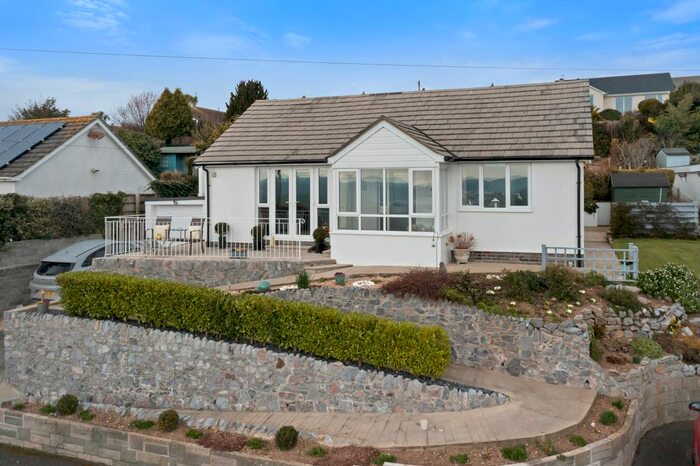
MARSHBANK TQ7 2AG, Saltstone Kingsbridge
Property MARSHBANK has been sold 3 times. The last time it was sold was in 21/06/2021 and the sold price was £467,500.00.
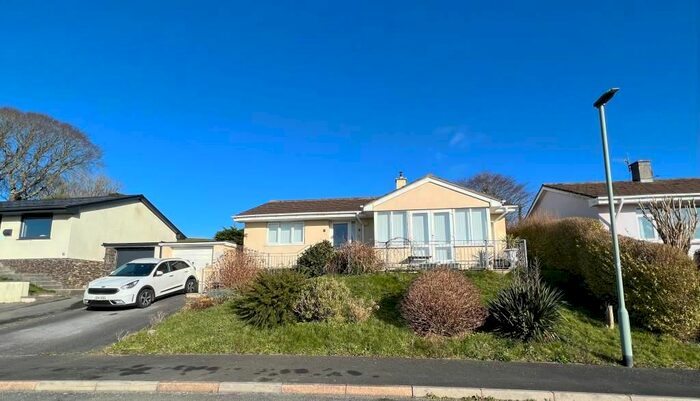
This detached house, sold as a freehold on 21/06/2021, is a 81 sqm detached bungalow with an EPC rating of D.
| Date | Price | Property Type | Tenure | Classification |
|---|---|---|---|---|
| 21/06/2021 | £467,500.00 | Detached House | freehold | Established Building |
| 24/01/2014 | £346,000.00 | Detached House | freehold | Established Building |
| 13/04/2007 | £238,500.00 | Detached House | freehold | Established Building |
Property price trends in TQ7 2AG
According to the latest Land Registry data, the average home in TQ7 2AG sold for £360,000 in 2021. That figure comes from 7 sales logged over the past 24 years.
Prices have continued to climb over the last three years. Compared with 2018, when the typical sale came in around £175,000, that's a rise of roughly 105.7%.
Property Price Paid in TQ7 2AG by Year
The average sold property price by year was:
| Year | Average Sold Price | Price Change |
Sold Properties
|
|---|---|---|---|
| 2021 | £360,000 | 51% |
2 Properties |
| 2018 | £175,000 | -98% |
1 Property |
| 2014 | £346,000 | 31% |
1 Property |
| 2007 | £238,500 | 33% |
1 Property |
| 2003 | £160,500 | 64% |
1 Property |
| 1997 | £58,350 | - |
1 Property |
