
Houses for sale in Kingsbridge East, Kingsbridge
House Prices in Kingsbridge East
Properties in Kingsbridge East have an average house price of £445k and had 122 Property Transactions within the last 3 years¹.
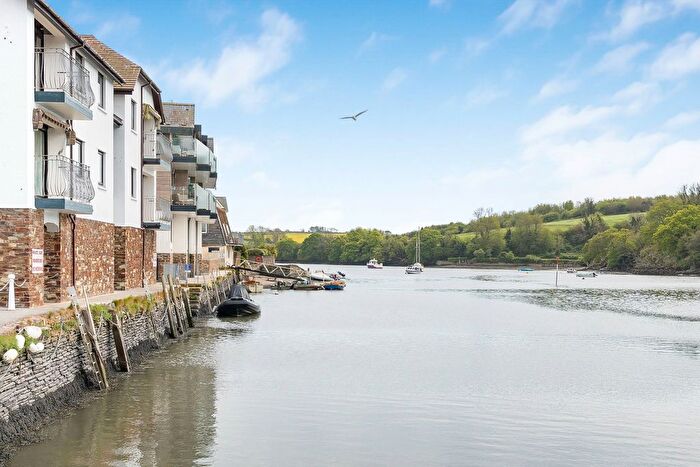
Kingsbridge East is an area in Kingsbridge, Devon with 898 households², where the most expensive property was sold for £2.19M.
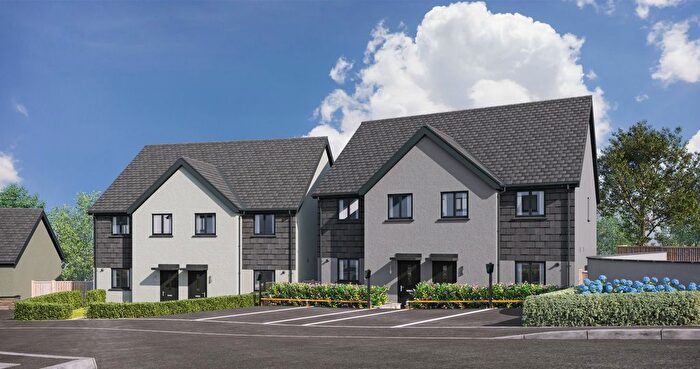
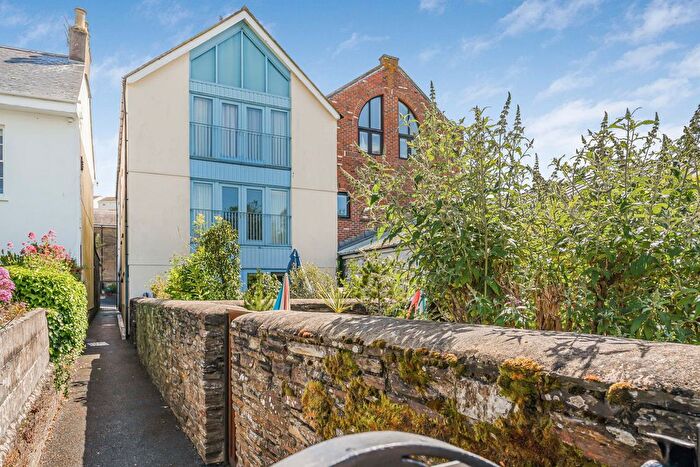
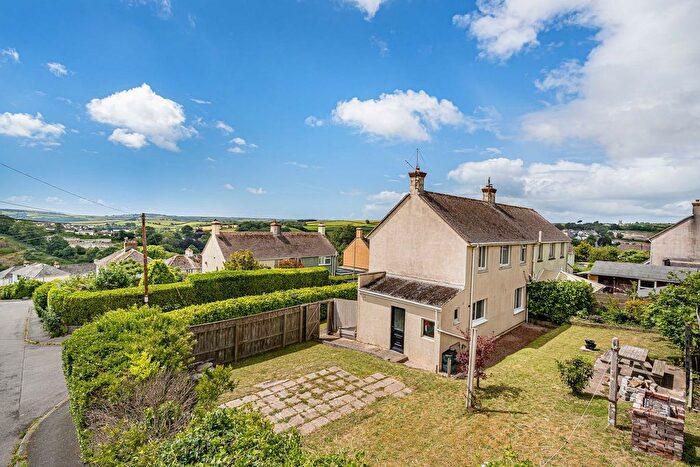
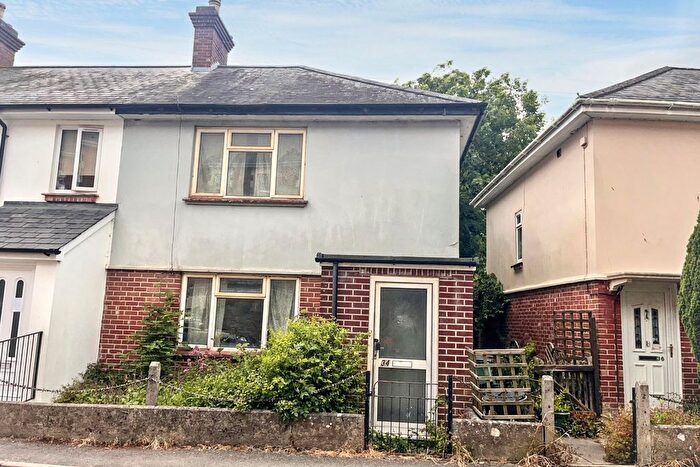
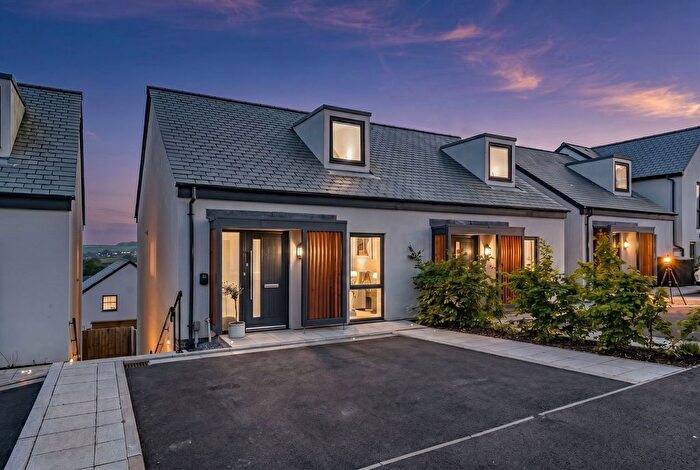
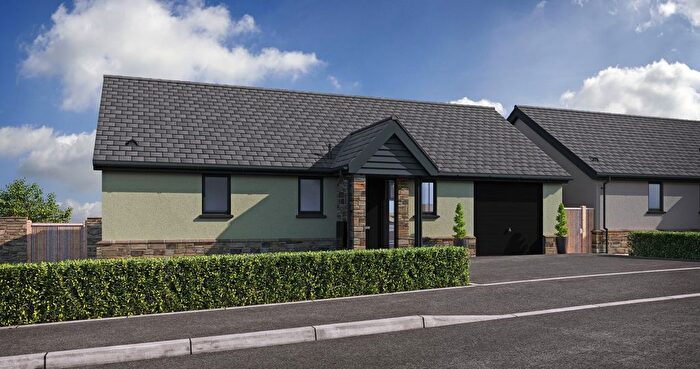
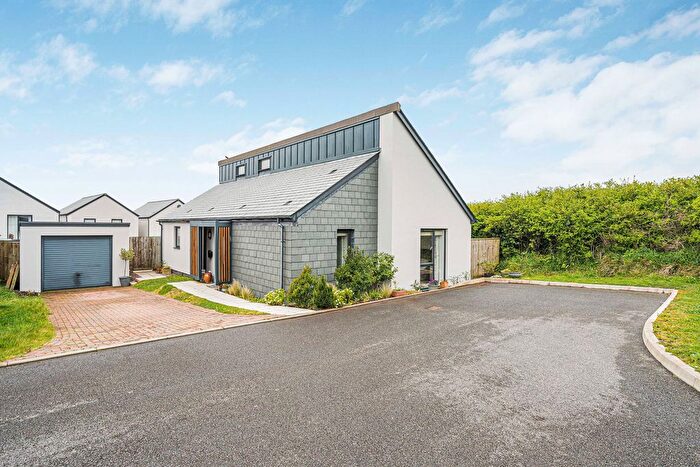
Properties for sale in Kingsbridge East
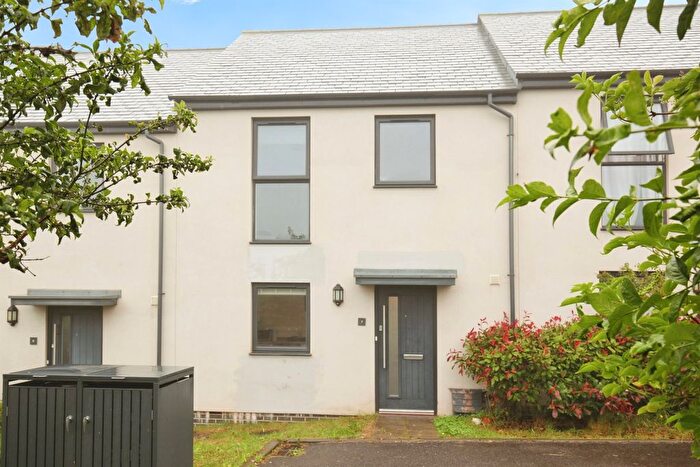
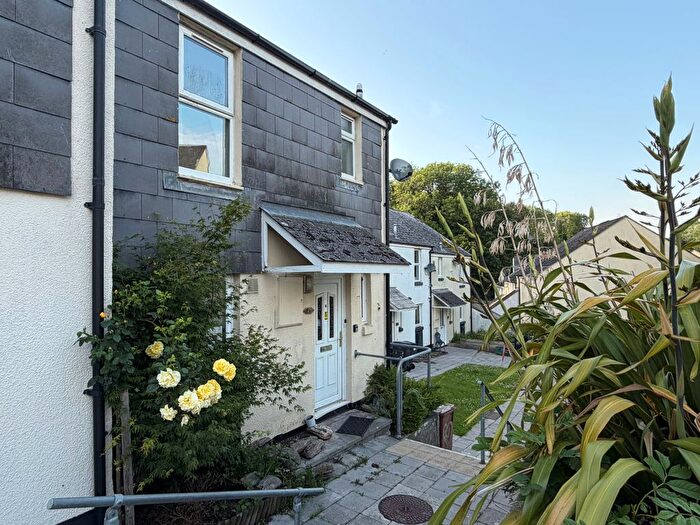
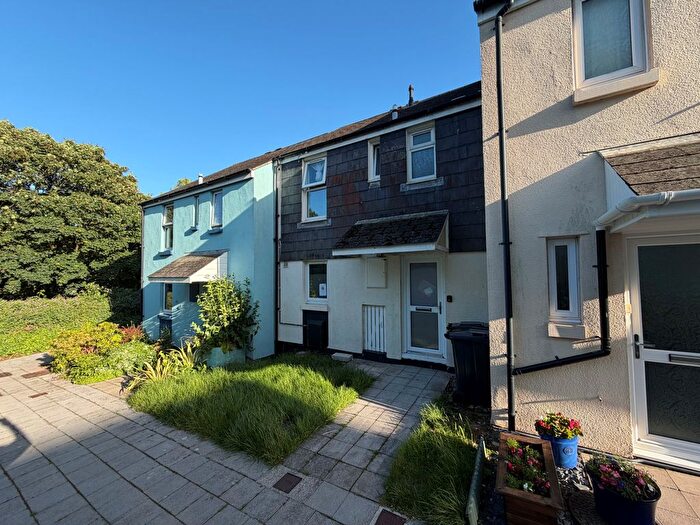
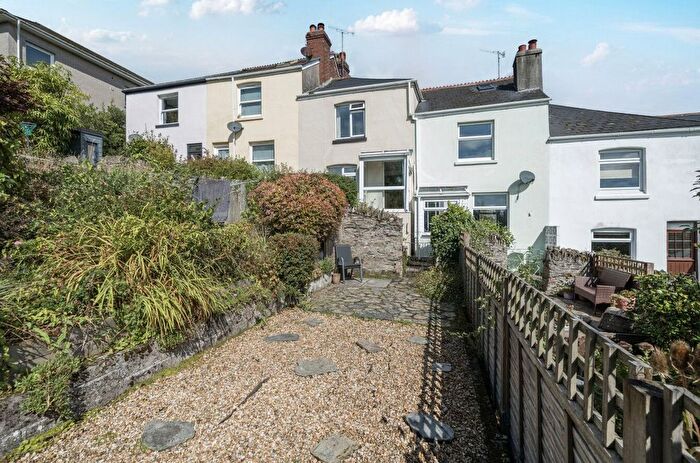
Previously listed properties in Kingsbridge East
![]()
If you are looking to sell your house, let it out, or receive a property valuation, an expert can help you.
Click the button below to get started.


Roads and Postcodes in Kingsbridge East
Navigate through our locations to find the location of your next house in Kingsbridge East, Kingsbridge for sale or to rent.
| Streets | Postcodes |
|---|---|
| Barton Close | TQ7 1JU |
| Beckets Road | TQ7 1RH |
| Beechwood Drive | TQ7 1RR |
| Bowcombe Road | TQ7 2DJ TQ7 2DL |
| Church Street | TQ7 1NW |
| Coronation Road | TQ7 1DJ TQ7 1DL TQ7 1DW |
| Culver Park Close | TQ7 1LD |
| Derby Road | TQ7 1JJ TQ7 1JL |
| Ebrington Street | TQ7 1DA |
| Embankment Road | TQ7 1FE TQ7 1JN TQ7 1JX TQ7 1JZ TQ7 1LA TQ7 1LJ TQ7 1LP TQ7 1LQ TQ7 1RD TQ7 1SJ TQ7 1SP |
| Fairfield Close | TQ7 1JS |
| Henacre Road | TQ7 1DN TQ7 1DP |
| Higher Warren Road | TQ7 1LG TQ7 1LH |
| Highfield Drive | TQ7 1JP TQ7 1JR TQ7 1JW |
| Hillside | TQ7 1DF |
| Hillside Drive | TQ7 1JT |
| Ilton Way | TQ7 1DT |
| Kenwith Drive | TQ7 1DU |
| Linhey Close | TQ7 1LL |
| Lower Warren Road | TQ7 1LF |
| Promenade | TQ7 1DG TQ7 1HP TQ7 1JF |
| Rack Park Road | TQ7 1DH TQ7 1DQ TQ7 1DS |
| Saffron Park | TQ7 1RL TQ7 1RN TQ7 1RW |
| Salt Quay Moorings | TQ7 1LN |
| Skelmersdale Close | TQ7 1QP |
| South Place | TQ7 1JE |
| Southville Gardens | TQ7 1LE |
| The Promenade | TQ7 1JG |
| Vincents Road | TQ7 1RP |
| Warren Road | TQ7 1LB |
| Washabrook Lane | TQ7 1RS |
| Washabrook Way | TQ7 1RJ |
| Waterside | TQ7 1JH |
| TQ7 1NN |
Property price trends in Kingsbridge East
According to the latest Land Registry data, the average home in Kingsbridge East sold for £450,000 in 2026. That figure comes from 1,401 sales logged over the past 31 years.
Prices have held fairly steady over the last three years. Compared with 2023, when the typical sale came in around £452,500, values are broadly unchanged.
Looking back five years, average prices are up about 24.7% since 2021, a gain of around £89,034 in cash terms.
Zoom out to the past decade for the fuller picture. Back in 2016, homes here averaged £283,226, so the typical sold price has climbed about 58.9% since then, roughly 4.7% a year. Stretch the view to fifteen years and that annual pace eases back to about 3.6%.
Frequently asked questions about Kingsbridge East
What is the average price for a property for sale in Kingsbridge East?
The average price for a property for sale in Kingsbridge East is £445,060. This amount is 9% lower than the average price in Kingsbridge. There are 345 property listings for sale in Kingsbridge East.
What streets have the most expensive properties for sale in Kingsbridge East?
The streets with the most expensive properties for sale in Kingsbridge East are Higher Warren Road at an average of £737,500, Embankment Road at an average of £696,500 and Warren Road at an average of £667,500.
What streets have the most affordable properties for sale in Kingsbridge East?
The streets with the most affordable properties for sale in Kingsbridge East are Ebrington Street at an average of £165,000, Salt Quay Moorings at an average of £199,153 and Coronation Road at an average of £212,000.
Which train stations are available in or near Kingsbridge East?
Some of the train stations available in or near Kingsbridge East are Ivybridge, Totnes and Paignton.
Property Price Paid in Kingsbridge East by Year
The average sold property price by year was:
| Year | Average Sold Price | Price Change |
Sold Properties
|
|---|---|---|---|
| 2026 | £450,000 | 7% |
2 Properties |
| 2025 | £419,342 | -10% |
38 Properties |
| 2024 | £459,945 | 2% |
48 Properties |
| 2023 | £452,500 | -24% |
34 Properties |
| 2022 | £561,266 | 36% |
33 Properties |
| 2021 | £360,966 | -5% |
59 Properties |
| 2020 | £378,034 | -3% |
43 Properties |
| 2019 | £389,235 | 15% |
35 Properties |
| 2018 | £331,550 | 5% |
30 Properties |
| 2017 | £314,690 | 10% |
38 Properties |
Property Price per Property Type in Kingsbridge East
Here you can find historic sold price data in order to help with your property search.
The average Property Paid Price for specific property types in the last three years are:
| Property Type | Average Sold Price | Sold Properties |
|---|---|---|
| Semi Detached House | £306,428.00 | 25 Semi Detached Houses |
| Detached House | £653,364.00 | 46 Detached Houses |
| Terraced House | £327,648.00 | 10 Terraced Houses |
| Flat | £324,523.00 | 41 Flats |
