
Houses for sale in TQ7 4AB, Thurlestone, Kingsbridge
House Prices in TQ7 4AB, Thurlestone
Properties in TQ7 4AB have no sales history available within the last 3 years. TQ7 4AB is a postcode in Thurlestone, an area in Kingsbridge, Devon, with 9 households².
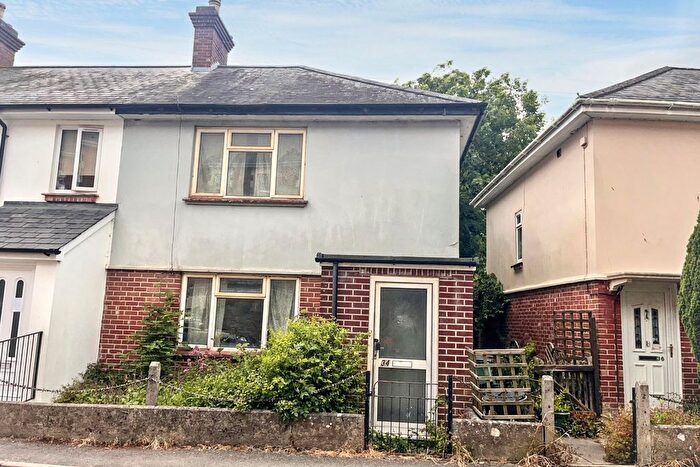
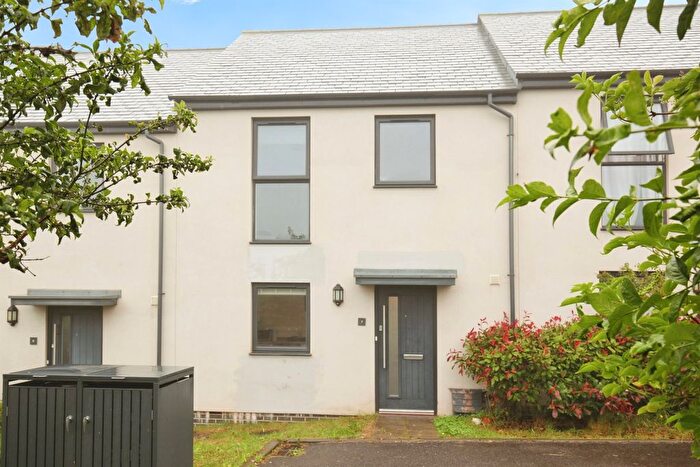
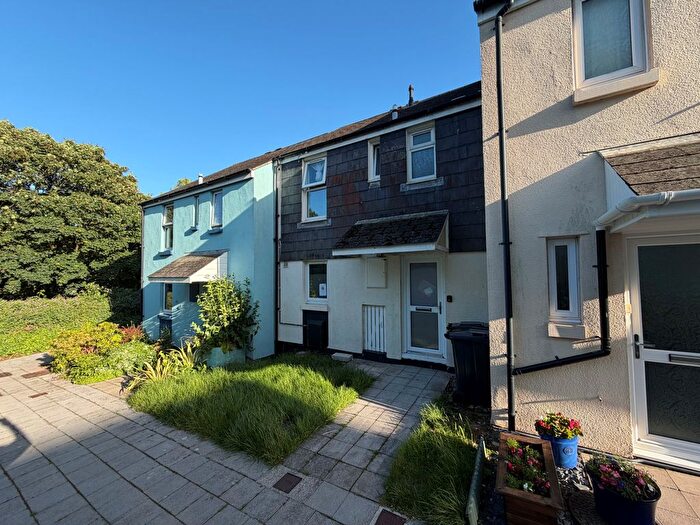
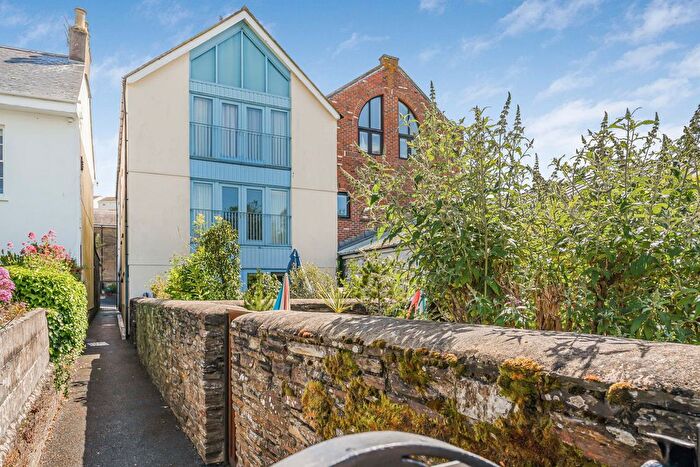
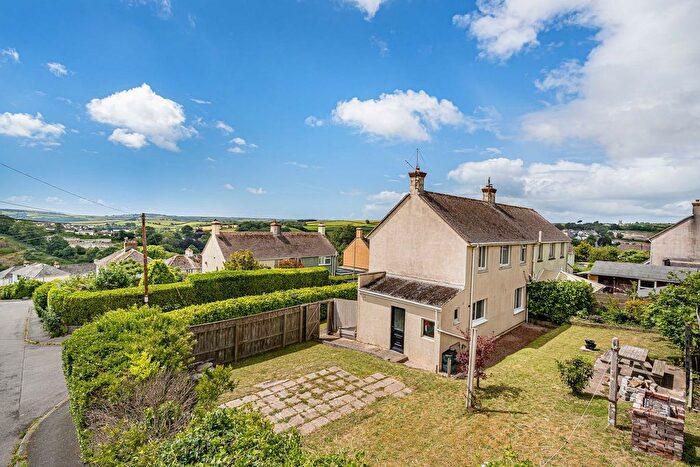
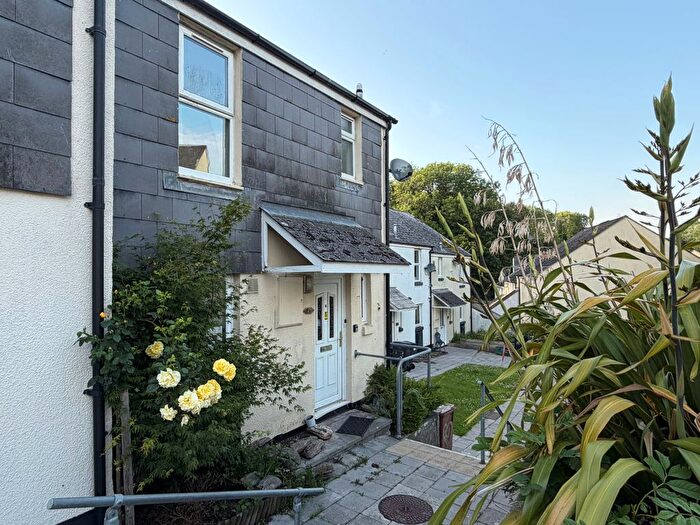
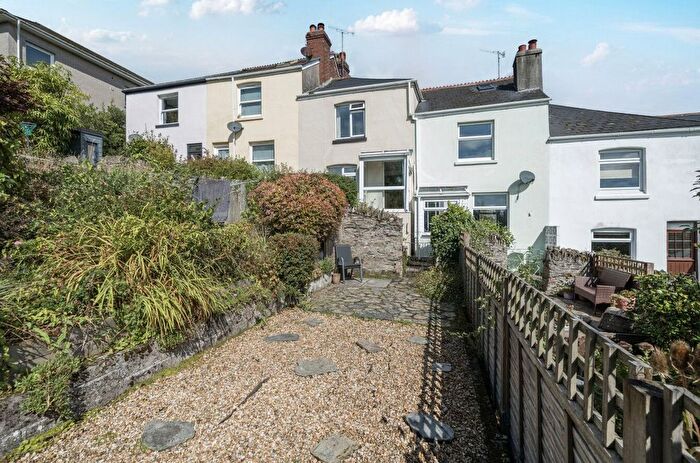
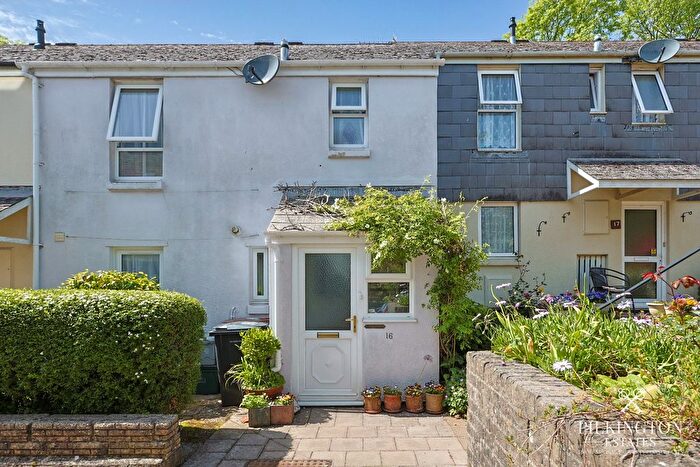
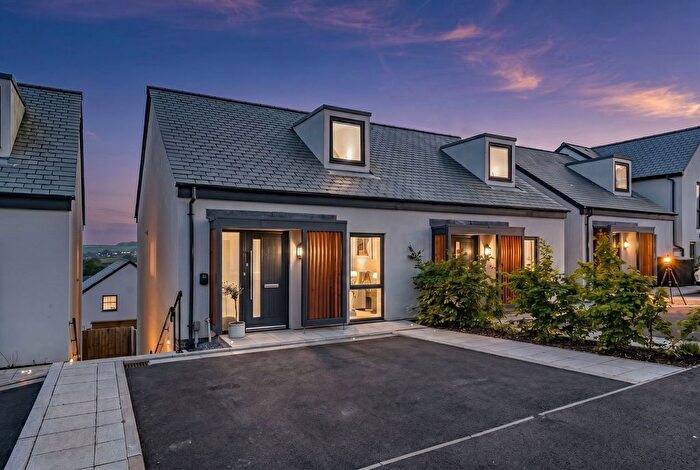
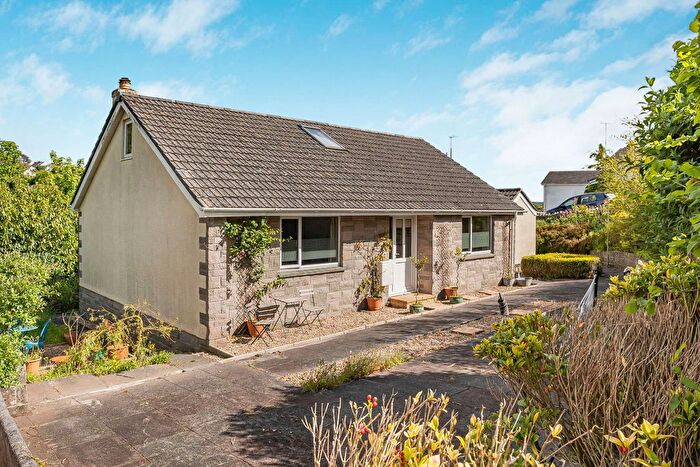
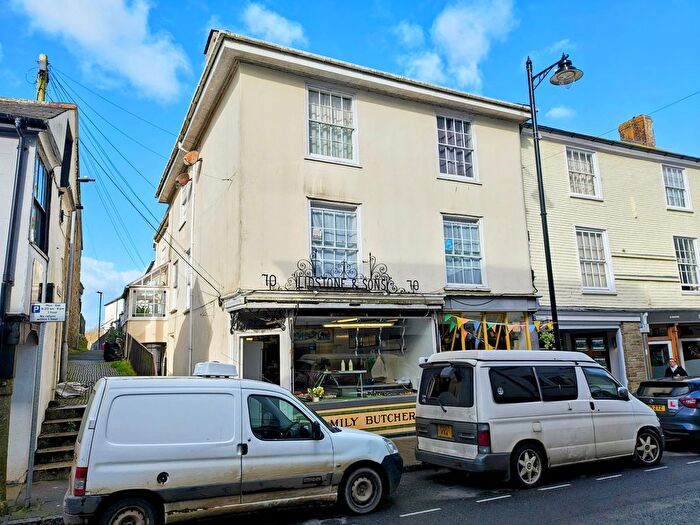
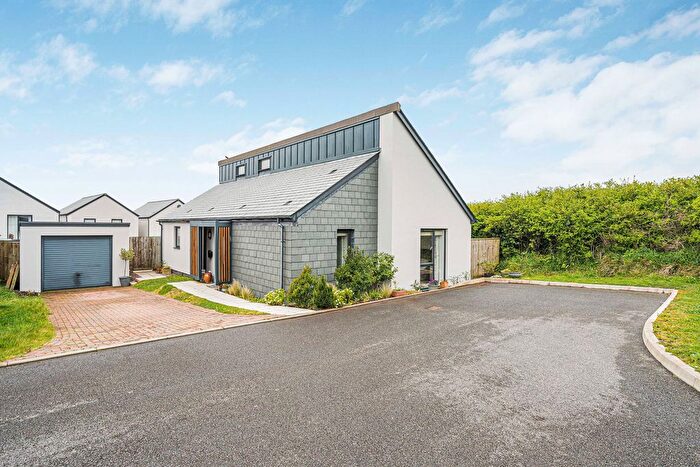
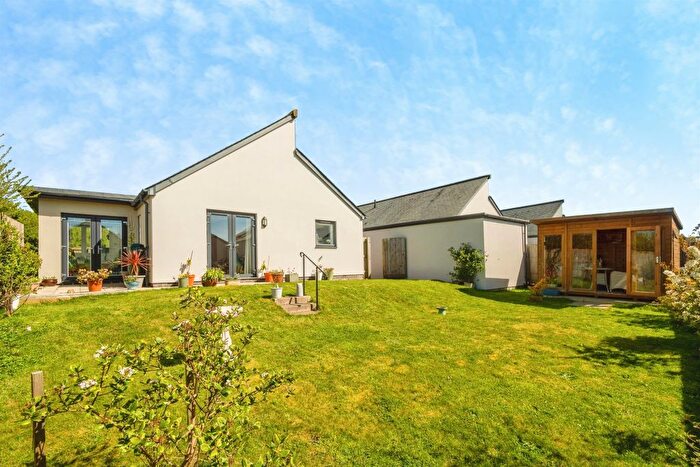
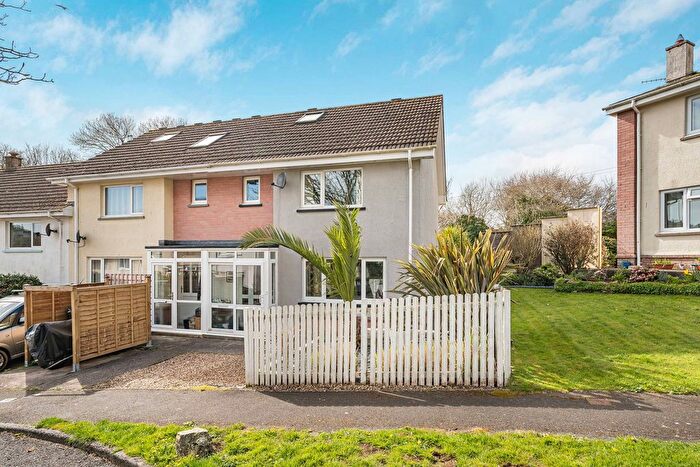
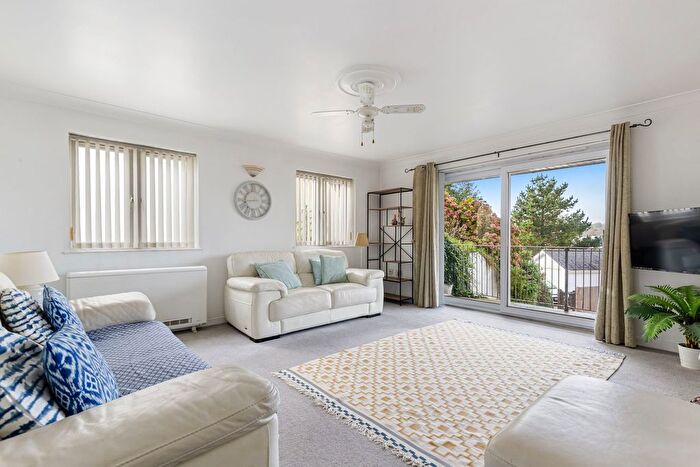
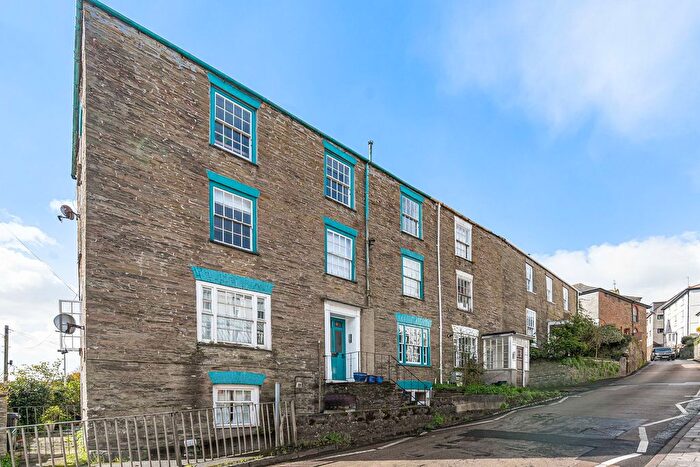
Previously listed properties near TQ7 4AB
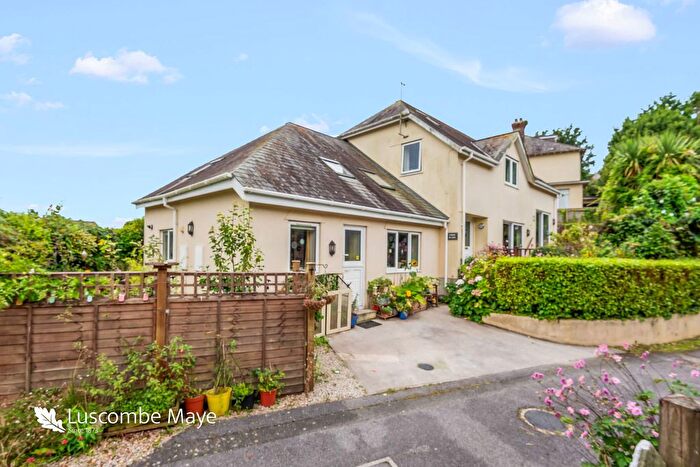
![]()
If you are looking to sell your house, let it out, or receive a property valuation, an expert can help you.
Click the button below to get started.

Price Paid in TQ7 4AB, Thurlestone
SPRINGHILL TQ7 4AB, Thurlestone Kingsbridge
Property SPRINGHILL has been sold 4 times. The last time it was sold was in 26/07/2005 and the sold price was £945,000.00.
This detached house, sold as a freehold on 26/07/2005, is a 275 sqm detached house with an EPC rating of F.
| Date | Price | Property Type | Tenure | Classification |
|---|---|---|---|---|
| 26/07/2005 | £945,000.00 | Detached House | freehold | Established Building |
| 19/05/2004 | £805,000.00 | Detached House | freehold | Established Building |
| 17/01/2003 | £535,000.00 | Detached House | freehold | Established Building |
| 04/08/1997 | £155,000.00 | Detached House | freehold | Established Building |
COOMBE CROFT TQ7 4AB, Thurlestone Kingsbridge
Property COOMBE CROFT has been sold 1 time. The last time it was sold was in 02/04/1996 and the sold price was £90,000.00.
This is a Detached House which was sold as a freehold in 02/04/1996
| Date | Price | Property Type | Tenure | Classification |
|---|---|---|---|---|
| 02/04/1996 | £90,000.00 | Detached House | freehold | Established Building |
Property price trends in TQ7 4AB
According to the latest Land Registry data, the average home in TQ7 4AB sold for £945,000 in 2005. That figure comes from 5 sales logged over the past 9 years.
Prices have continued to climb over the last three years. Compared with 2003, when the typical sale came in around £535,000, that's a rise of roughly 76.6%.
Zoom out to the past decade for the fuller picture. Back in 1996, homes here averaged £90,000, so the typical sold price has climbed about 950% since then, roughly 29.9% a year.
Property Price Paid in TQ7 4AB by Year
The average sold property price by year was:
| Year | Average Sold Price | Price Change |
Sold Properties
|
|---|---|---|---|
| 2005 | £945,000 | 15% |
1 Property |
| 2004 | £805,000 | 34% |
1 Property |
| 2003 | £535,000 | 71% |
1 Property |
| 1997 | £155,000 | 42% |
1 Property |
| 1996 | £90,000 | - |
1 Property |
