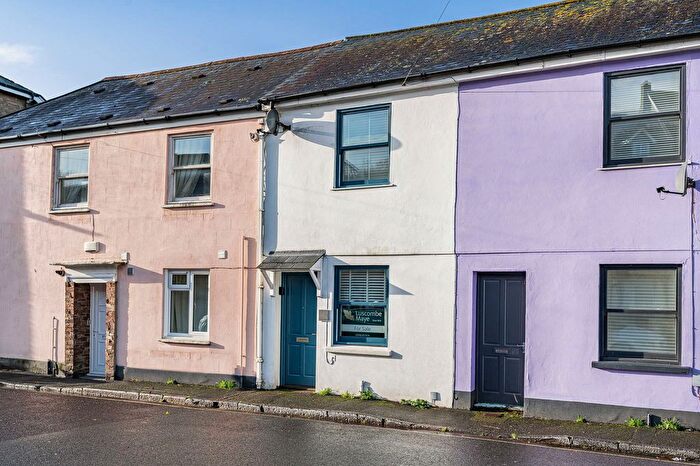
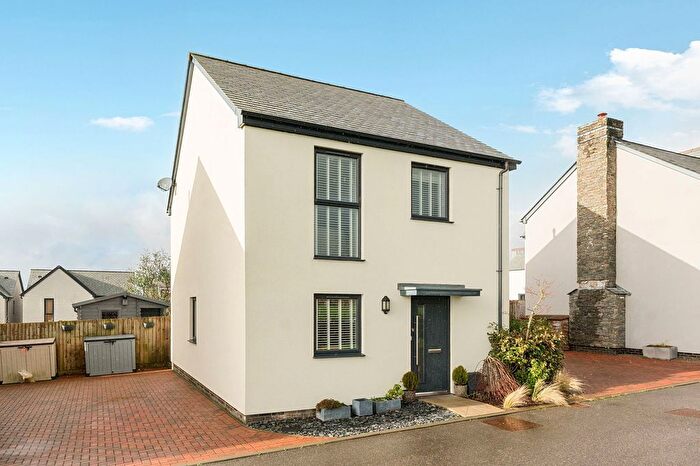
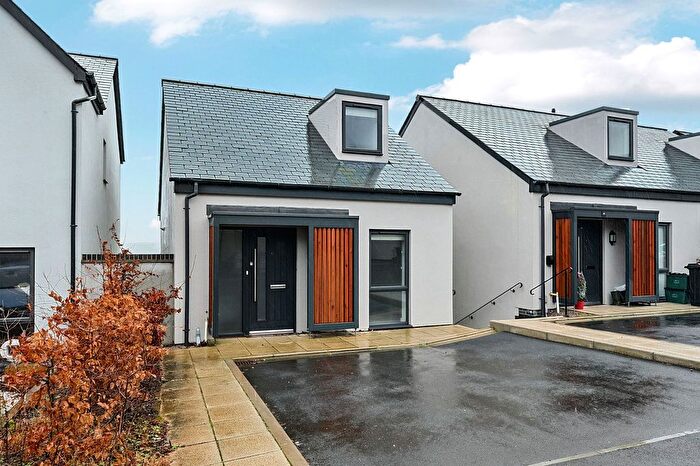
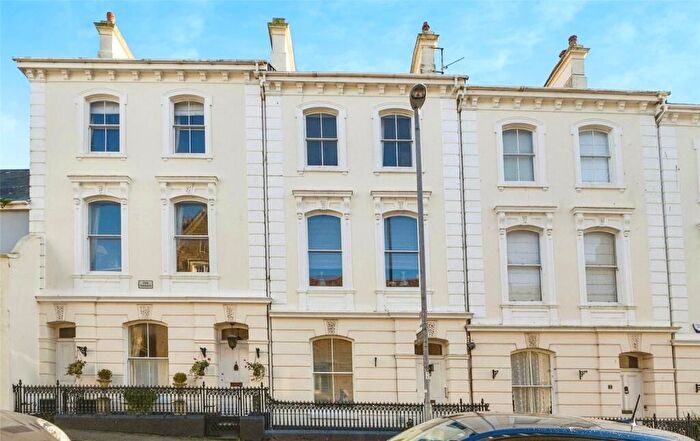
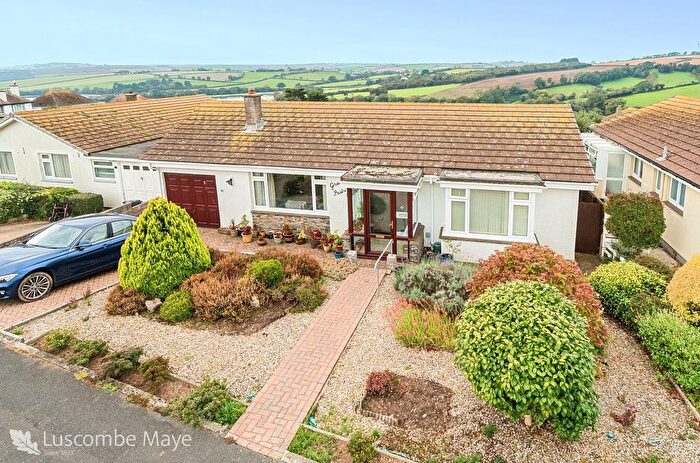
Houses for sale & to rent in Westville And Alvington, Kingsbridge
House Prices in Westville And Alvington
Properties in Westville And Alvington have an average house price of £382,500.00 and had 57 Property Transactions within the last 3 years¹.
Westville And Alvington is an area in Kingsbridge, Devon with 799 households², where the most expensive property was sold for £1,450,000.00.
Properties for sale in Westville And Alvington
Previously listed properties in Westville And Alvington
Roads and Postcodes in Westville And Alvington
Navigate through our locations to find the location of your next house in Westville And Alvington, Kingsbridge for sale or to rent.
| Streets | Postcodes |
|---|---|
| Alvington Terrace | TQ7 1HD |
| Ashleigh Road | TQ7 1HB |
| Badgers Close | TQ7 1TD |
| Badgers Green | TQ7 1UE |
| Balkwill Road | TQ7 1HA |
| Barnfield Walk | TQ7 1QS |
| Brookside | TQ7 1TA |
| Butts Cottages | TQ7 3PS |
| Collapit | TQ7 3BB |
| Courtlage Walk | TQ7 1QX |
| Crispin Road | TQ7 1EP |
| Feoffees Cottages | TQ7 3QD |
| Fern Bank | TQ7 3PR |
| Follet Close | TQ7 3PN |
| Frogmore Terrace | TQ7 1EU |
| Gerston | TQ7 3BN |
| Greenfield Cottages | TQ7 3PY |
| Greenfields Cottages | TQ7 3QE |
| Hawthorn Close | TQ7 1TB |
| Higher Union Road | TQ7 1EQ |
| Homelands Place | TQ7 1QU |
| Hurrell Road | TQ7 1ER TQ7 1HT |
| Ilbert Road | TQ7 1EB |
| Isigny Road | TQ7 1EN |
| Kingsley Road | TQ7 1EY |
| Kingsway Park | TQ7 1HF TQ7 1HJ TQ7 1UD |
| Lime Grove | TQ7 1TP |
| Lion Close | TQ7 1EW |
| Longfields | TQ7 3QG |
| Lower Street | TQ7 3QB |
| Montagu Road | TQ7 1EL |
| Oaklea Close | TQ7 1HW |
| Old Station Yard | TQ7 1FB |
| Phoenix Place | TQ7 3PG |
| Preston Cottages | TQ7 3BG |
| Redford Way | TQ7 1EJ |
| Retreat Close | TQ7 1EH |
| Rope Walk | TQ7 1HH |
| Southfield | TQ7 3QF |
| Springfield Drive | TQ7 1HG |
| St Edmunds Walk | TQ7 1QT |
| Station Yard Industrial Estate | TQ7 1ES |
| Stockwell Cottages | TQ7 3PU |
| Town Park | TQ7 3PQ |
| Townsend Close | TQ7 3QA |
| Townsend Road | TQ7 3PZ |
| Trevanna Road | TQ7 1ET |
| Veales Road | TQ7 1EX |
| Waverley Road | TQ7 1EZ |
| Westville Hill | TQ7 1HE |
| Wood Lane | TQ7 3PH |
| TQ7 3AY TQ7 3BD TQ7 3BE TQ7 3BH TQ7 3EE TQ7 3PJ TQ7 3PL TQ7 3PP TQ7 3PT TQ7 3PW TQ7 3PX |
Transport near Westville And Alvington
- FAQ
- Price Paid By Year
- Property Type Price
Frequently asked questions about Westville And Alvington
What is the average price for a property for sale in Westville And Alvington?
The average price for a property for sale in Westville And Alvington is £382,500. This amount is 23% lower than the average price in Kingsbridge. There are 382 property listings for sale in Westville And Alvington.
What streets have the most expensive properties for sale in Westville And Alvington?
The streets with the most expensive properties for sale in Westville And Alvington are Springfield Drive at an average of £850,000, Wood Lane at an average of £645,000 and Badgers Green at an average of £612,500.
What streets have the most affordable properties for sale in Westville And Alvington?
The streets with the most affordable properties for sale in Westville And Alvington are Courtlage Walk at an average of £221,666, Homelands Place at an average of £225,000 and Ilbert Road at an average of £228,750.
Which train stations are available in or near Westville And Alvington?
Some of the train stations available in or near Westville And Alvington are Ivybridge, Totnes and Paignton.
Property Price Paid in Westville And Alvington by Year
The average sold property price by year was:
| Year | Average Sold Price | Price Change |
Sold Properties
|
|---|---|---|---|
| 2025 | £378,941 | -20% |
17 Properties |
| 2024 | £455,857 | 33% |
21 Properties |
| 2023 | £304,605 | -44% |
19 Properties |
| 2022 | £439,336 | 12% |
19 Properties |
| 2021 | £385,384 | -5% |
39 Properties |
| 2020 | £403,819 | 21% |
22 Properties |
| 2019 | £319,050 | 8% |
22 Properties |
| 2018 | £291,954 | 2% |
31 Properties |
| 2017 | £285,226 | 2% |
25 Properties |
| 2016 | £280,668 | -1% |
33 Properties |
| 2015 | £282,143 | -28% |
24 Properties |
| 2014 | £361,398 | 16% |
26 Properties |
| 2013 | £303,560 | 7% |
32 Properties |
| 2012 | £280,852 | 13% |
24 Properties |
| 2011 | £244,944 | -10% |
18 Properties |
| 2010 | £269,217 | 3% |
24 Properties |
| 2009 | £260,394 | 2% |
19 Properties |
| 2008 | £256,384 | -8% |
13 Properties |
| 2007 | £275,955 | -3% |
37 Properties |
| 2006 | £282,916 | 14% |
37 Properties |
| 2005 | £244,655 | 12% |
22 Properties |
| 2004 | £215,151 | 18% |
36 Properties |
| 2003 | £175,768 | 6% |
32 Properties |
| 2002 | £165,006 | 36% |
32 Properties |
| 2001 | £105,291 | 16% |
24 Properties |
| 2000 | £88,843 | 2% |
41 Properties |
| 1999 | £86,852 | -2% |
51 Properties |
| 1998 | £88,616 | 23% |
51 Properties |
| 1997 | £68,514 | -18% |
44 Properties |
| 1996 | £80,528 | 39% |
31 Properties |
| 1995 | £48,747 | - |
17 Properties |
Property Price per Property Type in Westville And Alvington
Here you can find historic sold price data in order to help with your property search.
The average Property Paid Price for specific property types in the last three years are:
| Property Type | Average Sold Price | Sold Properties |
|---|---|---|
| Semi Detached House | £344,857.00 | 14 Semi Detached Houses |
| Detached House | £622,766.00 | 15 Detached Houses |
| Terraced House | £294,847.00 | 23 Terraced Houses |
| Flat | £170,300.00 | 5 Flats |

