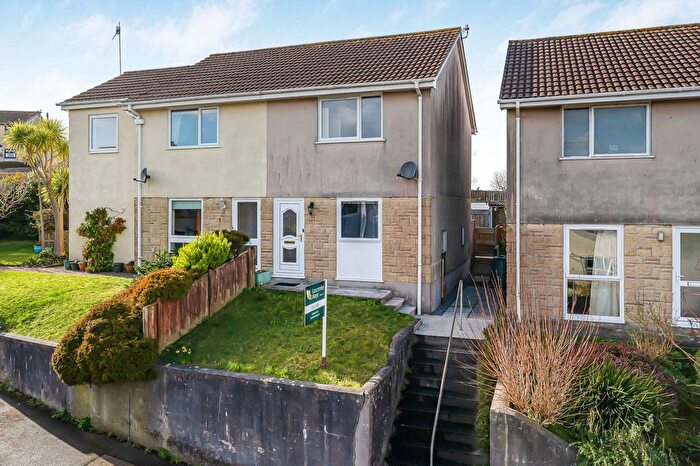
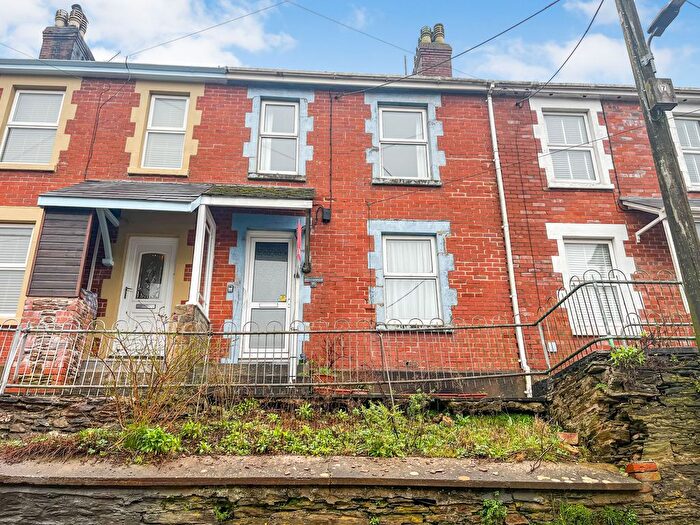
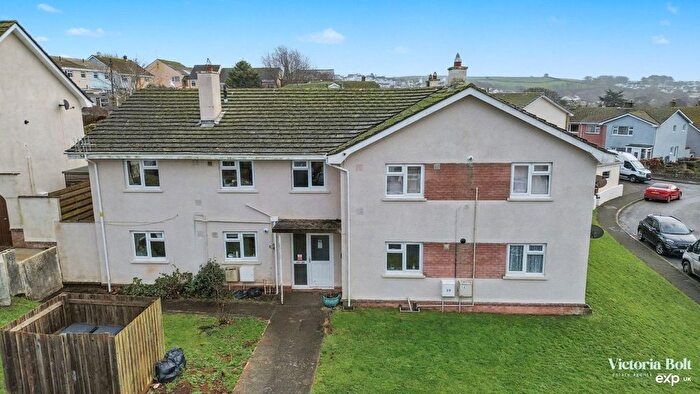
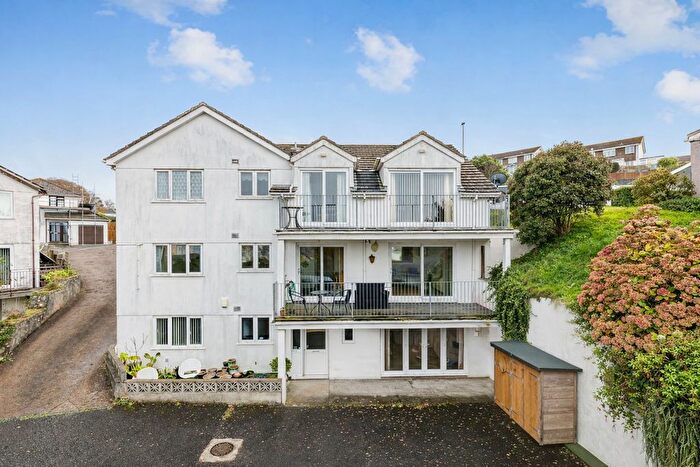
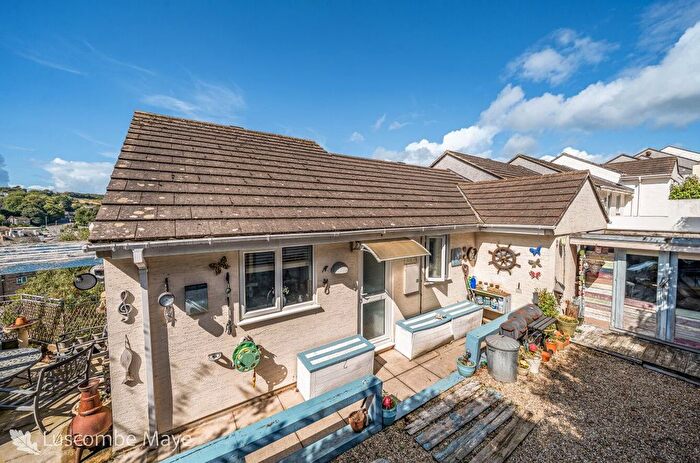
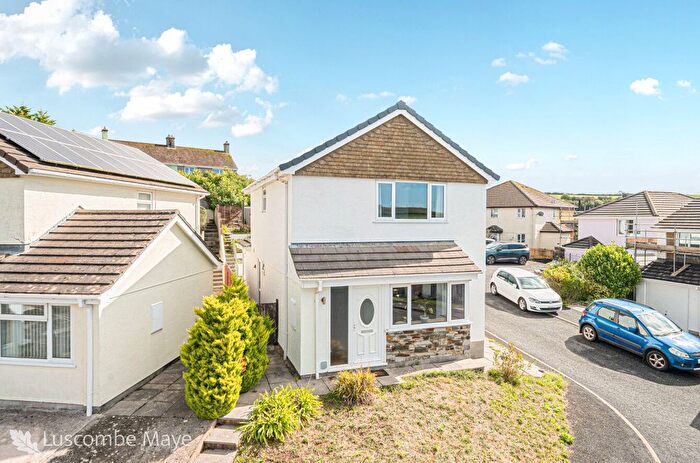
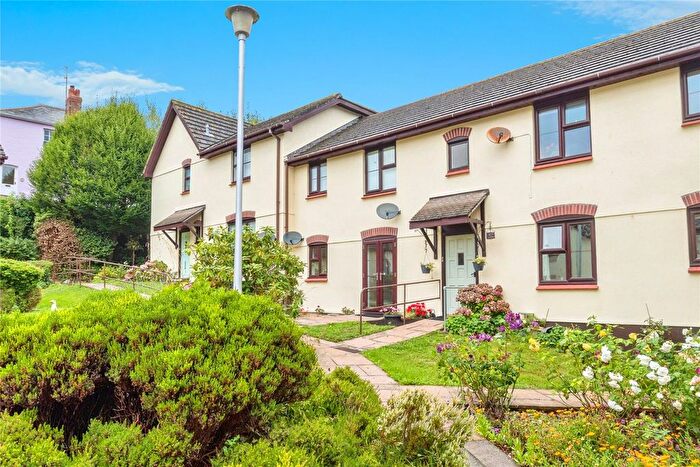
Houses for sale & to rent in Kingsbridge North, Kingsbridge
House Prices in Kingsbridge North
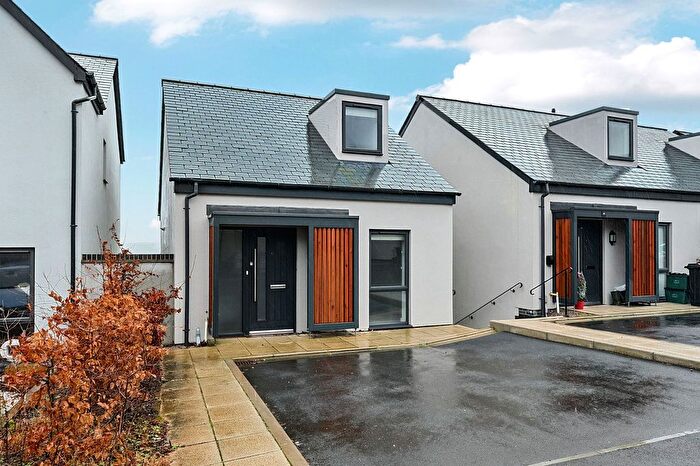
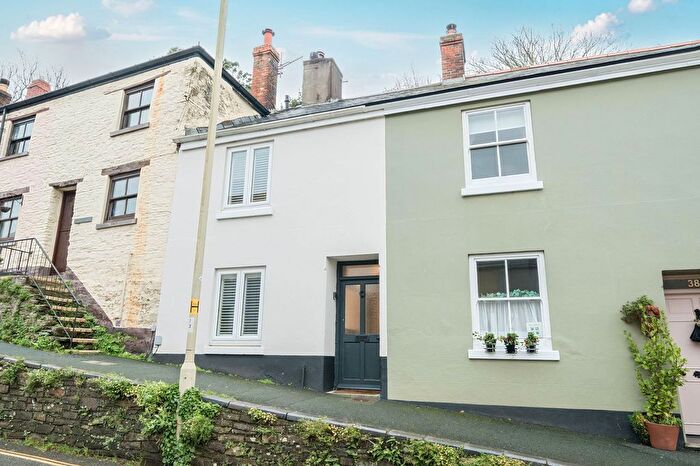
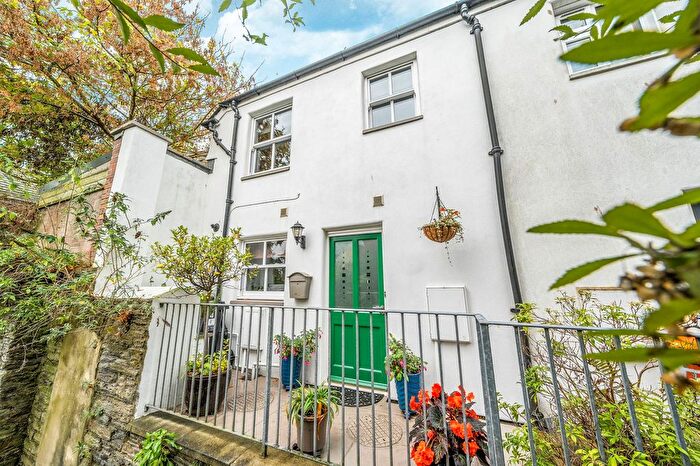
Properties in Kingsbridge North have an average house price of £326,972.00 and had 140 Property Transactions within the last 3 years¹.
Kingsbridge North is an area in Kingsbridge, Devon with 1,055 households², where the most expensive property was sold for £1,250,000.00.
Properties for sale in Kingsbridge North
Previously listed properties in Kingsbridge North
Roads and Postcodes in Kingsbridge North
Navigate through our locations to find the location of your next house in Kingsbridge North, Kingsbridge for sale or to rent.
| Streets | Postcodes |
|---|---|
| Albion Gardens | TQ7 1PS |
| Allotment Gardens | TQ7 1NT |
| Archery Close | TQ7 1BE |
| Baptist Lane | TQ7 1QD |
| Belle Cross Road | TQ7 1NL TQ7 2DY |
| Belle Hill | TQ7 1NJ |
| Belle Vue Road | TQ7 1LY |
| Buckwell Close | TQ7 1NP |
| Buckwell Road | TQ7 1NQ |
| Chapel Mews | TQ7 1NX |
| Church Close | TQ7 1BU |
| Church Mews | TQ7 1BL |
| Church Steps | TQ7 1PZ |
| Church Street | TQ7 1BT TQ7 1BY TQ7 1DB TQ7 1DD |
| Cookworthy Road | TQ7 1QN |
| Coronet Place | TQ7 1PT |
| Devon Square | TQ7 1EE |
| Duke Street | TQ7 1GB TQ7 1HU |
| Duncombe Street | TQ7 1LR TQ7 1LU |
| Eastern Back Way | TQ7 1BS TQ7 1DR |
| Ebrington Street | TQ7 1DE |
| Fore Street | TQ7 1AB TQ7 1AL TQ7 1AW TQ7 1AX TQ7 1NY TQ7 1PG TQ7 1PP TQ7 1PY |
| Fosse Road | TQ7 1NG |
| Green Close | TQ7 1NH |
| Kellands Row | TQ7 1LT |
| Khartoum Place | TQ7 1QE |
| Kings Arm Passage | TQ7 1QH |
| Kings Market | TQ7 1PR |
| Knowle Gardens | TQ7 1BA |
| Knowle House Close | TQ7 1AN |
| Knowle Terrace | TQ7 1AU |
| Leigham Terrace | TQ7 1AH TQ7 1BP |
| Lower Union Road | TQ7 1EF |
| Manor Gardens | TQ7 1BJ |
| Manor Park | TQ7 1BB |
| Matthews Passage | TQ7 1GA |
| Mill Street | TQ7 1ED |
| Montagu Close | TQ7 1AG |
| Montagu Mews | TQ7 1BH |
| Mount Pleasant Close | TQ7 1NR |
| Museum Court | TQ7 1QQ |
| Northville Park | TQ7 1AR |
| Northville Road | TQ7 1AZ |
| Orchard Industrial Estate North | TQ7 1SF |
| Plymouth Road | TQ7 1AT |
| Prince Of Wales Road | TQ7 1DX TQ7 1DY |
| Richmond Terrace | TQ7 1LS |
| Riverview Place | TQ7 1BN |
| Scholars Walk | TQ7 1QL |
| St Marco Gardens | TQ7 1NU |
| Stentiford Hill | TQ7 1BD |
| The Precinct | TQ7 1AP |
| The Promenade | TQ7 1JD |
| Trebblepark Walk | TQ7 1QR |
| Vine Terrace | TQ7 1AJ |
| Wallingford Road | TQ7 1NA TQ7 1NB TQ7 1NF |
| Waterloo Place | TQ7 1LX |
| Waterloo Road | TQ7 1LZ |
| White Hart Passage | TQ7 1QA |
| Windsor Court | TQ7 1RZ |
| Windsor Road | TQ7 1BX |
| Wistaria Place | TQ7 1BW |
| TQ7 2HF |
Transport near Kingsbridge North
- FAQ
- Price Paid By Year
- Property Type Price
Frequently asked questions about Kingsbridge North
What is the average price for a property for sale in Kingsbridge North?
The average price for a property for sale in Kingsbridge North is £326,972. This amount is 34% lower than the average price in Kingsbridge. There are 342 property listings for sale in Kingsbridge North.
What streets have the most expensive properties for sale in Kingsbridge North?
The streets with the most expensive properties for sale in Kingsbridge North are Fosse Road at an average of £780,000, Belle Cross Road at an average of £732,500 and Waterloo Place at an average of £468,750.
What streets have the most affordable properties for sale in Kingsbridge North?
The streets with the most affordable properties for sale in Kingsbridge North are Windsor Court at an average of £91,900, Wistaria Place at an average of £160,000 and Kings Market at an average of £167,000.
Which train stations are available in or near Kingsbridge North?
Some of the train stations available in or near Kingsbridge North are Ivybridge, Totnes and Paignton.
Property Price Paid in Kingsbridge North by Year
The average sold property price by year was:
| Year | Average Sold Price | Price Change |
Sold Properties
|
|---|---|---|---|
| 2025 | £348,506 | 11% |
35 Properties |
| 2024 | £308,596 | -7% |
53 Properties |
| 2023 | £331,209 | 6% |
52 Properties |
| 2022 | £312,009 | 10% |
66 Properties |
| 2021 | £279,263 | 9% |
80 Properties |
| 2020 | £253,782 | 12% |
61 Properties |
| 2019 | £223,365 | -12% |
41 Properties |
| 2018 | £249,714 | -6% |
64 Properties |
| 2017 | £263,610 | 26% |
61 Properties |
| 2016 | £194,357 | -11% |
62 Properties |
| 2015 | £216,439 | 22% |
67 Properties |
| 2014 | £168,874 | -21% |
57 Properties |
| 2013 | £204,419 | 1% |
55 Properties |
| 2012 | £201,558 | 9% |
42 Properties |
| 2011 | £182,434 | -14% |
41 Properties |
| 2010 | £208,189 | 0,1% |
56 Properties |
| 2009 | £207,903 | 0,2% |
51 Properties |
| 2008 | £207,539 | -2% |
37 Properties |
| 2007 | £211,623 | 3% |
79 Properties |
| 2006 | £204,592 | 16% |
83 Properties |
| 2005 | £172,614 | -13% |
77 Properties |
| 2004 | £195,635 | 19% |
103 Properties |
| 2003 | £158,663 | 21% |
98 Properties |
| 2002 | £125,837 | 24% |
76 Properties |
| 2001 | £95,270 | 9% |
95 Properties |
| 2000 | £86,367 | 17% |
83 Properties |
| 1999 | £71,838 | 12% |
95 Properties |
| 1998 | £62,911 | 2% |
86 Properties |
| 1997 | £61,748 | 16% |
84 Properties |
| 1996 | £52,091 | -13% |
61 Properties |
| 1995 | £58,702 | - |
42 Properties |
Property Price per Property Type in Kingsbridge North
Here you can find historic sold price data in order to help with your property search.
The average Property Paid Price for specific property types in the last three years are:
| Property Type | Average Sold Price | Sold Properties |
|---|---|---|
| Semi Detached House | £330,662.00 | 12 Semi Detached Houses |
| Detached House | £562,598.00 | 26 Detached Houses |
| Terraced House | £320,582.00 | 63 Terraced Houses |
| Flat | £179,076.00 | 39 Flats |

