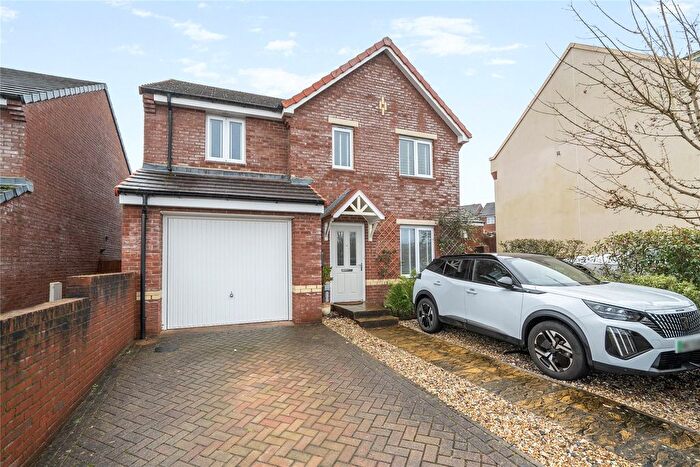
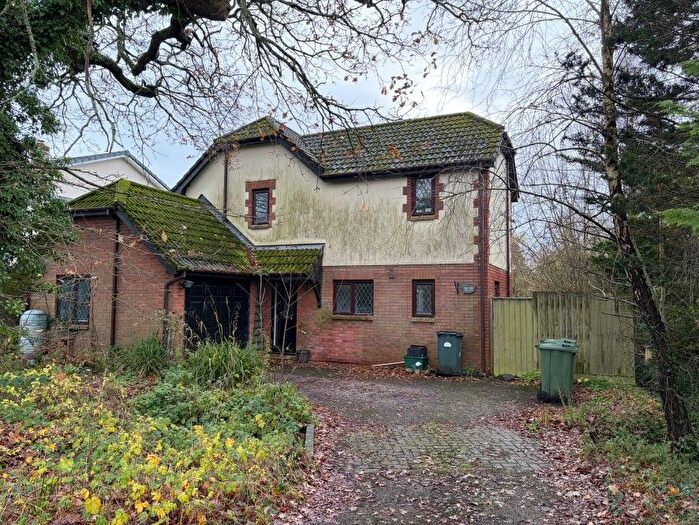
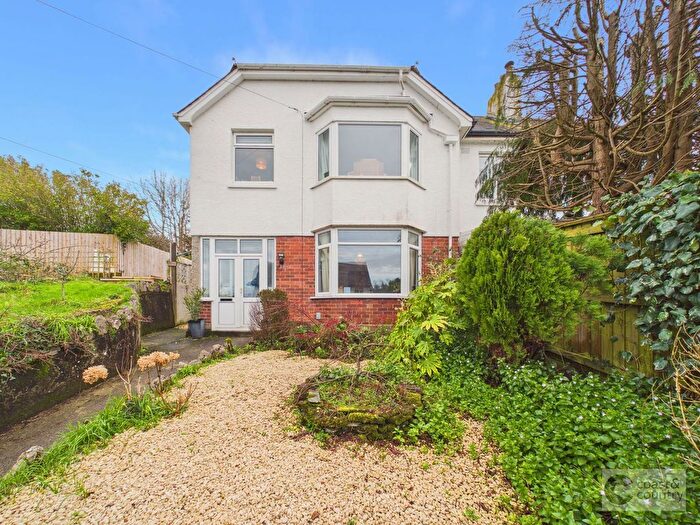
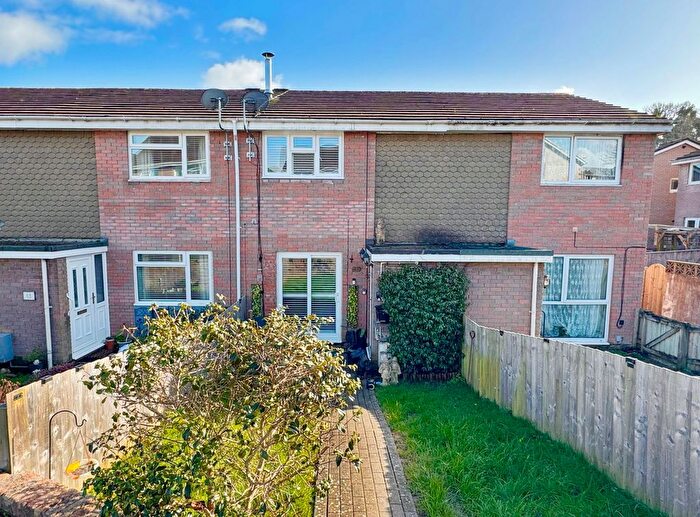
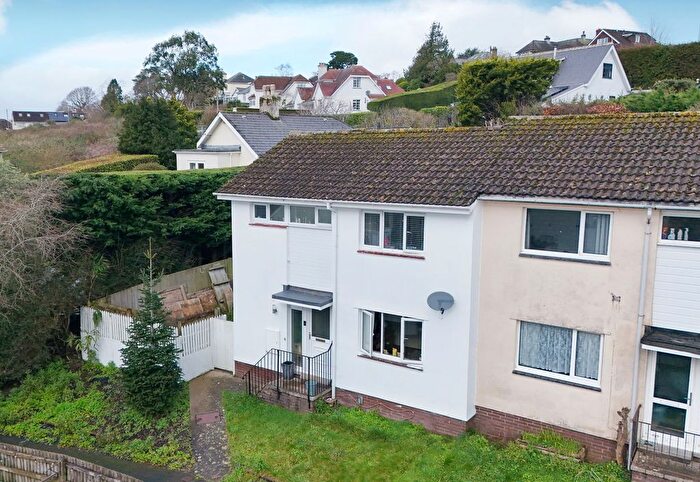
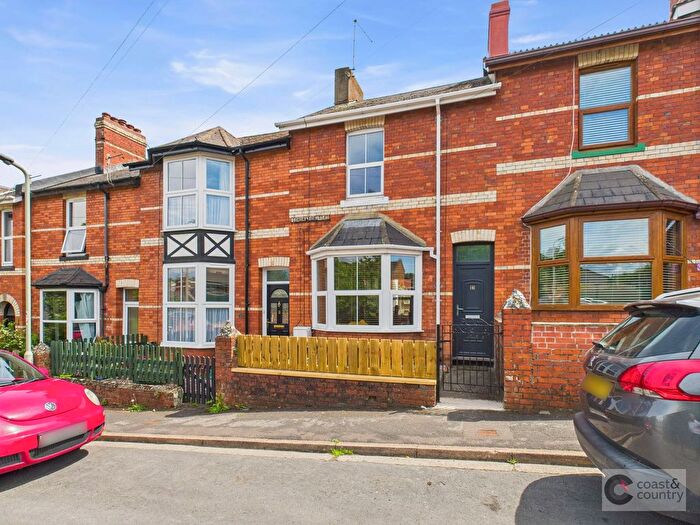
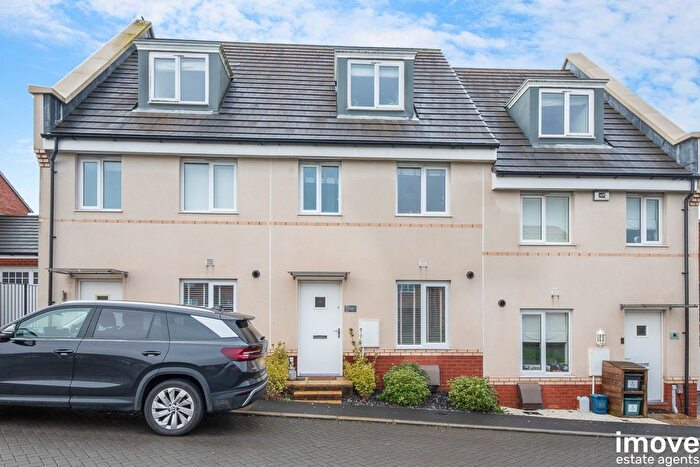
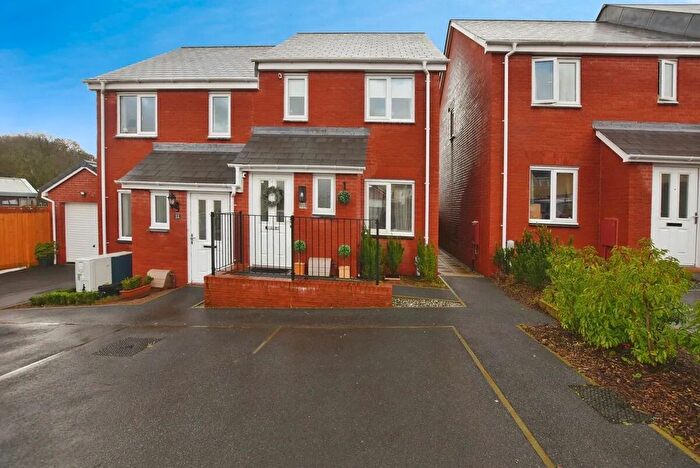
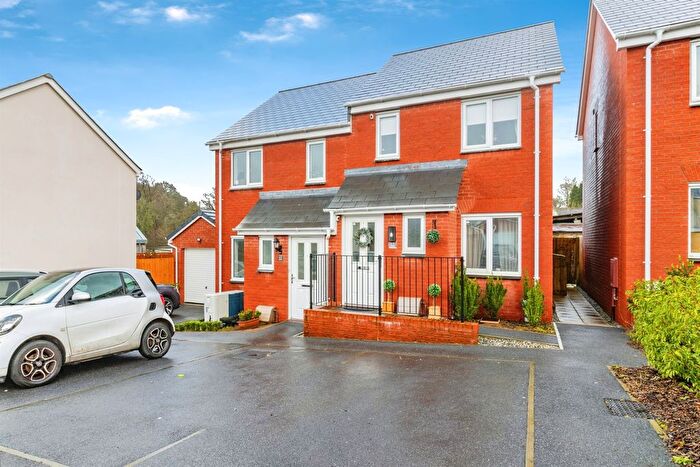
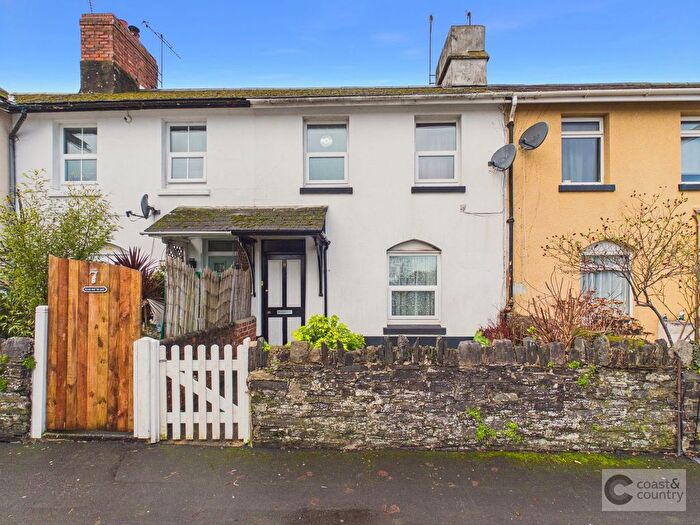
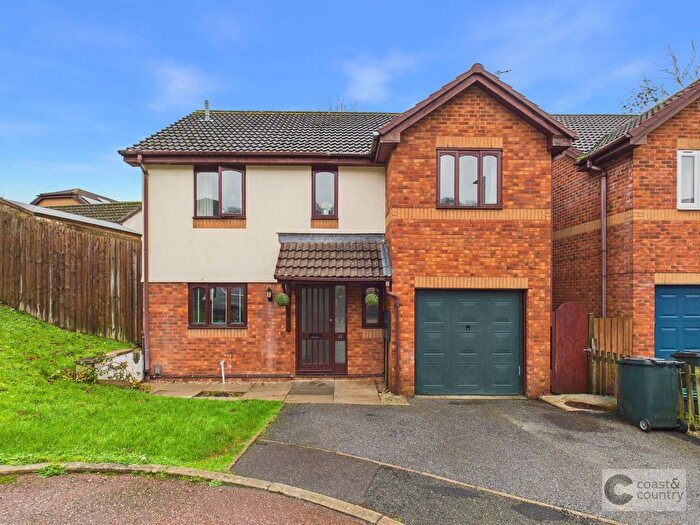
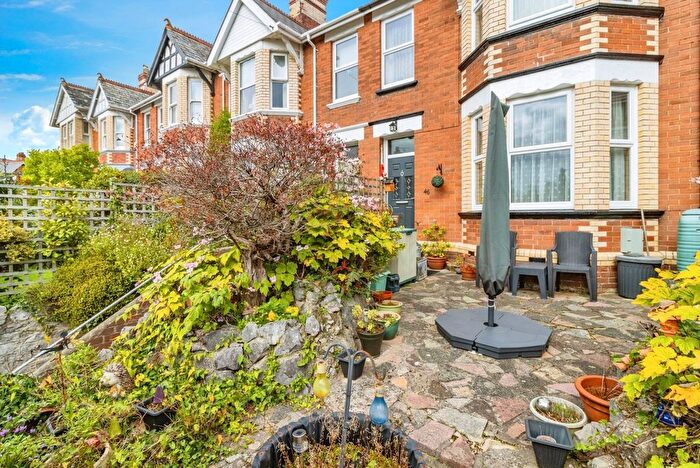
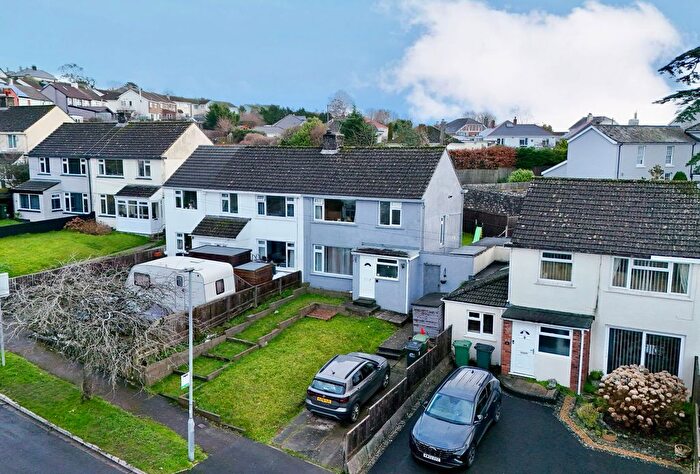
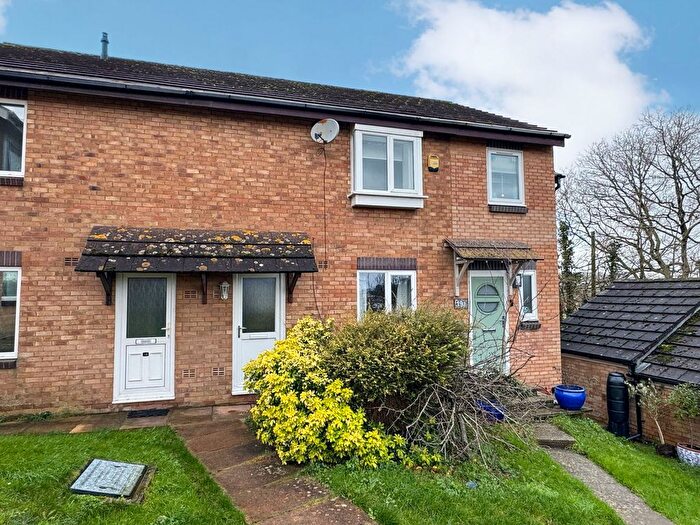
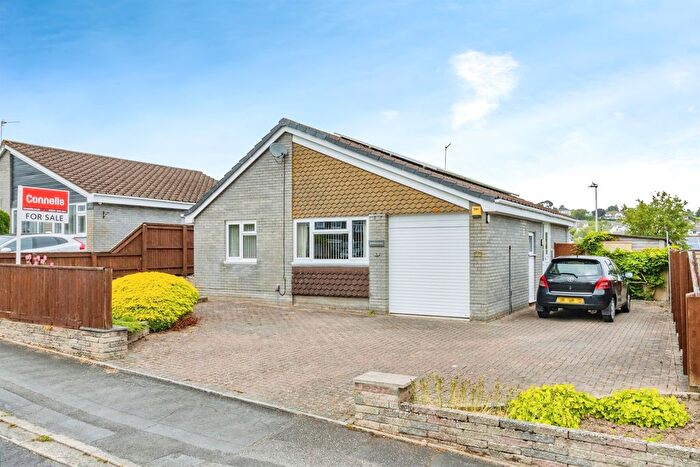
Houses for sale & to rent in Bradley, Newton Abbot
House Prices in Bradley
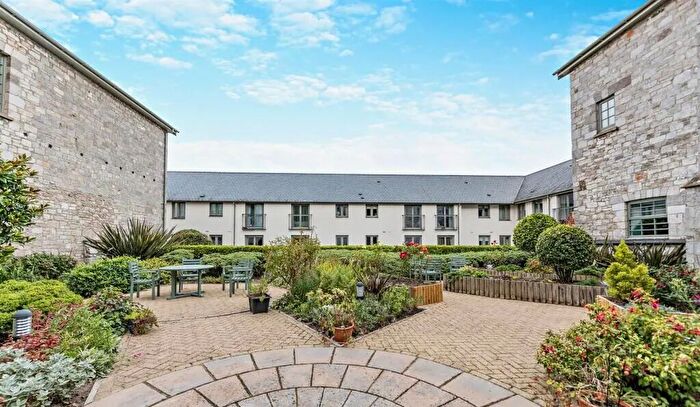
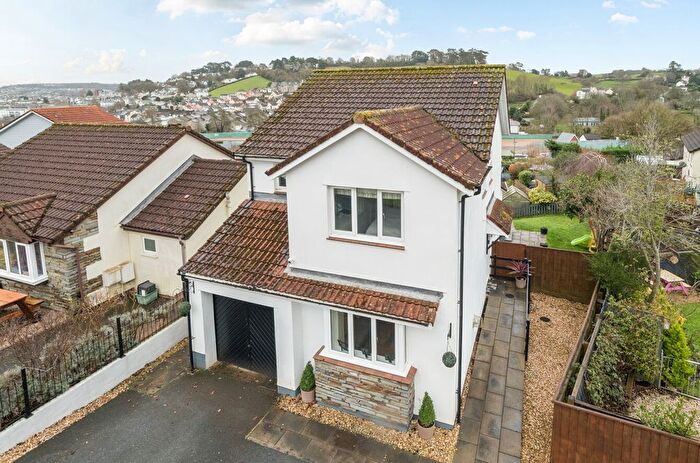
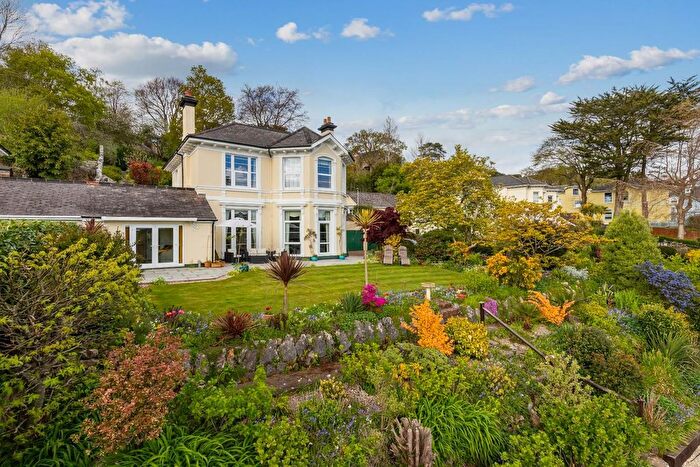
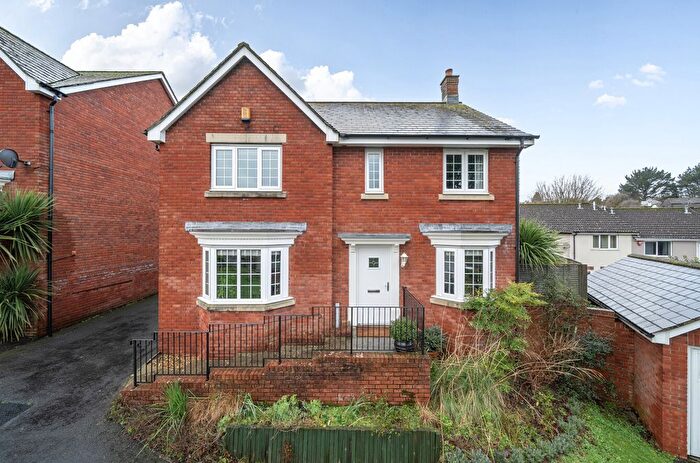
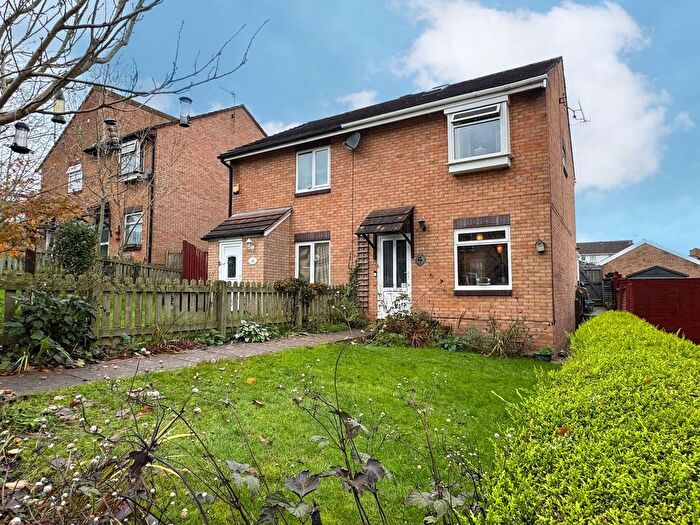
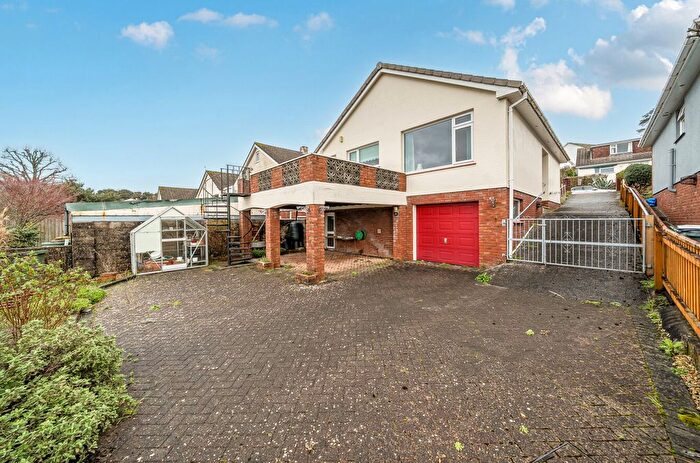
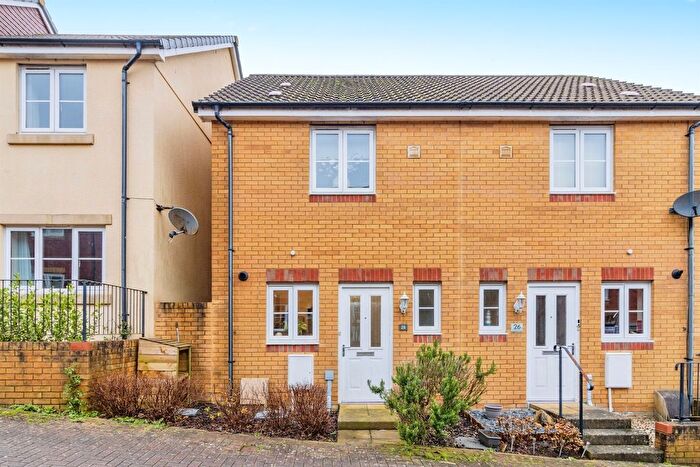
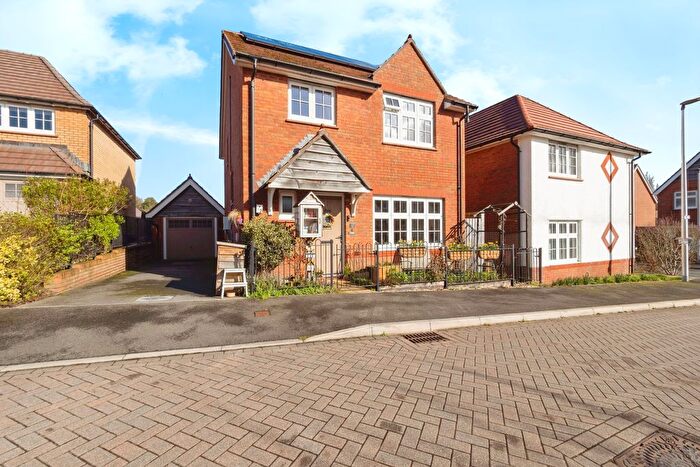
Properties in Bradley have an average house price of £298,185.00 and had 353 Property Transactions within the last 3 years¹.
Bradley is an area in Newton Abbot, Devon with 2,046 households², where the most expensive property was sold for £771,250.00.
Properties for sale in Bradley
Previously listed properties in Bradley
Roads and Postcodes in Bradley
Navigate through our locations to find the location of your next house in Bradley, Newton Abbot for sale or to rent.
| Streets | Postcodes |
|---|---|
| Applegarth Avenue | TQ12 1RP TQ12 1RU TQ12 1RY |
| Applegarth Close | TQ12 1RR |
| Ashburton Road | TQ12 1NJ TQ12 1NN TQ12 1RD TQ12 1RE TQ12 1RG TQ12 1RH TQ12 1RJ TQ12 1RL TQ12 6JN TQ12 1RB |
| Ashmill Court | TQ12 1SQ |
| Badger Lane | TQ12 6WT |
| Barton Drive | TQ12 1PD TQ12 1PL |
| Beacon Drive | TQ12 1GG |
| Belvedere Road | TQ12 1QJ |
| Berrys Wood | TQ12 1UP |
| Betony Drive | TQ12 1UA |
| Blenheim Close | TQ12 1QR |
| Bluebell Walk | TQ12 1FE |
| Bovey Road | TQ12 6PU TQ12 6QF |
| Broadridge Close | TQ12 1YE |
| Bugle Place | TQ12 1GZ |
| Burnet Road | TQ12 1GU |
| Burnley Close | TQ12 1YB |
| Burnley Road | TQ12 1YD |
| Buttercup Way | TQ12 1GT |
| Camellia Crescent | TQ12 6FP |
| Camomile Way | TQ12 1US |
| Campion Place | TQ12 1GY |
| Castle Way | TQ12 1RZ |
| Castlewood Avenue | TQ12 1NX TQ12 1NY |
| Chercombe Bridge Road | TQ12 6LT |
| Chercombe Close | TQ12 1YG |
| Chercombe Valley Road | TQ12 1UY |
| Cherrywood Close | TQ12 1RT |
| Chicory Close | TQ12 1UD |
| Clover Way | TQ12 1GE |
| Comfrey Avenue | TQ12 1BY |
| Coombeshead Road | TQ12 1PT TQ12 1PY TQ12 1PZ |
| Cornflower Way | TQ12 1SX |
| Cowslip Crescent | TQ12 1GR |
| Cranesbill Way | TQ12 1UE TQ12 1UG |
| Daggers Copse | TQ12 1UW |
| Daisy Lane | TQ12 1GW |
| Dandelion Place | TQ12 1GS |
| Eagle Crescent | TQ12 6WQ |
| Eastwood Crescent | TQ12 1NZ |
| Elmwood Avenue | TQ12 1RS |
| Emblett Drive | TQ12 1YJ |
| Exeter Road | TQ12 2SD |
| Forches Cross Road | TQ12 6QB TQ12 6PZ TQ12 6QD |
| Forest Road | TQ12 6BW TQ12 6QH |
| Foxglove Close | TQ12 1ED TQ12 1FQ |
| Foxley Crescent | TQ12 1PE |
| Foxwell Lane | TQ12 2SB |
| Gaze Hill | TQ12 1QL |
| Glebe Close | TQ12 1SS |
| Greenaway Road | TQ12 1NL |
| Greycoat Lane | TQ12 6PX |
| Harrier Place | TQ12 6WU |
| Hawkweed Close | TQ12 1WB |
| Heather Close | TQ12 1NS |
| Higher Budleigh Meadow | TQ12 1UL |
| Higher French Park | TQ12 1PQ |
| Highweek Village | TQ12 1QA TQ12 1QB TQ12 1QG TQ12 1QQ |
| Hill Park Road | TQ12 1NU |
| Holbeam Close | TQ12 1UT |
| Hollyhock Crescent | TQ12 1BP |
| Horseshoe Drive | TQ12 6WL |
| Howton Lane | TQ12 6NH TQ12 6NJ |
| Howton Road | TQ12 1QH TQ12 6NB TQ12 6NE TQ12 6NG TQ12 6ND TQ12 6NF |
| Ilford Park | TQ12 6PW |
| Kiln Orchard | TQ12 1PJ |
| Larkspur Drive | TQ12 1SD |
| Laurie Avenue | TQ12 1NW |
| Littlejoy Road | TQ12 6NA |
| Lower Budleigh Meadow | TQ12 1UJ |
| Lower French Park | TQ12 1PH |
| Lupin Way | TQ12 1FA |
| Mallow Place | TQ12 1NQ |
| Manor Road | TQ12 1SN TQ12 1SW |
| Mapleton Close | TQ12 1RF |
| Marguerite Close | TQ12 1PA |
| Marlborough Place | TQ12 1QW |
| Mayfield Crescent | TQ12 1PF |
| Meadow Rise | TQ12 1GD |
| Mellons Close | TQ12 1YF |
| Mellons Walk | TQ12 1YT |
| Mellows Meadow | TQ12 1UN |
| Middle Budleigh Meadow | TQ12 1UH |
| Mile End Road | TQ12 1RN TQ12 1RW |
| Mill Close | TQ12 1UR |
| Moorsend | TQ12 1YA |
| Nettle Close | TQ12 1GP |
| Neville Road | TQ12 1PU |
| Noctule Avenue | TQ12 6WS |
| Noelle Drive | TQ12 1PS |
| Norman Close | TQ12 1PB |
| Oak Park Road | TQ12 1RQ |
| Ogwell Mill Road | TQ12 1PG TQ12 1PR TQ12 6LS |
| Orchard Grove | TQ12 1FZ |
| Osprey Avenue | TQ12 6TE |
| Perry Lane | TQ12 6QA |
| Pipistrelle Road | TQ12 6WN |
| Pitt Hill Road | TQ12 1PX |
| Poppy Close | TQ12 1SY |
| Primrose Drive | TQ12 1GF |
| Randolph Court | TQ12 1QY |
| Ringslade Close | TQ12 1QX |
| Ringslade Road | TQ12 1QF TQ12 6PT |
| Roberts Way | TQ12 1SA |
| Roedeer Close | TQ12 1YR |
| Rosemary Avenue | TQ12 1NP TQ12 1NT |
| Serotine Close | TQ12 6WP |
| Shobbrook Hill | TQ12 1UZ |
| Snowdrop Place | TQ12 6EN |
| Sorrel Place | TQ12 1SU |
| Sovereign Road | TQ12 1YL |
| Speedwell Close | TQ12 1GN |
| Spring Close | TQ12 1YH |
| Spurge Road | TQ12 1UB |
| Stoneleigh Close | TQ12 1QZ |
| Tansy Close | TQ12 1UQ |
| Tawny Road | TQ12 6WR |
| The Churchills | TQ12 1QN |
| The Warren | TQ12 1PP |
| Thistle Close | TQ12 1ST |
| Thorn Close | TQ12 1UU |
| Thorntree Close | TQ12 1SB |
| Valerian Place | TQ12 1UX |
| Valley Path | TQ12 1YQ |
| Vetch Place | TQ12 1SZ |
| Violet Drive | TQ12 1GX |
| Western Drive | TQ12 1NR |
| Whitehill Road | TQ12 1QD TQ12 6PR TQ12 1QE |
| Wisteria Road | TQ12 6FX |
| Woodleigh Road | TQ12 1PN TQ12 1PW |
| TQ12 6BN TQ12 6NN TQ12 6NQ TQ12 6QQ TQ12 6QT |
Transport near Bradley
-
Newton Abbot Station
-
Torre Station
-
Teignmouth Station
-
Torquay Station
-
Totnes Station
-
Paignton Station
-
Dawlish Station
-
Dawlish Warren Station
- FAQ
- Price Paid By Year
- Property Type Price
Frequently asked questions about Bradley
What is the average price for a property for sale in Bradley?
The average price for a property for sale in Bradley is £298,185. This amount is 11% lower than the average price in Newton Abbot. There are 1,142 property listings for sale in Bradley.
What streets have the most expensive properties for sale in Bradley?
The streets with the most expensive properties for sale in Bradley are Ogwell Mill Road at an average of £725,000, Pitt Hill Road at an average of £600,000 and Daisy Lane at an average of £560,000.
What streets have the most affordable properties for sale in Bradley?
The streets with the most affordable properties for sale in Bradley are Mill Close at an average of £122,700, Norman Close at an average of £137,500 and Chicory Close at an average of £160,625.
Which train stations are available in or near Bradley?
Some of the train stations available in or near Bradley are Newton Abbot, Torre and Teignmouth.
Property Price Paid in Bradley by Year
The average sold property price by year was:
| Year | Average Sold Price | Price Change |
Sold Properties
|
|---|---|---|---|
| 2025 | £300,193 | 3% |
116 Properties |
| 2024 | £292,610 | -3% |
127 Properties |
| 2023 | £302,502 | -1% |
110 Properties |
| 2022 | £304,948 | -3% |
125 Properties |
| 2021 | £313,969 | 25% |
195 Properties |
| 2020 | £235,295 | -6% |
151 Properties |
| 2019 | £250,075 | -6% |
208 Properties |
| 2018 | £264,148 | 5% |
161 Properties |
| 2017 | £250,477 | 4% |
229 Properties |
| 2016 | £239,454 | -1% |
219 Properties |
| 2015 | £242,529 | -1% |
172 Properties |
| 2014 | £244,473 | 9% |
143 Properties |
| 2013 | £222,253 | 10% |
183 Properties |
| 2012 | £200,263 | -8% |
106 Properties |
| 2011 | £216,039 | 7% |
70 Properties |
| 2010 | £201,593 | 14% |
86 Properties |
| 2009 | £172,650 | -11% |
73 Properties |
| 2008 | £192,124 | -6% |
46 Properties |
| 2007 | £203,621 | 5% |
80 Properties |
| 2006 | £192,532 | 3% |
122 Properties |
| 2005 | £186,557 | 9% |
76 Properties |
| 2004 | £169,375 | 19% |
99 Properties |
| 2003 | £137,056 | 12% |
90 Properties |
| 2002 | £121,258 | 23% |
113 Properties |
| 2001 | £93,751 | 11% |
116 Properties |
| 2000 | £83,037 | 28% |
107 Properties |
| 1999 | £59,872 | -6% |
119 Properties |
| 1998 | £63,653 | 9% |
127 Properties |
| 1997 | £57,621 | 5% |
123 Properties |
| 1996 | £54,940 | 1% |
106 Properties |
| 1995 | £54,626 | - |
83 Properties |
Property Price per Property Type in Bradley
Here you can find historic sold price data in order to help with your property search.
The average Property Paid Price for specific property types in the last three years are:
| Property Type | Average Sold Price | Sold Properties |
|---|---|---|
| Flat | £157,523.00 | 21 Flats |
| Semi Detached House | £283,718.00 | 123 Semi Detached Houses |
| Detached House | £419,401.00 | 97 Detached Houses |
| Terraced House | £235,464.00 | 112 Terraced Houses |

