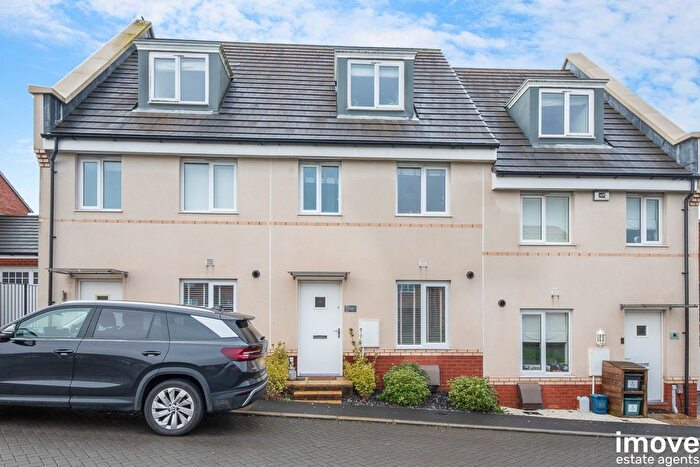
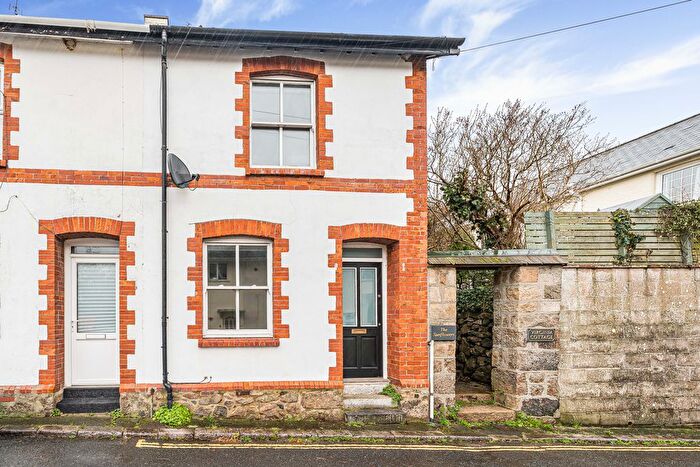
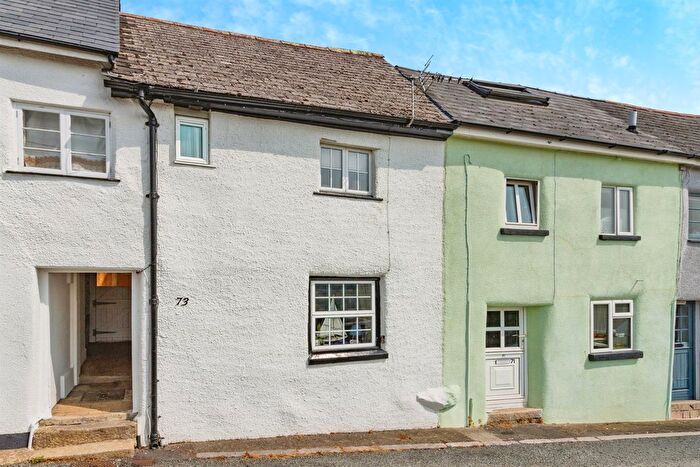
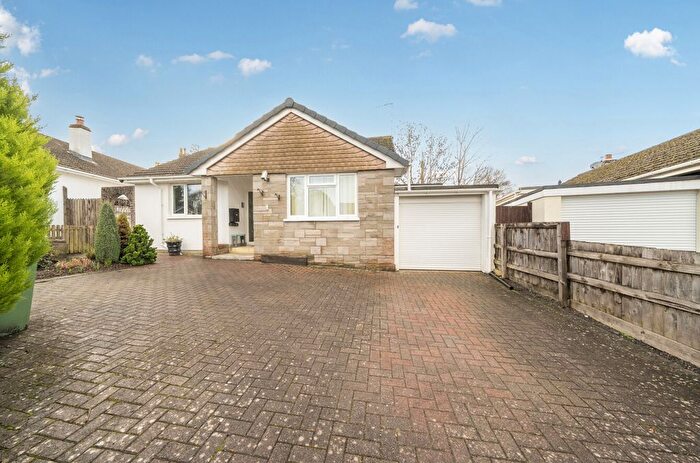
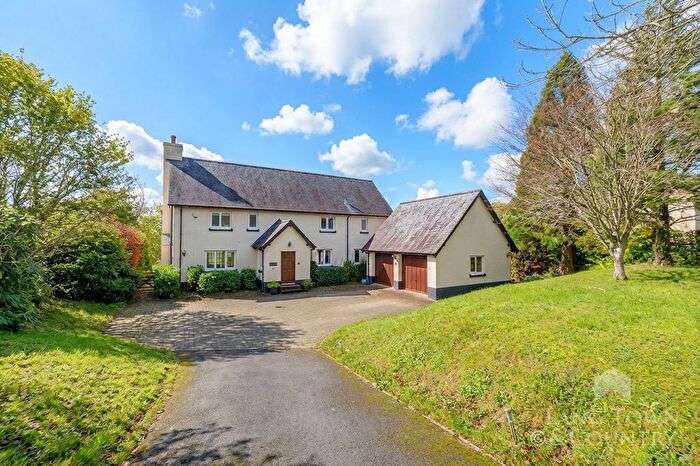
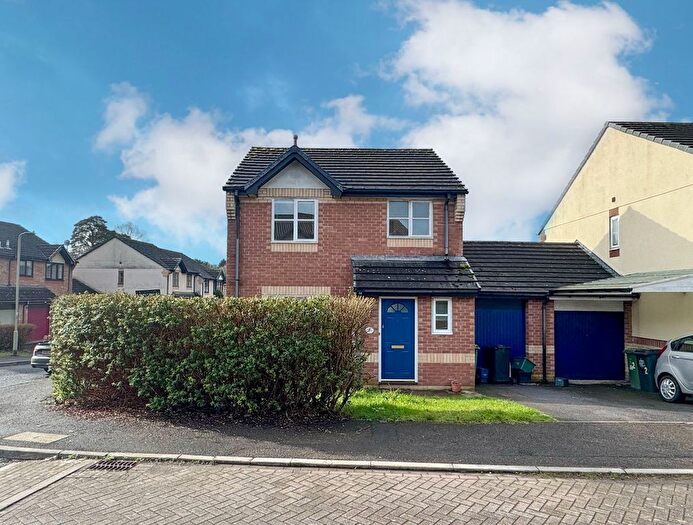
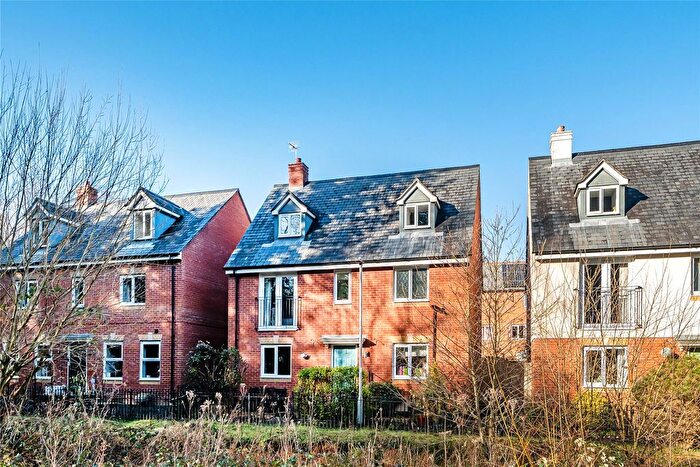
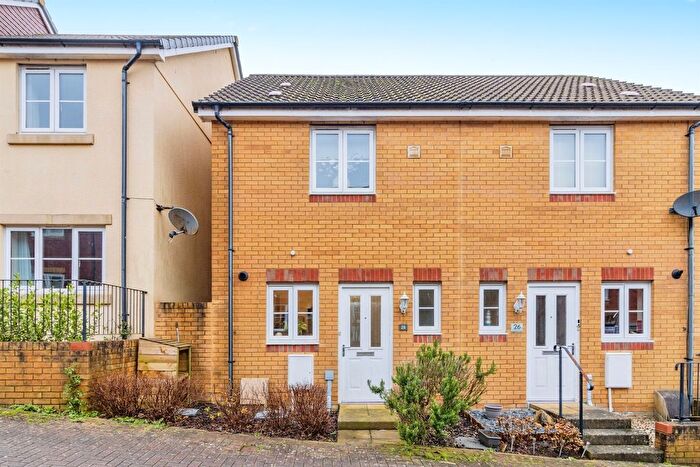
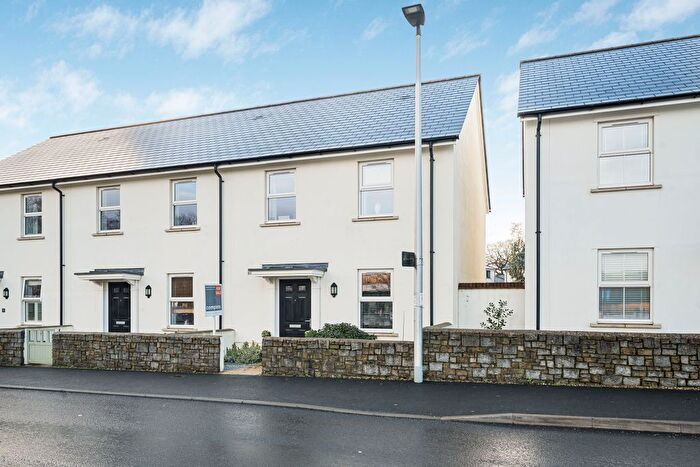
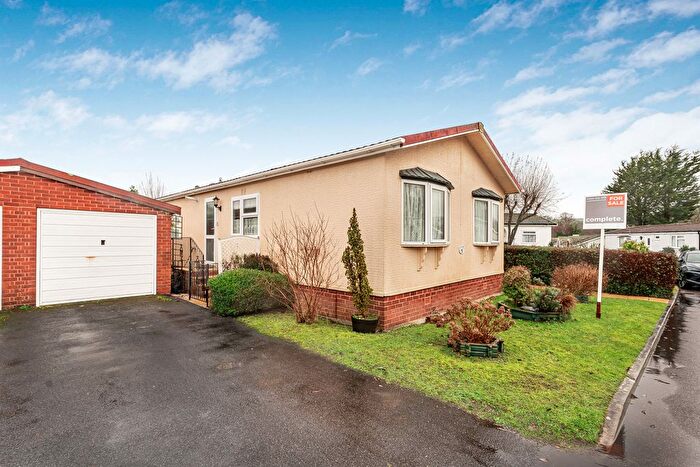
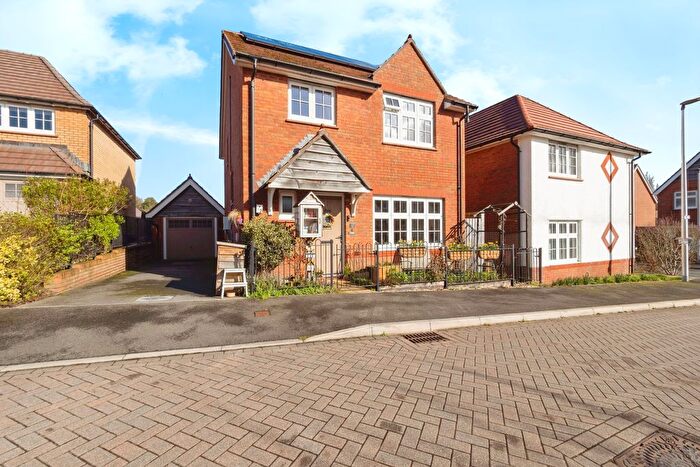
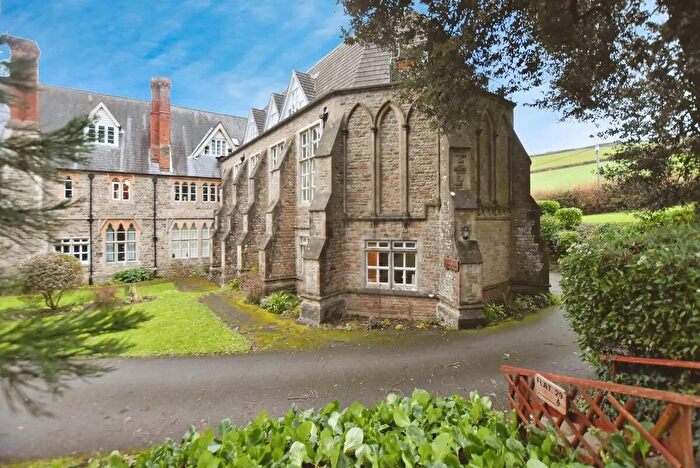
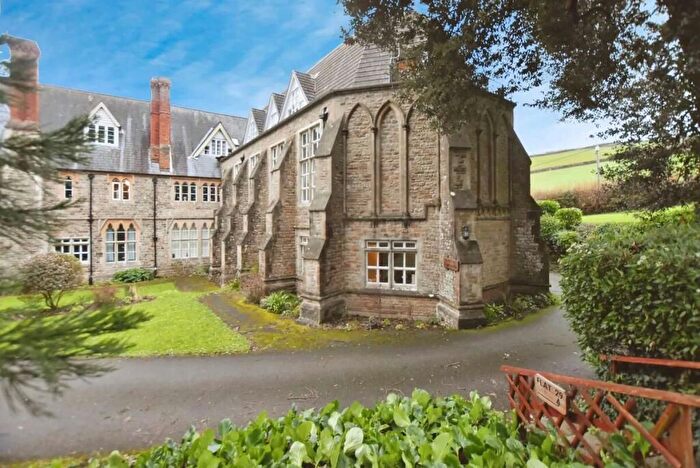
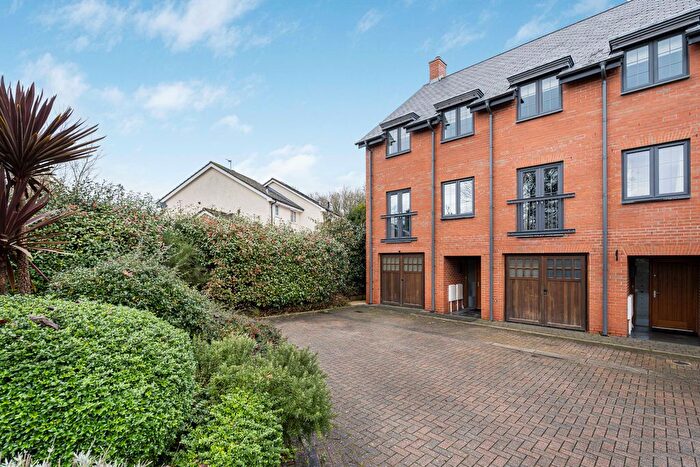
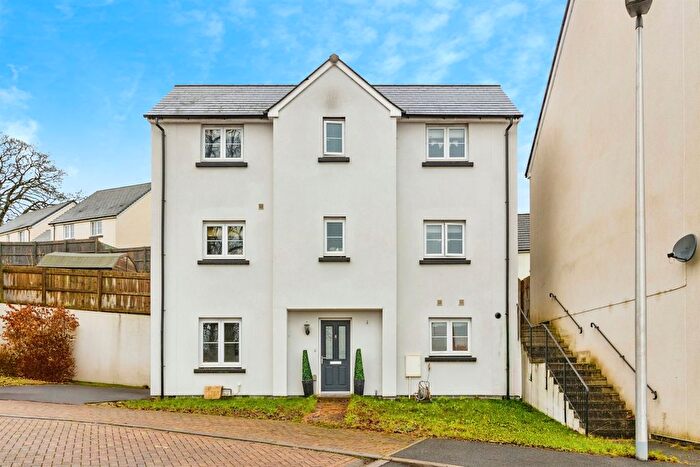
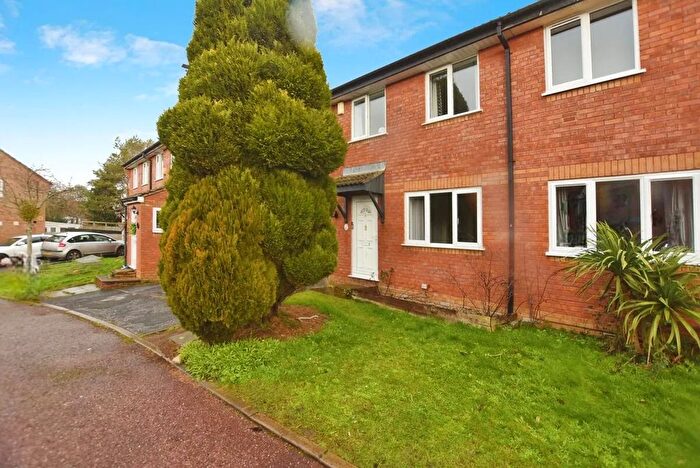
Houses for sale & to rent in Haytor, Newton Abbot
House Prices in Haytor
Properties in Haytor have an average house price of £432,200.00 and had 85 Property Transactions within the last 3 years¹.
Haytor is an area in Newton Abbot, Devon with 1,176 households², where the most expensive property was sold for £1,025,000.00.
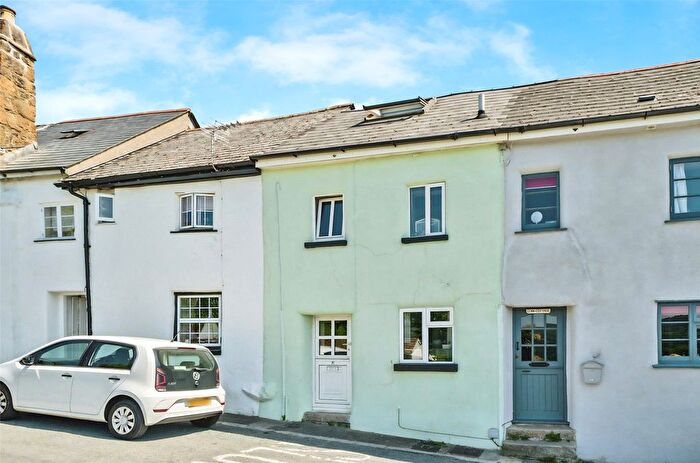
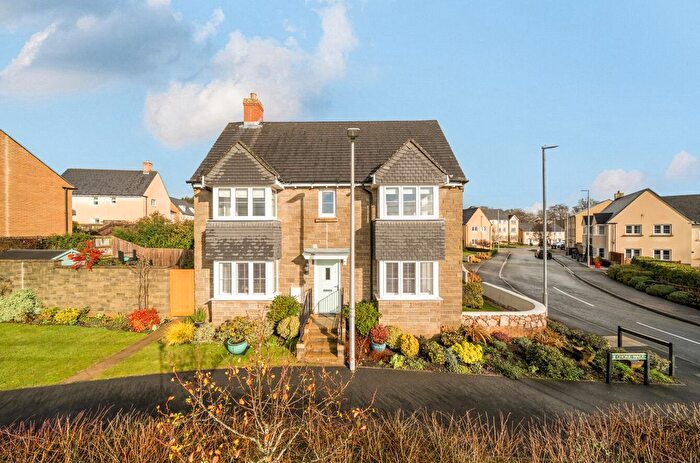
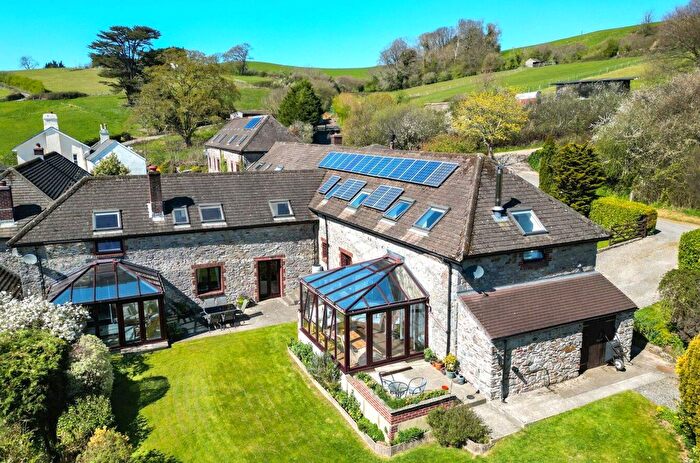
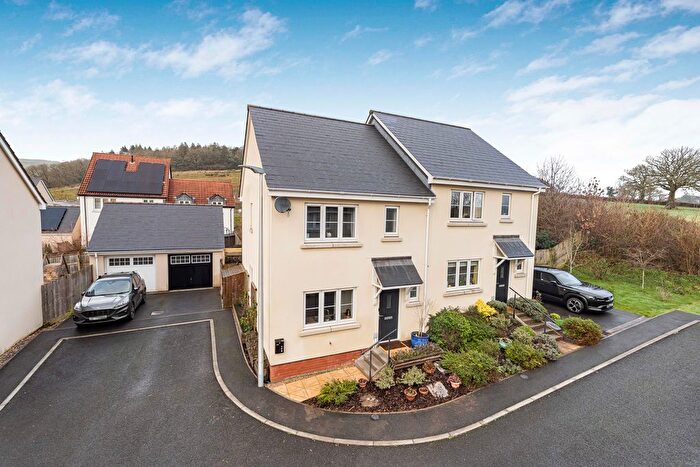
Properties for sale in Haytor
Previously listed properties in Haytor
Roads and Postcodes in Haytor
Navigate through our locations to find the location of your next house in Haytor, Newton Abbot for sale or to rent.
| Streets | Postcodes |
|---|---|
| Barn Park | TQ12 6HE |
| Beanhay Close | TQ12 6YY |
| Beaumont Close | TQ12 6UR |
| Belle Vue | TQ12 6HL |
| Benedicts Close | TQ12 6GB |
| Benedicts Road | TQ12 6JL |
| Benlears Acre | TQ12 6GF |
| Berretts Way | TQ12 6GL |
| Bickfords Green | TQ12 6GH |
| Chipley Cottages | TQ12 6NU |
| Cummings Cross | TQ12 6HJ |
| Divett Drive | TQ12 6UN |
| Exeter Cross | TQ12 6EY |
| Flowers Meadow | TQ12 6UP |
| Foundry Cottages | TQ12 6HP |
| Goodwill Cottages | TQ12 6JY |
| Green Lane | TQ13 9RB |
| Halford Cottages | TQ12 6JF |
| Haymans Cottages | TQ12 6HR |
| Haytor Court | TQ13 9XS |
| Haytor Vale | TQ13 9XP |
| Higher Brimley | TQ13 9JT TQ13 9JU |
| Honeywell Lane | TQ13 9RH |
| Ingsdon Manor | TQ12 6GA |
| Kittersley Drive | TQ12 6YX TQ12 6GZ |
| Langworthy Brook | TQ13 7JA |
| Laskeys Heath | TQ12 6PH |
| Leat Meadow | TQ12 6PJ |
| Ley Close | TQ12 6HW |
| Ley Crescent | TQ12 6JH |
| Love Lane | TQ12 6JT |
| Love Lane Cottages | TQ12 6JP |
| Manor Mead | TQ12 6JQ |
| Monro Mead | TQ12 6UL |
| Mount Hill Cottages | TQ12 6JG |
| Oaklea Park | TQ12 6YU |
| Old Hill | TQ12 6JU |
| Old Town Hill | TQ12 6HY |
| Pomeroy Place | TQ12 6UW |
| Pottery Yard | TQ12 6LR |
| Rowells Mead | TQ12 6PL |
| Seymour Caravan Park | TQ12 6HA |
| Shapley Way | TQ12 6PN |
| Sigford Cottages | TQ12 6LF |
| Simms Hill | TQ13 9RQ |
| Simms View | TQ13 9RP |
| St Michaels Cottages | TQ13 9RJ |
| Summerhill | TQ12 6HD |
| Summerhill Close | TQ12 6JJ |
| Summerhill Crescent | TQ12 6HG |
| Summerhill Road | TQ12 6HF |
| Summerlands Court | TQ12 6HB |
| Taylors Newtake | TQ12 6UJ |
| The Village | TQ13 9RL |
| Town Meadow | TQ13 9RY |
| Trumpeter Cottages | TQ13 9RA |
| TQ12 6HH TQ12 6HN TQ12 6HQ TQ12 6HS TQ12 6HU TQ12 6HX TQ12 6HZ TQ12 6JA TQ12 6JD TQ12 6JE TQ12 6JR TQ12 6JS TQ12 6JW TQ12 6JX TQ12 6JZ TQ12 6LA TQ12 6LB TQ12 6LD TQ12 6LE TQ12 6NL TQ12 6NP TQ12 6NR TQ12 6NS TQ12 6NT TQ12 6NW TQ12 6NX TQ12 6PD TQ12 6PG TQ12 6PQ TQ13 9RD TQ13 9RE TQ13 9RF TQ13 9RG TQ13 9RN TQ13 9RR TQ13 9RS TQ13 9RT TQ13 9RU TQ13 9RW TQ13 9RX TQ13 9XR TQ13 9XT TQ13 9XU TQ13 9XX TQ13 9XY TQ12 6AB TQ12 6EZ TQ12 6FU TQ12 6HT TQ12 6JB TQ12 6QE TQ13 7JB TQ13 9JR |
Transport near Haytor
- FAQ
- Price Paid By Year
- Property Type Price
Frequently asked questions about Haytor
What is the average price for a property for sale in Haytor?
The average price for a property for sale in Haytor is £432,200. This amount is 28% higher than the average price in Newton Abbot. There are 727 property listings for sale in Haytor.
What streets have the most expensive properties for sale in Haytor?
The streets with the most expensive properties for sale in Haytor are Town Meadow at an average of £650,000, Beaumont Close at an average of £484,333 and Bickfords Green at an average of £480,000.
What streets have the most affordable properties for sale in Haytor?
The streets with the most affordable properties for sale in Haytor are Cummings Cross at an average of £221,666, Laskeys Heath at an average of £280,300 and Oaklea Park at an average of £282,500.
Which train stations are available in or near Haytor?
Some of the train stations available in or near Haytor are Newton Abbot, Totnes and Teignmouth.
Property Price Paid in Haytor by Year
The average sold property price by year was:
| Year | Average Sold Price | Price Change |
Sold Properties
|
|---|---|---|---|
| 2025 | £435,795 | 5% |
22 Properties |
| 2024 | £414,074 | -7% |
27 Properties |
| 2023 | £443,597 | -7% |
36 Properties |
| 2022 | £474,765 | 15% |
46 Properties |
| 2021 | £401,853 | -5% |
55 Properties |
| 2020 | £421,075 | 15% |
37 Properties |
| 2019 | £359,983 | 2% |
50 Properties |
| 2018 | £353,355 | 6% |
43 Properties |
| 2017 | £332,111 | -4% |
48 Properties |
| 2016 | £345,188 | 8% |
58 Properties |
| 2015 | £317,616 | 2% |
47 Properties |
| 2014 | £312,208 | 4% |
56 Properties |
| 2013 | £300,822 | -16% |
45 Properties |
| 2012 | £347,907 | 20% |
39 Properties |
| 2011 | £279,334 | -14% |
36 Properties |
| 2010 | £317,741 | -4% |
41 Properties |
| 2009 | £330,822 | 8% |
31 Properties |
| 2008 | £305,299 | 4% |
21 Properties |
| 2007 | £294,066 | 3% |
52 Properties |
| 2006 | £284,157 | -7% |
64 Properties |
| 2005 | £305,329 | 19% |
47 Properties |
| 2004 | £245,886 | 10% |
66 Properties |
| 2003 | £222,192 | 17% |
41 Properties |
| 2002 | £185,353 | 17% |
82 Properties |
| 2001 | £153,389 | 12% |
74 Properties |
| 2000 | £134,692 | 11% |
69 Properties |
| 1999 | £120,373 | 12% |
82 Properties |
| 1998 | £106,233 | 15% |
84 Properties |
| 1997 | £90,516 | 1% |
72 Properties |
| 1996 | £89,355 | -5% |
66 Properties |
| 1995 | £93,406 | - |
33 Properties |
Property Price per Property Type in Haytor
Here you can find historic sold price data in order to help with your property search.
The average Property Paid Price for specific property types in the last three years are:
| Property Type | Average Sold Price | Sold Properties |
|---|---|---|
| Semi Detached House | £391,000.00 | 21 Semi Detached Houses |
| Detached House | £478,686.00 | 51 Detached Houses |
| Terraced House | £332,090.00 | 11 Terraced Houses |
| Flat | £230,000.00 | 2 Flats |

