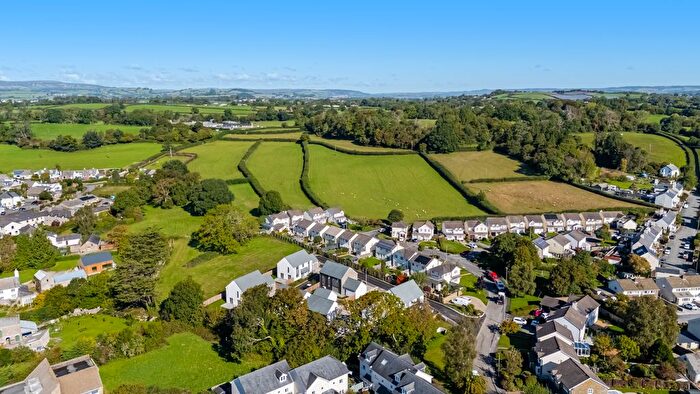
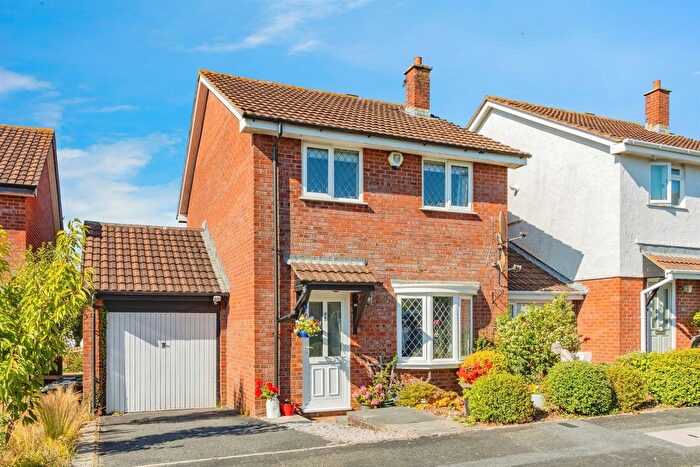
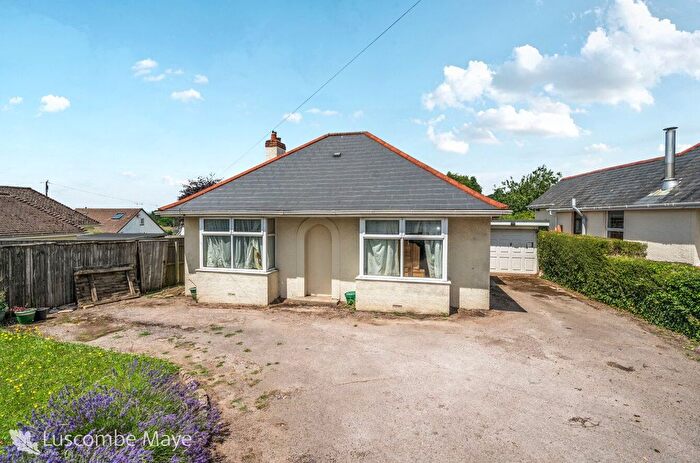
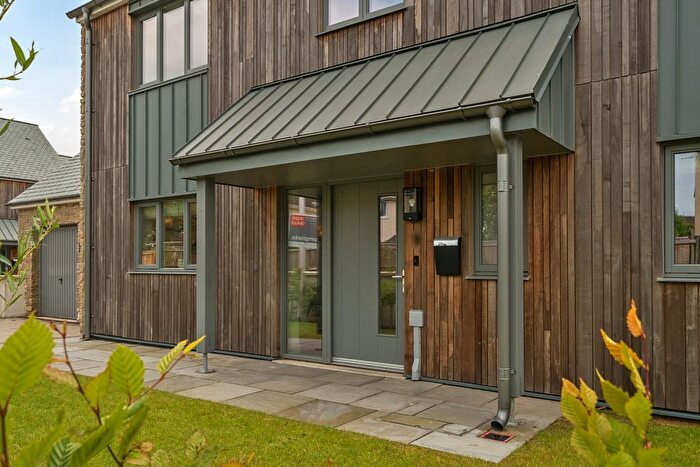
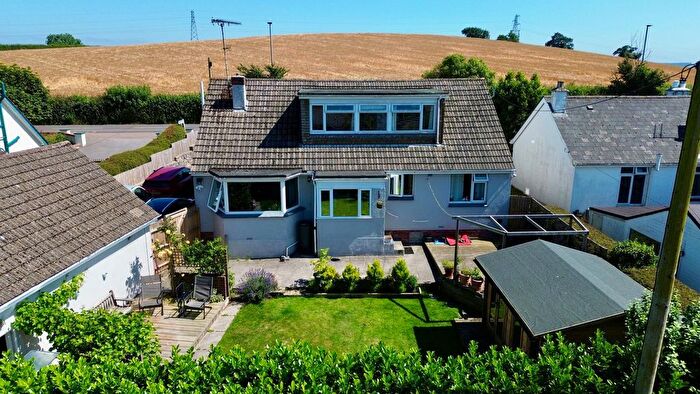
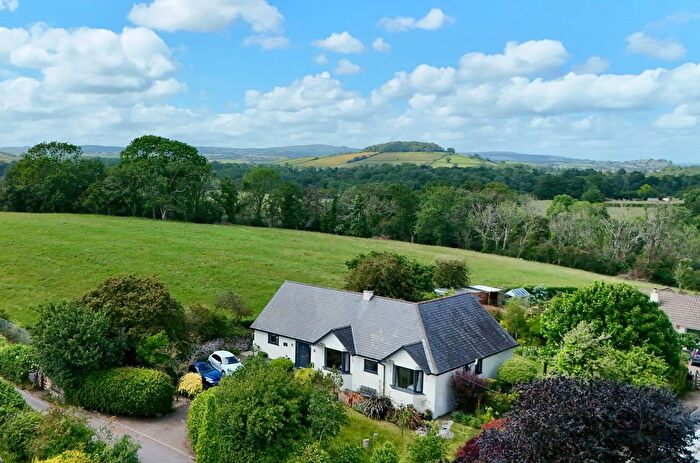
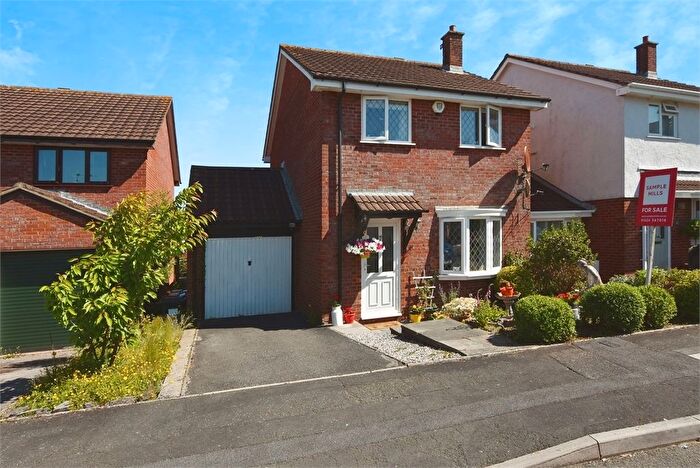
Houses for sale & to rent in Ipplepen, Newton Abbot
House Prices in Ipplepen
Properties in Ipplepen have an average house price of £405,735.00 and had 111 Property Transactions within the last 3 years¹.
Ipplepen is an area in Newton Abbot, Devon with 1,062 households², where the most expensive property was sold for £1,215,000.00.
Properties for sale in Ipplepen
Previously listed properties in Ipplepen
Roads and Postcodes in Ipplepen
Navigate through our locations to find the location of your next house in Ipplepen, Newton Abbot for sale or to rent.
| Streets | Postcodes |
|---|---|
| Barn Park Close | TQ12 5SZ |
| Barn Park Cottages | TQ12 5SY |
| Beech Drive | TQ12 5QR |
| Biltor Road | TQ12 5QL |
| Blackstone | TQ12 5QN TQ12 5TG |
| Bowden Road | TQ12 5QT |
| Bridge Street | TQ12 5SE TQ12 5SF TQ12 5UY |
| Brook Road | TQ12 5SQ |
| Bulleigh Barton Court | TQ12 5UA |
| Buttlands Industrial Estate | TQ12 5UE |
| Caunters Close | TQ12 5TL |
| Causeway | TQ12 5TF |
| Causeway Cross | TQ12 5TB |
| Church Path | TQ12 5RZ |
| Clampitt Close | TQ12 5RL |
| Clampitt Road | TQ12 5QW TQ12 5RJ TQ12 5TE |
| Clarendon Road | TQ12 5QS TQ12 5SP |
| Conniford Lane | TQ12 5UD |
| Cooke Drive | TQ12 5QX |
| Court Gate Close | TQ12 5QH |
| Croft Meadow | TQ12 5RE |
| Croft Orchard | TQ12 5RA |
| Croft Road | TQ12 5SS TQ12 5ST |
| Crokers Way | TQ12 5QZ |
| Dornafield Close | TQ12 5SN |
| Dornafield Drive East | TQ12 5YH TQ12 5YN |
| Dornafield Drive West | TQ12 5SL |
| Dornafield Lane | TQ12 5TS |
| Dornafield Road | TQ12 5SG TQ12 5SH TQ12 5SJ |
| East Street | TQ12 5SU |
| Edgelands Lane | TQ12 5QG TQ12 5UF TQ12 5UG |
| Fore Street | TQ12 5RH TQ12 5RP TQ12 5RS TQ12 5RR |
| Fulton Close | TQ12 5YJ |
| Grange Close | TQ12 5RX |
| Holman Hill | TQ12 5TX |
| Ipplepen Road | TQ12 5UX |
| Lang Way | TQ12 5QU |
| Ledsgrove | TQ12 5QY |
| Luscombe Close | TQ12 5QJ |
| Marldon Road | TQ12 5TY |
| Mayfair Road | TQ12 5RN |
| Meadow Park | TQ12 5YL |
| Moor Road | TQ12 5TT TQ12 5FZ |
| Motehole Road | TQ12 5SR |
| Newhayes | TQ12 5SD |
| North End Close | TQ12 5TJ |
| North Street | TQ12 5RQ TQ12 5RT |
| Orchard Drive | TQ12 5QP |
| Orley Road | TQ12 5SA TQ12 5UT |
| Osborn Close | TQ12 5XB |
| Park Hill | TQ12 5TU |
| Paternoster Lane | TQ12 5RY |
| Poplar Terrace | TQ12 5RW |
| Rose Gardens | TQ12 5US |
| Silver Street | TQ12 5QQ TQ12 5SB TQ12 5QA |
| St Marys Place | TQ12 5FF |
| The Glebe | TQ12 5TQ |
| Thorn Orchard | TQ12 5RG |
| Totnes Road | TQ12 5TD TQ12 5TN TQ12 5FP |
| Townsend Hill | TQ12 5RU |
| Tremlett Grove | TQ12 5BZ |
| Wesley Terrace | TQ12 5SX |
| Wesley View | TQ12 5SW |
| Wrigwell Lane | TQ12 5UB |
| TQ12 5TA TQ12 5TZ TQ12 5UJ TQ12 5UL TQ12 5UN TQ12 5UQ TQ12 6DD TQ12 6DE TQ12 5LL TQ12 5TP |
Transport near Ipplepen
- FAQ
- Price Paid By Year
- Property Type Price
Frequently asked questions about Ipplepen
What is the average price for a property for sale in Ipplepen?
The average price for a property for sale in Ipplepen is £405,735. This amount is 21% higher than the average price in Newton Abbot. There are 153 property listings for sale in Ipplepen.
What streets have the most expensive properties for sale in Ipplepen?
The streets with the most expensive properties for sale in Ipplepen are Paternoster Lane at an average of £1,215,000, Orley Road at an average of £762,500 and East Street at an average of £751,250.
What streets have the most affordable properties for sale in Ipplepen?
The streets with the most affordable properties for sale in Ipplepen are Causeway at an average of £205,000, Croft Road at an average of £235,000 and Brook Road at an average of £256,500.
Which train stations are available in or near Ipplepen?
Some of the train stations available in or near Ipplepen are Newton Abbot, Torre and Totnes.
Property Price Paid in Ipplepen by Year
The average sold property price by year was:
| Year | Average Sold Price | Price Change |
Sold Properties
|
|---|---|---|---|
| 2025 | £424,679 | 5% |
33 Properties |
| 2024 | £403,060 | 3% |
37 Properties |
| 2023 | £392,902 | -10% |
41 Properties |
| 2022 | £430,671 | 10% |
40 Properties |
| 2021 | £386,753 | 7% |
47 Properties |
| 2020 | £359,749 | 12% |
40 Properties |
| 2019 | £317,117 | 1% |
47 Properties |
| 2018 | £314,272 | 4% |
40 Properties |
| 2017 | £302,643 | -1% |
31 Properties |
| 2016 | £306,333 | 8% |
39 Properties |
| 2015 | £282,374 | 2% |
47 Properties |
| 2014 | £276,760 | 18% |
55 Properties |
| 2013 | £226,017 | 4% |
40 Properties |
| 2012 | £216,974 | -11% |
39 Properties |
| 2011 | £239,761 | -18% |
34 Properties |
| 2010 | £283,905 | 21% |
32 Properties |
| 2009 | £225,654 | -13% |
33 Properties |
| 2008 | £254,645 | -0,1% |
22 Properties |
| 2007 | £254,985 | 10% |
47 Properties |
| 2006 | £229,568 | 4% |
44 Properties |
| 2005 | £219,797 | -16% |
41 Properties |
| 2004 | £254,551 | 28% |
46 Properties |
| 2003 | £182,306 | 5% |
54 Properties |
| 2002 | £172,744 | 24% |
55 Properties |
| 2001 | £131,316 | 26% |
73 Properties |
| 2000 | £97,583 | 12% |
50 Properties |
| 1999 | £86,189 | 1% |
65 Properties |
| 1998 | £85,316 | 21% |
55 Properties |
| 1997 | £67,019 | -12% |
65 Properties |
| 1996 | £75,025 | 14% |
50 Properties |
| 1995 | £64,595 | - |
43 Properties |
Property Price per Property Type in Ipplepen
Here you can find historic sold price data in order to help with your property search.
The average Property Paid Price for specific property types in the last three years are:
| Property Type | Average Sold Price | Sold Properties |
|---|---|---|
| Semi Detached House | £374,050.00 | 35 Semi Detached Houses |
| Detached House | £487,086.00 | 51 Detached Houses |
| Terraced House | £288,270.00 | 24 Terraced Houses |
| Flat | £185,000.00 | 1 Flat |

