
Houses for sale in Ambrook, Totnes
House Prices in Ambrook
Properties in Ambrook have an average house price of £798k and had 28 Property Transactions within the last 3 years¹.
Ambrook is an area in Totnes, Devon with 279 households², where the most expensive property was sold for £2.13M.
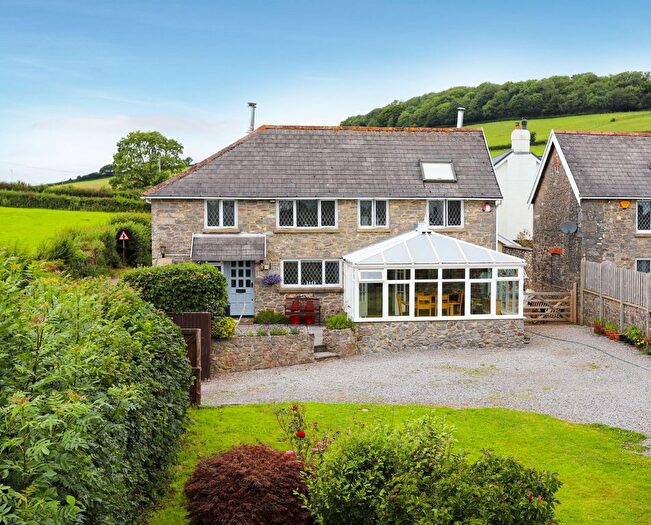
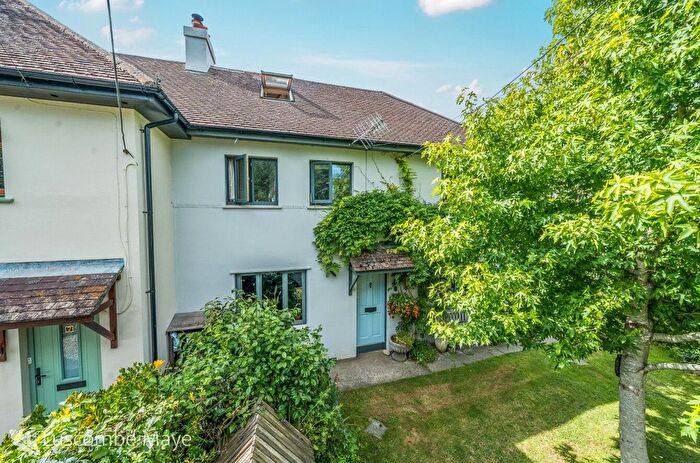
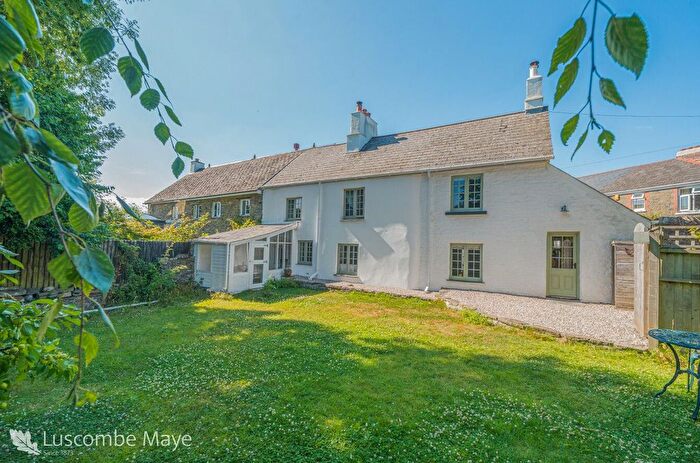
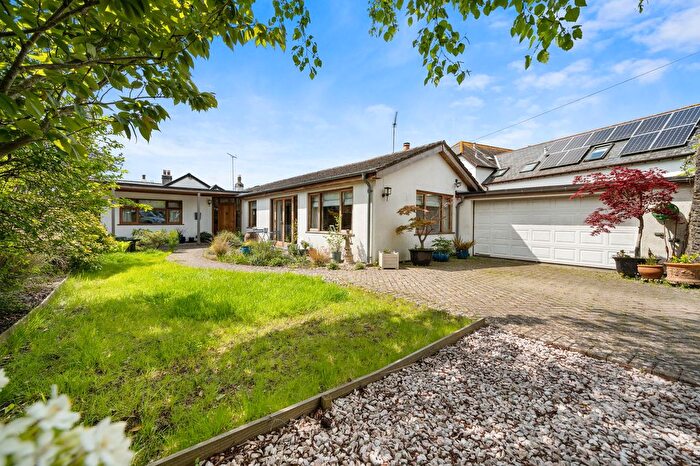
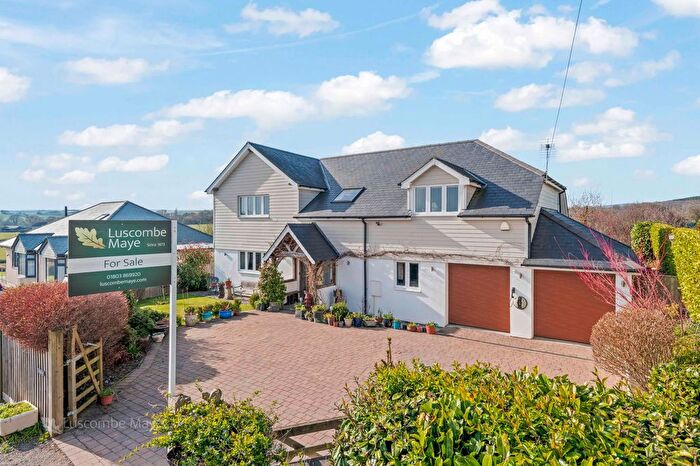
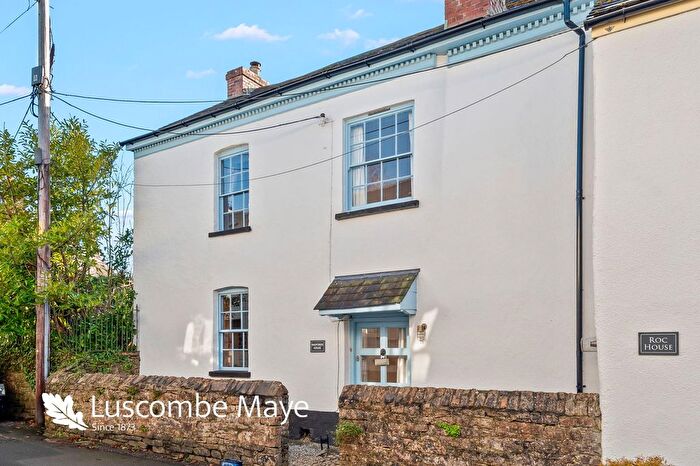
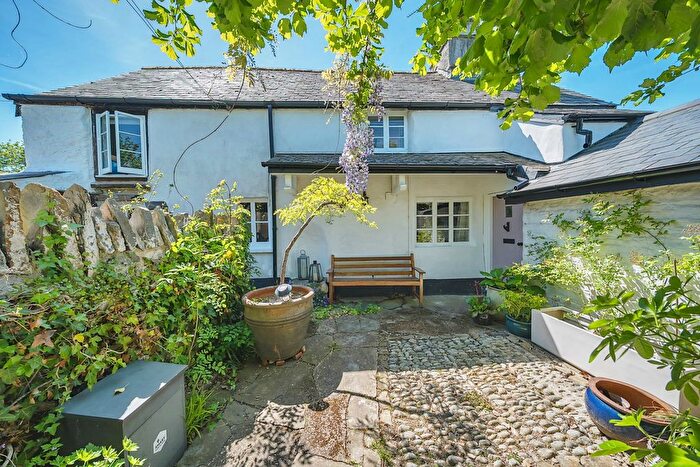
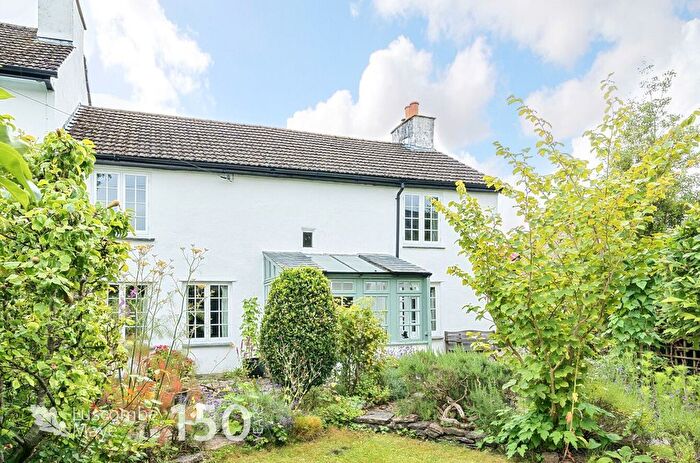
Previously listed properties in Ambrook
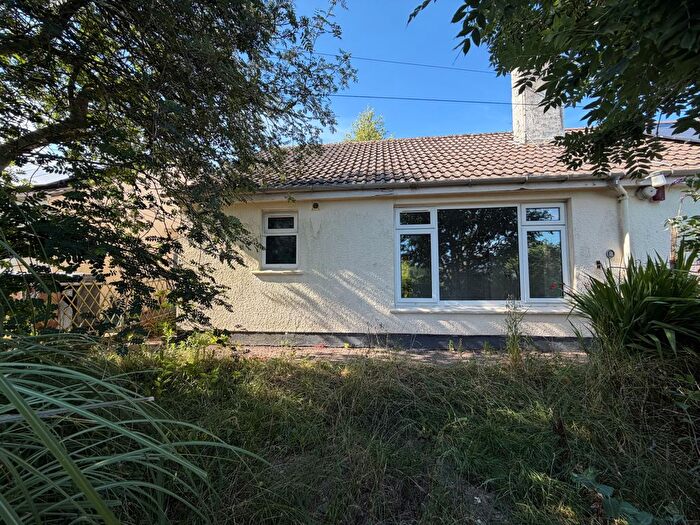
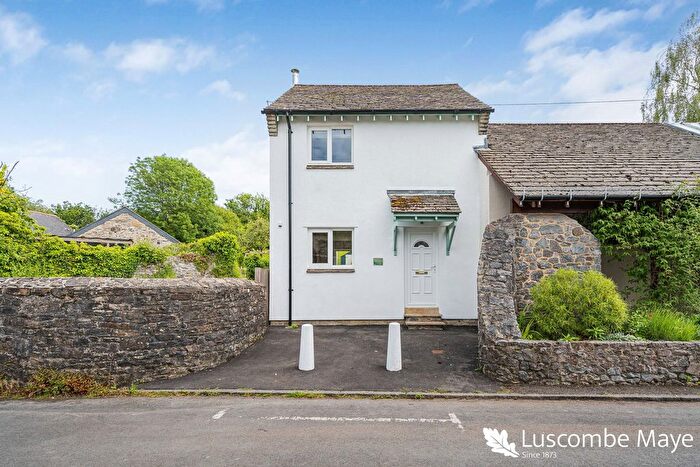
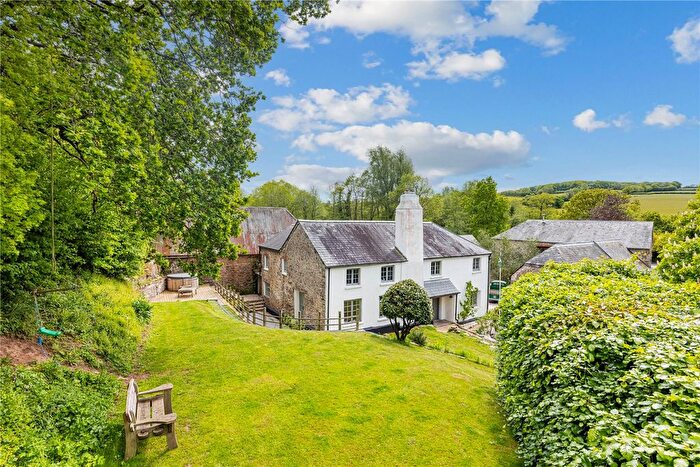
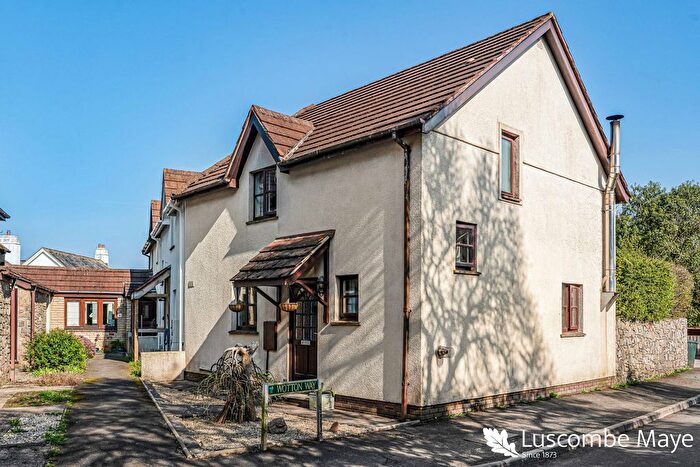
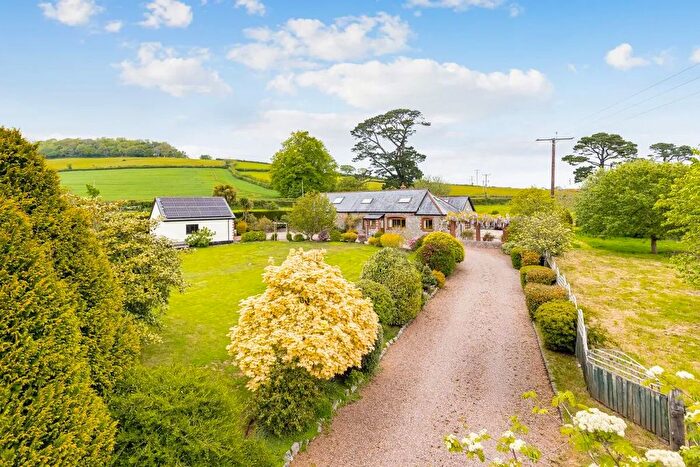
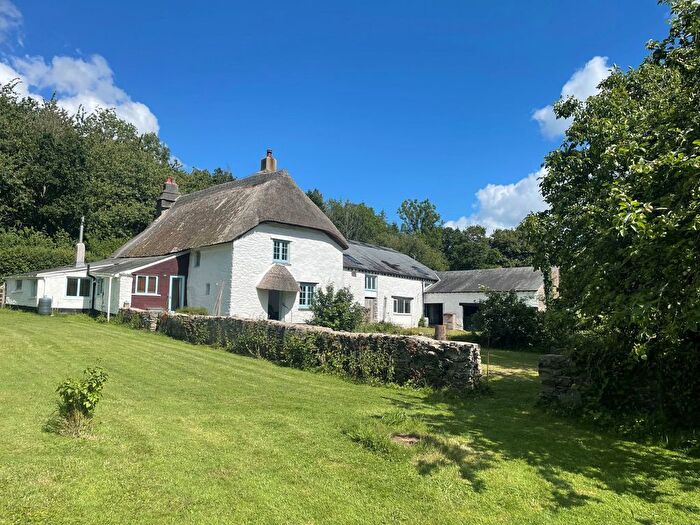
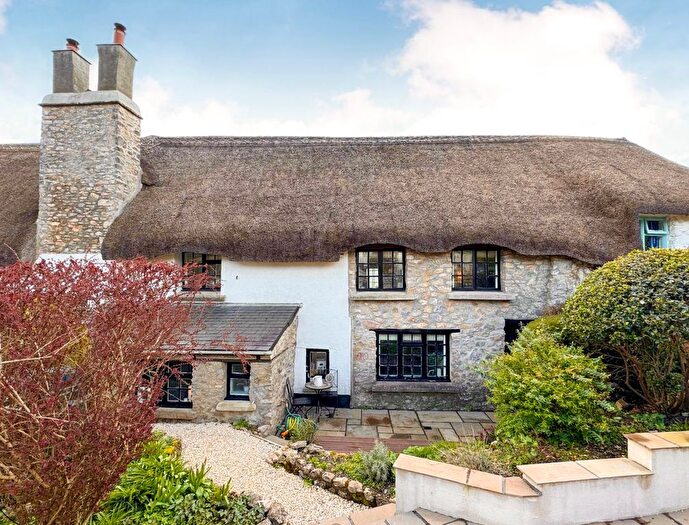
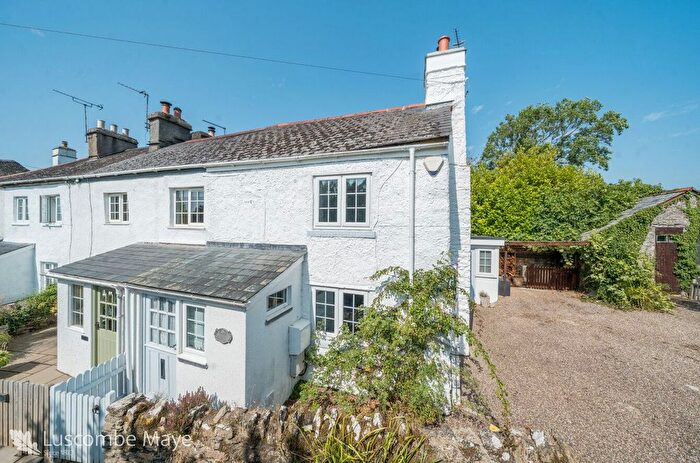
![]()
If you are looking to sell your house, let it out, or receive a property valuation, an expert can help you.
Click the button below to get started.


Roads and Postcodes in Ambrook
Navigate through our locations to find the location of your next house in Ambrook, Totnes for sale or to rent.
| Streets | Postcodes |
|---|---|
| Hembury Cottages | TQ9 6BS |
| Houndhead | TQ9 6AZ |
| Jubilee Orchard | TQ9 6BR |
| Kings Close Field | TQ9 6FW |
| No Place Hill | TQ9 6DD |
| Radfords Orchard | TQ9 6BD |
| St Josephs Cottages | TQ9 6BE |
| Wotton Way | TQ9 6DF |
| TQ9 6BA TQ9 6TG TQ9 6AT TQ9 6AU TQ9 6AX TQ9 6AY TQ9 6BB TQ9 6BG TQ9 6BH TQ9 6BJ TQ9 6BL TQ9 6BN TQ9 6BP TQ9 6BQ TQ9 6BT TQ9 6BU TQ9 6BW TQ9 6BX TQ9 6BY TQ9 6BZ TQ9 6DA TQ9 6DB TQ9 6FY TQ9 6GB TQ9 6NE |
Property price trends in Ambrook
According to the latest Land Registry data, the average home in Ambrook sold for £599,041 in 2025. That figure comes from 331 sales logged over the past 30 years.
Prices have fallen back over the last three years. Compared with 2022, when the typical sale came in around £809,071, that's a fall of roughly 26%.
Looking back five years, average prices are up about 20.1% since 2020, a gain of around £100,430 in cash terms.
Zoom out to the past decade for the fuller picture. Back in 2015, homes here averaged £343,272, so the typical sold price has climbed about 74.5% since then, roughly 5.7% a year. Stretch the view to fifteen years and that annual pace eases back to about 4.6%.
Frequently asked questions about Ambrook
What is the average price for a property for sale in Ambrook?
The average price for a property for sale in Ambrook is £797,803. This amount is 65% higher than the average price in Totnes. There are 54 property listings for sale in Ambrook.
What streets have the most expensive properties for sale in Ambrook?
The street with the most expensive properties for sale in Ambrook is Houndhead at an average of £854,166.
What streets have the most affordable properties for sale in Ambrook?
The street with the most affordable properties for sale in Ambrook is Radfords Orchard at an average of £698,000.
Which train stations are available in or near Ambrook?
Some of the train stations available in or near Ambrook are Totnes, Newton Abbot and Torre.
Property Price Paid in Ambrook by Year
The average sold property price by year was:
| Year | Average Sold Price | Price Change |
Sold Properties
|
|---|---|---|---|
| 2025 | £599,041 | -54% |
12 Properties |
| 2024 | £923,214 | -5% |
7 Properties |
| 2023 | £965,277 | 16% |
9 Properties |
| 2022 | £809,071 | 40% |
14 Properties |
| 2021 | £485,300 | -3% |
10 Properties |
| 2020 | £498,611 | 30% |
9 Properties |
| 2019 | £347,495 | -3% |
10 Properties |
| 2018 | £356,269 | -37% |
13 Properties |
| 2017 | £489,285 | 18% |
7 Properties |
| 2016 | £400,187 | 14% |
8 Properties |
Property Price per Property Type in Ambrook
Here you can find historic sold price data in order to help with your property search.
The average Property Paid Price for specific property types in the last three years are:
| Property Type | Average Sold Price | Sold Properties |
|---|---|---|
| Semi Detached House | £689,000.00 | 1 Semi Detached House |
| Terraced House | £422,333.00 | 9 Terraced Houses |
| Detached House | £991,583.00 | 18 Detached Houses |
