
Houses for sale & to rent in TQ13 7TQ, Moorland, Newton Abbot
House Prices in TQ13 7TQ, Moorland
Properties in TQ13 7TQ have an average house price of £663k and had 1 Property Transaction within the last 3 years.¹ TQ13 7TQ is a postcode in Moorland, an area in Newton Abbot, Devon, with 2 households², where the most expensive property was sold for £663k.
Previously listed properties near TQ13 7TQ
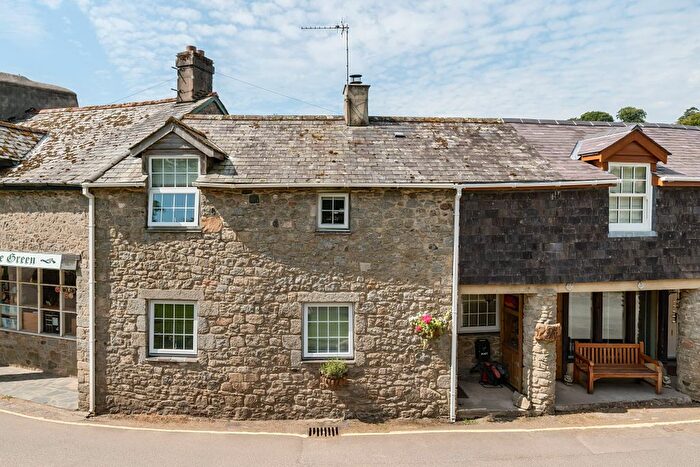
![]()
If you are looking to sell your house, let it out, or receive a property valuation, an expert can help you.
Click the button below to get started.

Price Paid in TQ13 7TQ, Moorland
MERRY PARK TQ13 7TQ, Moorland Newton Abbot
Property MERRY PARK has been sold 2 times. The last time it was sold was in 17/10/2025 and the sold price was £662,500.00.
This terraced house, sold as a freehold on 17/10/2025, is a 237 sqm detached bungalow with an EPC rating of C.
| Date | Price | Property Type | Tenure | Classification |
|---|---|---|---|---|
| 17/10/2025 | £662,500.00 | Terraced House | freehold | Established Building |
| 22/12/1995 | £48,160.00 | Terraced House | freehold | Established Building |
THREE HARES COTTAGE TQ13 7TQ, Moorland Newton Abbot
Property THREE HARES COTTAGE has been sold 2 times. The last time it was sold was in 09/03/2021 and the sold price was £395,000.00.
This semi detached house, sold as a freehold on 09/03/2021, is a 111 sqm semi-detached house with an EPC rating of D.
| Date | Price | Property Type | Tenure | Classification |
|---|---|---|---|---|
| 09/03/2021 | £395,000.00 | Semi Detached House | freehold | Established Building |
| 20/12/2013 | £334,000.00 | Semi Detached House | freehold | Established Building |
WILLOW COTTAGE TQ13 7TQ, Moorland Newton Abbot
Property WILLOW COTTAGE has been sold 1 time. The last time it was sold was in 23/08/2010 and the sold price was £349,000.00.
This is a Detached House which was sold as a freehold in 23/08/2010
| Date | Price | Property Type | Tenure | Classification |
|---|---|---|---|---|
| 23/08/2010 | £349,000.00 | Detached House | freehold | Established Building |
Transport near TQ13 7TQ
-
 Newton Abbot Station
 -
Totnes Station
-
Ivybridge Station
-
Torre Station
-
Okehampton Station
-
Torquay Station
-
Paignton Station
-
Teignmouth Station
House price paid reports for TQ13 7TQ
Click on the buttons below to see price paid reports by year or property price:
- Price Paid By Year
- Property Type Price
Property Price Paid in TQ13 7TQ by Year
The average sold property price by year was:
| Year | Average Sold Price | Price Change |
Sold Properties
|
|---|---|---|---|
| 2025 | £662,500 | 40% |
1 Property |
| 2021 | £395,000 | 15% |
1 Property |
| 2013 | £334,000 | -4% |
1 Property |
| 2010 | £349,000 | 86% |
1 Property |
| 1995 | £48,160 | - |
1 Property |
Property Price per Property Type in TQ13 7TQ
Here you can find historic sold price data in order to help with your property search.
The average Property Paid Price for specific property types in the last three years are:
| Property Type | Average Sold Price | Sold Properties |
|---|---|---|
| Terraced House | £662,500.00 | 1 Terraced House |